Phase behavior of mesoporous nanostructures templated by amphiphilic crystalline–crystalline diblock copolymers of poly(ethylene oxide-b-ε-caprolactone)†
Jheng-Guang
Li
and
Shiao-Wei
Kuo
*
Department of Materials and Optoelectronic Science, Center for Nanoscience and Nanotechnology, National Sun Yat-Sen University, Kaohsiung, 804, Taiwan. E-mail: kuosw@faculty.nsysu.edu.tw
First published on 1st November 2011
Abstract
A crystalline–crystalline diblock copolymer, poly(ethylene oxide-b-ε-caprolactone) (PEO-b-PCL), was synthesized through ring-opening polymerization using monomethoxy-poly(ethylene oxide) as a macro-initiator. The amphiphilic double-crystalline diblock copolymer was used as a template to prepare highly-ordered mesoporous silicas and phenolic resins using an evaporation-induced self-assembly (EISA) method. The mesophase transformation of mesoporous nanostructures, which contained different tetraethyl orthosilicate (TEOS) and phenolic resin contents, was investigated using small-angle X-ray scattering (SAXS) and transmission electron microscopy (TEM) analyses. The SAXS profiles revealed a sharp primary peak and highly long-range order reflections such as a cylinder or gyroid structures, at certain compositions of TEOS and phenolic resins, which was consistent with the TEM images. Fourier transform infrared spectroscopy (FTIR) analyses provided positive evidence that the ether group of PEO is a stronger hydrogen bond acceptor than the carbonyl of PCL with the hydroxyl group of TEOS or phenolic resin, resulting in the excluded and confined PCL phase. This is the first report suggesting that differential scanning calorimeter (DSC) analysis could be utilized as a convenient method to differentiate the morphology of mesoporous nanostructures in a crystalline–crystalline diblock copolymer.
Introduction
Ordered mesoporous materials with a high surface area, large pore volume, and mechanical stability, have received much attention for their potential applications in adsorption, separation, catalysis, photonics, and drug delivery in recent years.1–44 Mobil scientists first reported the synthesis of mesoporous silicas using cationic surfactants such as cetyltrimethylammonium bromide (C16H33N(CH3)3Br, CTAB) as the template to obtain highly-ordered mesoporous molecular sieves (M41S) under hydrothermal and basic conditions.45,46 Following that report a large number of studies were conducted to investigate the formation of mesostructures on the basis of low molecular weight surfactants by cooperation of self-assembly or true liquid-crystal templating processes.47–52 A dominant strategy involves templating of the mesophase growth by volatile solvent evaporating induction and is known as the evaporation-induced self-assembly (EISA) strategy. This technique is an alternative synthetic approach that allows the tuning of inorganic condensation with the formation of a meso-organized liquid-crystal template.14,53–65 As the solvent is removed, a mesophase is gradually formed.Amphiphilic block copolymers provide a versatile platform for fabricating large-area periodic nanostructures by controlling the self-assembly behavior, with length scales varying from a few nanometres to several hundred nanometres. Furthermore, block copolymers have attracted particular interest due to their ability to form a rich variety of self-assembling nanostructures, such as lamellar, hexagonally packed cylindrical, and body-centered cubic micellar structures as a result of the relative volume fractions of the blocks, total degree of polymerization, and Flory–Huggins interaction parameter; some examples include ref. 66–75.
However, the majority of amphiphilic diblock copolymers are water insoluble, and the EISA strategy becomes very important when fabricating various mesoporous nanostructures with large pores. A variety of synthetic strategies have been developed based on poly(ethylene oxide)-b-poly(propylene oxide)-b-poly(ethylene oxide) (PEO-PPO-PEO) triblock copolymers as templates to obtain many highly ordered large-pore mesoporous silicas.58,62,64,76–96 Commercially available PEO-PPO-PEO triblock copolymers are seldom able to directly template ordered mesoporous silicas with pore sizes larger than 12 nm because of molecular weight and composition limitations. High-molecular-weight copolymers with long hydrophobic segments, such as poly(ethylene-oxide-b-styrene) (PEO-b-PS), are promising candidates to template large-pore mesoporous silicates because the pore dimensions are primarily related to the molecular weights of the hydrophobic segments.55,61
Similar to the inorganic–organic assembly for mesoporous silicas, the organic–organic self-assembly approach has also been successfully used to synthesize ordered mesoporous carbon frameworks.54,57–59,97–104 Recently, a family of carbon mesostructures, including two-dimensional (2-D) hexagonal (space group of p6mm), 3-D bicontinuous ( ), body-centered cubic (Im
 m) and lamellar symmetries, was prepared using phenolic resins as a carbon source and PEO-PPO-PEO triblock copolymers as templates.57–58,98–99 The pore sizes of mesoporous carbons were limited due to the low molecular weight copolymers. Employing ordered mesoporous silica such as SBA-1576,77 and KIT-6105 as hard templates can replicate carbon with an ordered mesostructure and large porosity; this result was thought to be a breakthrough in the area of mesostructured materials.106–108 A new synthetic strategy for the preparation of ordered mesoporous carbons with diverse mesostructures has been developed based on the organic–organic self-assembly between PEO-PPO-PEO templates and thermosetting phenolic resin precursors for the direct templating-synthesis of ordered mesoporous carbons with various pore structures. Here, a lab-made diblock copolymer PEO-b-PCL (Mw = 14
![[thin space (1/6-em)]](https://www.rsc.org/images/entities/char_2009.gif) 600) was synthesized as a new template to prepare ordered mesoporous carbons using an EISA strategy. The pore size of ordered mesoporous carbons was 11 nm in the presented study.
600) was synthesized as a new template to prepare ordered mesoporous carbons using an EISA strategy. The pore size of ordered mesoporous carbons was 11 nm in the presented study.
The PEO-b-PCL diblock copolymer consisted of two immiscible crystallizable blocks wherein both PEO and PCL blocks could form hydrogen bonds with the phenolic resin. In the A-b-B/C diblock copolymer/homopolymer blends, microphase separation occurred from the disparity in the intermolecular interactions.70–75,109–112 The hydrogen bonding between PEO and the phenolic resin was significantly stronger than that between PCL and the phenolic resin. Selective hydrogen bonding between the phenolic/PEO pair at relatively lower phenolic contents and co-existence of two competitive hydrogen bonding interactions between phenolic/PEO and phenolic/PCL pairs at relative higher phenolic contents were observed in this blend.113 This effect leads to the formation of a variety of composition-dependent nanostructures, including disordered, gyroid and short cylinder. Similar to the silica/PEO-b-PCL films, as the ratios of the TEOS/PEO-b-PCL mixtures increase, the morphologies of the mesophase change from a long cylinder to a short cylinder. To the best of our knowledge, no studies have been reported on making use of the self-assembly of double crystalline PCL-based amphiphilic diblock copolymers as structure-directing agents in the synthesis of mesostructured silica and phenolic resin films. As a result of the special confinement effect of the double crystalline amphiphilic PEO-b-PCL diblock copolymer, we can utilize a convenient method that uses DSC to characterize the morphology of mesoporous nanostructures in a crystalline–crystalline diblock copolymer PEO-b-PCL, but it does not work in a crystalline–amorphous diblock copolymer such as PEO-b-PS.114 The phase behaviors and compete interactions of the mesostructures were investigated using Fourier transform infrared (FTIR) spectroscopy, high-resolution scanning electron microscopy (HRSEM), small-angle X-ray scattering (SAXS) and transmission electron microscopy (TEM) analyses.
Experimental
Materials
Monomethoxy-poly(ethylene glycol) with a molecular weight of 5000 (MPEG-5 K) was obtained from Fluka and dried by azeotropic distillation with dry toluene. ε-Caprolactone (ε-CL, Acros) was purified by vacuum distillation over CaH2. The distillation fraction collected at 96–98 °C (5 mm-Hg) was used in all polymerization. Stannous(II) octoate [Sn(Oct)2, Sigma Corp.] was used as received. Methylene chloride was dried over CaH2 prior to use. The phenolic was synthesized with sulfuric acid in a condensation reaction, which produced average molecular weights (Mn = 500) that are described in previous studies.115–118Hexane, tetrahydrofuran (THF), tetraethyl orthosilicate (TEOS), HCl, and HMTA (all from Aldrich) were used as received. Deionized water was used for all experiments.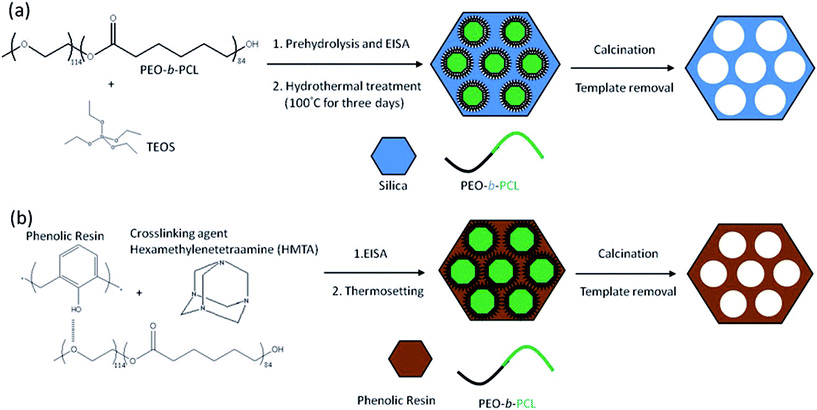 | ||
| Scheme 1 Preparation of (a) mesoporous silicas and (b) mesoporous phenolic resins. | ||
Results and discussion
Synthesis of PEO-b-PCL
The PEO-b-PCL diblock copolymer with a high molecular weight (∼14![[thin space (1/6-em)]](https://www.rsc.org/images/entities/char_2009.gif) 600 g mol−1) was easily prepared from a simple one-step ring opening polymerization (ROP) method. The number average molecular weights (Mn) of the prepared copolymers were determined from 1H NMR spectra by comparing the peak intensity of MPEG-5 K (–CH2CH2O–, δ = 3.65 ppm) to that of PCL (–O–CH2–, δ = 4.10 ppm), considering the molecular weight (Mn = 5000) for MPEG-5 K (Fig. S1, ESI†). Gel-permeation chromatography (GPC) reported a polydispersity index (PDI) of 1.48 for the PEO-b-PCL diblock copolymer. The TGA of PEO-b-PCL showed a weight loss of approximately 98 wt% in the temperature range from 320 to 430 °C under nitrogen (Fig. S2, ESI†), and it showed 94 wt% loss between 275 and 330 °C under air (Fig. S3, ESI†). This result implies that the template can be easily removed by pyrolysis both in nitrogen and air.
600 g mol−1) was easily prepared from a simple one-step ring opening polymerization (ROP) method. The number average molecular weights (Mn) of the prepared copolymers were determined from 1H NMR spectra by comparing the peak intensity of MPEG-5 K (–CH2CH2O–, δ = 3.65 ppm) to that of PCL (–O–CH2–, δ = 4.10 ppm), considering the molecular weight (Mn = 5000) for MPEG-5 K (Fig. S1, ESI†). Gel-permeation chromatography (GPC) reported a polydispersity index (PDI) of 1.48 for the PEO-b-PCL diblock copolymer. The TGA of PEO-b-PCL showed a weight loss of approximately 98 wt% in the temperature range from 320 to 430 °C under nitrogen (Fig. S2, ESI†), and it showed 94 wt% loss between 275 and 330 °C under air (Fig. S3, ESI†). This result implies that the template can be easily removed by pyrolysis both in nitrogen and air.
Phase behavior of mesoporous silicas
PEO-b-PCL is insoluble in water and ethanol because of the high molecular weight PCL segment. Therefore, the EISA approach in THF was employed to synthesize mesoporous silicas, phenolic resins, and carbon. DSC experiments were performed to investigate the thermal properties of the silica/PEO-b-PCL nanocomposites. Fig. 1 shows the DSC traces of pure PEO-b-PCL and silica/PEO-b-PCL nanocomposites recorded by the cooling scan at a cooling rate of 5 °C min−1. The peak temperature of the crystallization exotherm is defined as the freezing temperature (Tf), at which a higher Tf corresponds to a faster crystallization rate. Previous works have reported that the Tf associates with the nonisothermal crystallization under a fixed cooling rate and displays a distinct correlation with the microdomain structure.114,120–124 The pure PEO-b-PCL block copolymer exhibited a crystallization peak at 36 °C (PEO block) and 29 °C (PCL block).112 The crystallization ability of the PEO block is restricted by the PCL block, which is covalently coupled to the other end of the PEO block. These results indicate that there are two separated crystalline microdomains in these diblock copolymers that are comprised of the PEO and PCL blocks. When the silica/PEO-b-PCL ratio was= 1/1, two crystallization behaviors (two exotherms) were found at 31 °C and −49 °C. The higher freezing temperature may be from the crystallization of the PEO block. The second exotherm found at a lower freezing temperature, which was not present in either the PEO or the PCL homopolymer, appeared with more supercooling. Chen et al.114,120 reported that the degree of supercooling ( ,Tm0 = 75 °C)123 required to initiate crystallization in the lamellar microdomains (ΔT = 50 °C) is comparable to that associated with the PCL homopolymer (ΔT = 42 °C); exceedingly large undercoolings are required for crystallizations in the cylindrical microdomains (Tf = −50 °C,ΔT = 125 °C).123 As a result, the second exotherm at a lower Tf (−49 °C) may be from the PCL block in a 2D cylindrical confinement (ΔT= 124 °C) because the lowest Tf of the PEO block in 3D sphere confinement was at −30 °C.114 The crystallization kinetics exhibited distinct transitions at the compositions corresponding to the morphological transformation, which demonstrates the feasibility of exploiting the microdomain pattern by manipulating the crystallization kinetics of the block chains. When the ratio of silica/PEO-b-PCL was further increased to 5/1, the Tf of PCL rose slightly to −44 °C, and the Tf of PEO completely disappeared. This result was attributed to the mesophase transformation of the silica/PEO-b-PCL nanocomposite from a long cylinder to a short cylinder (determined by SAXS and TEM) and the crystal structure destruction of PEO domain. Further increasing the silica/PEO-b-PCL ratio to 10/1 yielded a very small Tf for PCL at approximately −49 °C from distorted short cylinders (determined by SAXS and TEM). In addition, when the silica/PEO-b-PCL ratio was increased to 15/1, both crystallization peaks disappeared, implying that the crystalline structures of both PEO and PCL blocks were destroyed.
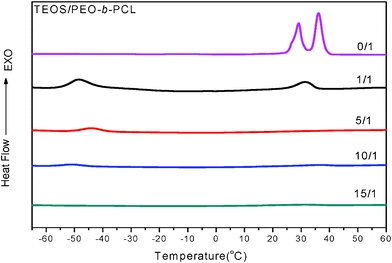 | ||
| Fig. 1 DSC thermograms of the crystallization curve with different ratios of silica/PEO-b-PCL. | ||
The structures of mesoporous silicas templated by double crystalline amphiphilic PEO-b-PCL were first investigated using TEM and SAXS as shown in Fig. 2 and 3. The SAXS pattern in Fig. 2 for TEOS/PEO-b-PCL = 1/1 (named silica-a) shows the maximum intensity at approximately q* = 0.267 nm−1 (d = 23.5 nm), and higher-order reflections at 31/2q* and 2q* were observed. A long cylinder structure was observed in the TEM image in Fig. 3a. When TEOS/PEO-b-PCL = 5/1 (see Fig. 2, named silica-b), the maximum intensity appeared at approximately q* = 0.26 nm−1 (d = 24.1 nm), and higher-order reflections at 31/2q* and 2q* were observed; these data were characteristic for a short cylindrical structure, which is further confirmed by TEM as shown in Fig. 3b. It was found that the TEOS/PEO-b-PCL weight fractions had an influence on the formation of the mesostructure. As the ratio of TEOS/PEO-b-PCL increased, the products experienced a remarkable mesophase transformation from a long cylinder to a short cylinder. A TEM image of silica-b clearly indicates a hexagonal pore structure, which confirms that silica-b has a 2D hexagonal mesoporous structure. When the TEOS/PEO-b-PCL ratio increases, distorted short cylinders (silica-c, Fig. 2 and 3c) and disordered structures (silica-d, Fig. 2 and 3d) were observed because the ratio of the TEOS/PEO-b-PCL is too high to form long-range ordered structures. The TEM images provided additional evidence for the mesostructure changes. The transformation of mesoporous silicas from long cylinders to short cylinders was also in agreement with the FE-SEM measurements, as shown in Fig. 4. The FE-SEM image of silica-a in Fig. 4a displays a roughly flat surface and shows the side view of the hexagonal cylinder structure. However, the silica-b sample in Fig. 4b shows uniform and regularly aligned mesopores throughout the whole film, suggesting the top view of a highly ordered hexagonal cylinder mesostructure over a large domain. The morphological results were consistent with DSC analyses; the second exothermic peak (Tf = −49 °C) of TEOS/PEO-b-PCL = 1/1 was attributed to the mesophase for PCL crystallizations in a long cylinder of 2D confinement. The Tf raised slightly to Tf = −44 °C and corresponded to the mesophase transformation from a long cylinder to a short cylinder of TEOS/PEO-b-PCL = 5/1.
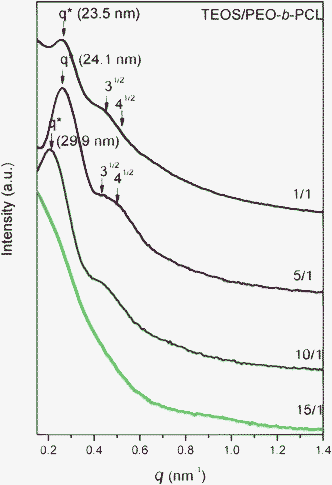 | ||
| Fig. 2 SAXS patterns of mesoporous silicas templated by PEO-b-PCL with different TEOS/PEO-b-PCL weight fractions. | ||
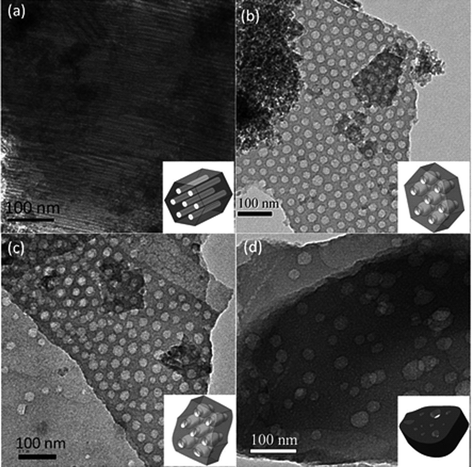 | ||
| Fig. 3 TEM images of mesoporous silicas templated by PEO-b-PCL with different TEOS/PEO-b-PCL weight fractions: (a)1/1, (b)5/1, (c)10/1, and (d)15/1. | ||
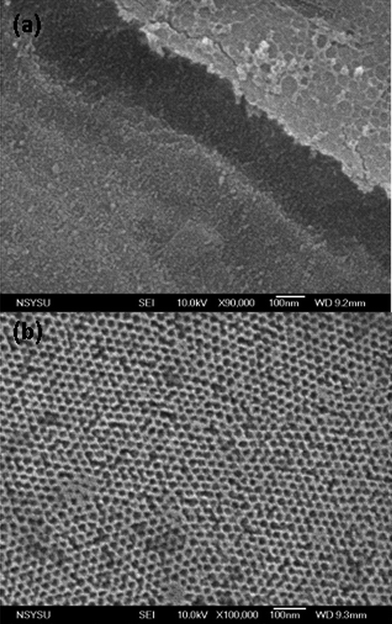 | ||
| Fig. 4 FE-SEM images of mesoporous silicas templated by PEO-b-PCL with different TEOS/PEO-b-PCL weight fractions: (a)1/1 and (b)5/1. | ||
Nitrogen sorption isotherms of mesoporous silicas behaved like representative type IV curves with a sharp capillary condensation step in the relative pressure range of 0.85 to 0.95 as shown in Fig. 5A. This result indicates the generation of mesopores with an ultralarge uniform size. The silica-a sample exhibited an H1-like hysteresis loop at P/P0 = 0.4 to 0.9, which is indicative of a typical mesoporous structure with large cylindrical pores. The H2 hysteresis loop found for silica-b was characteristic of the cage-like mesopores. On the basis of the Broekoff–de Boer (BdB) sphere model, the mean pore size measured from the adsorption branch was as large as 19.8 nm as shown in Fig. 5B. Similar isotherms with large H2-type hysteresis loops can also be detected for silica-c. The mean pore size in Fig. 5B for silica-c, calculated from the BdB sphere model, was 22.5 nm and slightly larger than that of silica-b. The total pore volume and the total BET surface area of silica-b (0.33 cm3 g−1 and 170 m2 g−1, respectively), were smaller than those of silica-a (2.70 cm3 g−1 and 1188 m2 g−1, respectively, Table 1).These results confirmed the presence of the cage-like mesopores of short cylinders that were transferred from the cylindrical mesopores of the long cylinders. Because the PEO-b-PCL weight fraction of silica-a is much larger than that of silica-b and the block polymer part played the role of space in silica/PEO-b-PCL after calcinations, hence the BET surface area of silica-a is much larger than that of silica-b. Both silica-c and silica-d displayed H2 hysteresis loops, implying a cage-like pore structure connected by small windows. The BET surface area, pore volume and BJH pore size of the silica materials are summarized in Table 1, indicating that the ratio of TEOS/PEO-b-PCL plays an important role in the determination of the described properties.
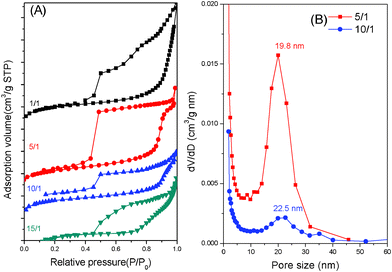 | ||
| Fig. 5 (a) N2 adsorption–desorption isotherms and (b) pore size distribution curves of mesoporous silicas templated by PEO-b-PCL with different TEOS/PEO-b-PCL weight fractions. | ||
| Sample | d (nm)a | Pore size (nm) | SBET (m2 g−1)b | SM (m2 g−1)b | Pore volume (cm3 g−1) | Micropore volume (cm3 g−1) | TEOS/PEO-b-PCLc | Morphology |
|---|---|---|---|---|---|---|---|---|
| a The d-spacing values were calculated by the formula d = 2π/q*. b SBET and SM are the total BET surface area and micropore surface area calculated from the t-plots, respectively. c Mesoporous silicas were prepared from 0.1 g of EO114CL84 and 0.1 g of 0.1 M HCl(aq). d Mesoporous phenolic resins were prepared from 0.1 g of EO114CL84. e Mesoporous carbon was synthesized from phenolic-b pyrolyzed at 800° C in N2. | ||||||||
| Silica-a | 23.5 | — | 1188 | 389 | 2.70 | 0.17 | 1/1 | Long cylinder |
| Silica-b | 24.1 | 19.8 | 170 | 50 | 0.33 | 0.02 | 5/1 | Short cylinder |
| Silica-c | 29.9 | 22.5 | 106 | 64 | 0.11 | 0.03 | 10/1 | Distorted short cylinder |
| Silica-d | — | — | 71 | 18 | 0.08 | 0.01 | 15/1 | Disorder |
| Phenolic/PEO-b-PCLd | ||||||||
| Phenolic-a | 22.4 | 15.6 | 403 | 202 | 0.42 | 0.09 | 40/60 | Short-range order |
| Phenolic-b | 23.6 | 13.9 | 328 | 143 | 0.35 | 0.07 | 50/50 | Gyroid |
| Phenolic-c | 23.6 | 11.0 | 68 | 22 | 0.07 | 0.01 | 60/40 | Distorted short cylinder |
| Phenolic-d | — | — | — | — | — | — | 70/30 | Disorder |
| Carbon e | 18.6 | 11.0 | 858 | 647 | 0.59 | 0.30 | 50/50 | gyroid |
Phase behavior of mesoporous phenolic resins
Similar to the process with mesoporous silicas, we first investigated the thermal behavior of the phenolic/PEO-b-PCL blends using DSC. In general, DSC analysis is a convenient method used to determine miscibility and crystallization in polymer blends. Fig. 6 displays DSC thermograms for the phenolic/PEO-b-PCL blends (first cooling scan in Fig. 6b and second heating scan in Fig. 6a) and their curing products with HTMA at various constituent compositions (first cooling scan in Fig. 6c). The blends contain a block copolymer with two immiscible blocks, which is intended to exhibit two Tgs corresponding to the PCL blocks and the PEO blocks.75 However, the Tgs of pure block copolymer components were not detected using the present experimental conditions. The binary pairs of phenolic/PCL125,126 and phenolic/PEO113 are completely miscible in all compositions in the amorphous phase due to inter-association hydrogen bonding between the hydroxyl group of phenolic and the carbonyl group of PCL and ether group of PEO, respectively; this effect has been reported in our previous studies.113 Clearly, the two values of Tg became closer when phenolic resin contents increased, as shown in Fig. 6a. This result indicated that microphase separation (ordered structure) occurred at lower phenolic contents (<60 wt%). A single Tg corresponding to a miscible phenolic/PEO-b-PCL blend was comprised of up to 70 wt% phenolic resin, which is consistent with ternary phenolic/PEO/PCL blends (> 65 wt% phenolic are miscible).64 The miscibility between these two components is due to the formation of strong intermolecular hydrogen bonding. Phenolic acts as a common solvent for PCL and PEO and induces the blends to become completely miscible (disorder structure) at higher phenolic resin contents. As shown in Fig. 6b and 6c, pure PEO-b-PCL displays two crystallization temperatures at 29 and 36 °C, which is also shown in Fig. 1. The two crystallization peaks became one single peak as the phenolic resin content increased (< 40 wt%). Additionally, the lowest Tf was observed at −6 °C for phenolic/PEO-b-PCL = 40/60, which was different than with the TEOS/PEO-b-PCL system. A further increase in phenolic content only showed glass transition temperatures. This result was consistent with the second heating scan in Fig. 6a that showed no melting peaks at phenolic resin contents above 50 wt%. The single exothermic peak was likely from the crystallization of the PCL block, because most hydroxyl groups in the phenolic resin were preferably interacting with the oxygen atoms in PEO at lower phenolic contents. The result indicated relatively lower hydrogen-bonded carbonyl groups in PCL, and the PCL phase was excluded from the phenolic/PEO phase to form a more regular microphase separation structure. The primary reason for microphase separation was due to the inter-association equilibrium constant at 264 (KA = 264) of the hydroxyl-ether of phenolic/PEO, which was found to be substantially higher than the KA (KA = 116.8) from the hydroxyl-carbonyl formation of phenolic/PCL.113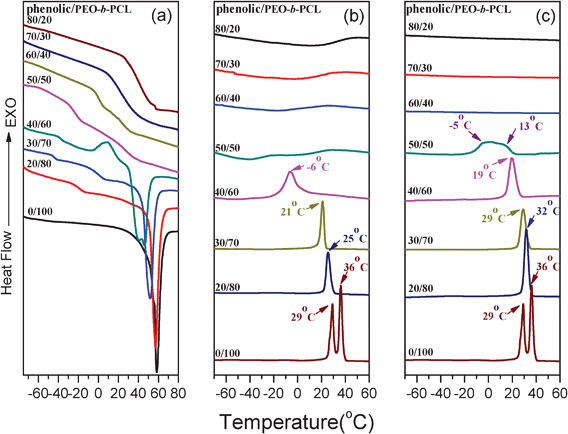 | ||
| Fig. 6 DSC thermograms of (a) second heat scan and (b) first cooling scan of phenolic/PEO-b-PCL blends, (c) first cooling scan of phenolic/PEO-b-PCL blends after curing. | ||
FTIR spectroscopy is an excellent tool for detecting hydroxyl, carbonyl, and ether vibrations in blend systems. Phenolic resin shows excellent potential as a proton donor for hydrogen bonding interactions with proton-acceptor polymers because the hydroxyl group is easily accessible in the 4-position of the aromatic ring. As shown in Fig. S4a (ESI†), pure phenolic exhibits two bands in the hydroxyl-stretching region. The self-associated hydroxyl group absorption was located at 3350 cm−1 and was primarily due to the wide distribution of hydrogen-bonded hydroxyl groups (self-associated). The free hydroxyl groups displayed a band at 3525 cm−1. As the concentration of the block copolymer increased, the intensity of the free hydroxyl band decreased and disappeared, implying the formation of hydrogen-bonding between the hydroxyl group of phenolic and PEO-ether or PCL-carbonyl groups. In addition, Fig. S7a (ESI†) displays the hydroxyl group shifting to a lower wavenumber when the PEO-b-PCL is the rich content in the blend (lower phenolic content), implying that the phenolic hydroxyl preferably interacts with the PEO ether. Therefore, it is reasonable to assign the band at 3250 cm−1 to the hydrogen-bonded hydroxyl with the ether because a relatively smaller number of the hydroxyl groups appeared to interact completely with the ether groups of the PEO block to form hydrogen-bonds. The peak frequency of the broad band shifted higher with increasing phenolic content. A new distribution of hydrogen-bonding formation resulted from the competition between the hydroxyl-hydroxyl group within the pure phenolic and the hydroxyl-carbonyl group between phenolic and PCL (3410 cm−1).
The carbonyl group in the PCL blocks is also sensitive to hydrogen-bonding interactions (Fig. S4b, ESI†). The carbonyl stretching for the pure PCL is split into two bands: absorptions by the amorphous and the crystalline conformations at 1734 cm−1 and 1724 cm−1, respectively. The crystalline conformation at 1724 cm−1 disappeared with an increase in phenolic content. An additional band appearing at approximately 1703 cm−1 was assigned as the PCL carbonyl group that was hydrogen-bonded to the phenolic hydroxyl group. The carbonyl stretching frequency split into only two bands at 1734 cm−1 and 1705 cm−1, corresponding to the free and the hydrogen-bonded carbonyl groups, respectively. It is clear that the phenolic hydroxyl is able to form hydrogen bonds with both PEO and PCL when the phenolic content is above 40 wt% (Table S1, ESI†). The hydroxyl groups of phenolic formed hydrogen bonds only preferentially with the ether of PEO when the phenolic content was below 40 wt%, indicating the PCL phase was excluded from the phenolic/PEO phase (relative lower fraction of H-bonded C![[double bond, length as m-dash]](https://www.rsc.org/images/entities/char_e001.gif) O group of PCL); this result was consistent with DSC analyses.
O group of PCL); this result was consistent with DSC analyses.
The structures of mesoporous phenolic resins that were templated by the double crystalline amphiphilic diblock copolymer PEO-b-PCL were also investigated using TEM and SAXS, as shown in Fig. 7 and 8. These figures suggest that the phenolic contents have an influence on the formation of the mesostructure. In SAXS, pure PEO-b-PCL block copolymer revealed a lamellae character for the special ratio of q* and 2q*. A remarkable mesophase transformation through short range order, gyroid, short cylinder and finally to disordered structures was observed with an increase in phenolic resin contents. The short-range order morphology was observed when phenolic/PEO-b-PCL = 40/60 (phenolic-a) by SAXS analysis, as shown in Fig. 7a. Based on only one scattering peak at q* = 0.27 nm−1, d = 23.2 nm was consistent with the TEM image in Fig. 8a. There was not enough phenolic resin to include the template PEO-b-PCL block copolymer and to form a complete mesoporous structure. A highly-ordered bicontinuous gyroid structure was observed at phenolic/PEO-b-PCL = 50/50 (phenolic-b) based on SAXS and TEM. In SAXS patterns, as shown in Fig. 7b, the intensity maximum appears at 61/2q* = 0.26 nm−1 (d = 24.1 nm). The higher-order reflections at 241/2q*, 381/2q* and 501/2q* were observed, which are characteristic for a long-range order of bicontinuous gyroid structure, and were further confirmed by TEM images, as shown in Fig. 8b. When phenolic/PEO-b-PCL = 40/60 (phenolic-c), the maximum intensity appeared at approximately q* = 0.26 nm−1 (d = 24.1 nm) and had a higher-order reflection at 31/2q* and 2q*, as seen in Fig. 7c. These values were characteristic for a short cylindrical structure, which was further confirmed by TEM due to the volume fraction of phenolic resin raising the outer domain as shown in Fig. 8c. However, it presented a disordered structure when the ratio increased to phenolic/PEO-b-PCL = 70/30 (phenolic-d), by the SAXS analysis in Fig. 7d. This analysis presented broad peaks that indicated the absence of a long-range ordered structure, which was further confirmed in Fig. 8d by TEM. This result also agreed with DSC and FTIR analyses. The phenolic hydroxyl was able to form hydrogen bonds with both PEO and PCL according to FTIR spectroscopy (Fig. S4, ESI†). A completely miscible blend by DSC analysis was due to only one single Tg in Fig. 6 when the phenolic content was at 70 wt%.
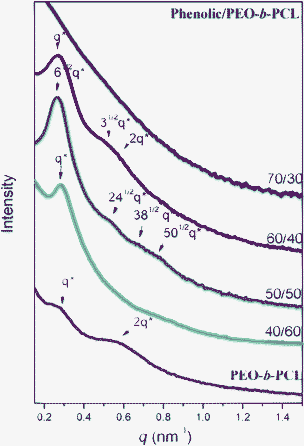 | ||
| Fig. 7 SAXS patterns of mesoporous phenolic resins from different weight fractions of phenolic/PEO-b-PCL blends. | ||
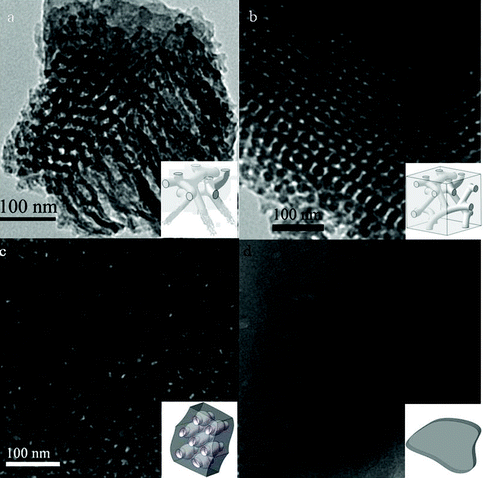 | ||
| Fig. 8 TEM image of mesoporous phenolic resins from different weight fractions of phenolic/PEO-b-PCL blends: (a) 40/60, (b) 50/50, (c) 60/40, and (d) 70/30. | ||
Mesoporous phenolic resins exhibited similar N2 sorption isotherms to mesoporous silicas, as shown in Fig. 9A. N2 sorption isotherms of mesoporous phenolic resins behaved like representative type IV curves with a sharp capillary condensation step in the relative pressure range of 0.85 to 0.95. These data indicated the generation of mesopores with a large uniform size. The phenolic-a and phenolic-b samples exhibited a typical H1-like hysteresis loop at P/P0 = 0.4 to 0.9, indicating a common mesoporous structure with branched cylindrical large pores. The H1 hysteresis loop found for phenolic-a was the characteristic of the cylindrical mesopores. Based on the Harkins and Jura model, the mean pore size measured from the adsorption branch was as large as 15.6 nm, as shown in Fig. 9B. Similar isotherms with the H1-type hysteresis loops could also be detected for phenolic-b. The mean pore size (Fig. 9B) of phenolic-b calculated from the Harkins and Jura model (13.9 nm) was similar, but slightly smaller, than that of phenolic-a. The total pore volume and the total BET surface area of phenolic-b were 0.35 cm3 g−1 and 328 m2 g−1, respectively. These values were much larger than that of phenolic-c (Table 1), confirming the presence of the distorted short cylinder mesopores that were transferred from the cylindrical mesopores of the gyroid structure. To the best of our knowledge, this study is the first to fabricate a long-range order of bicontinuous gyroid type mesoporous phenolic resin using an EISA strategy. The BET surface area, pore volume and BJH pore size of mesoporous phenolic resins are summarized in Table 1.
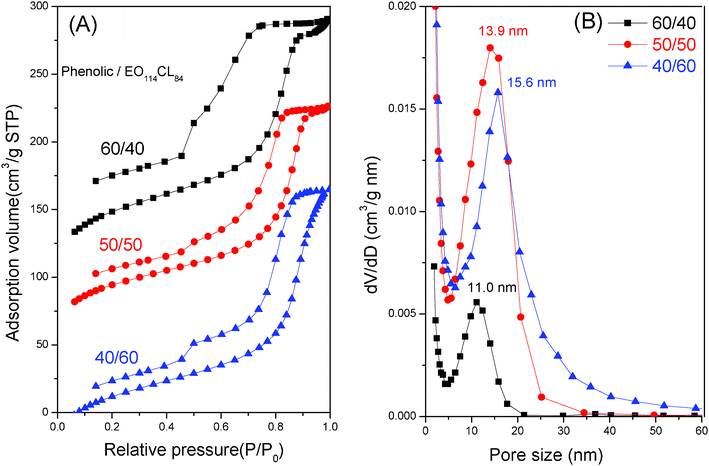 | ||
| Fig. 9 (A) N2 adsorption–desorption isotherms and (B) pore size distribution curves of mesoporous resins templated by PEO-b-PCL with different phenolic/PEO-b-PCL weight fractions. | ||
Furthermore, a special appearance was found in the SAXS of the mesoporous silicas and phenolic resins with an increase in the ratio of TEOS/PEO-b-PCL or phenolic/PEO-b-PCL as shown in Scheme 2. The d-spacing of the mesoporous silicas and phenolic resins showed a similar phenomenon that both increased upon increasing the ratios of TEOS/PEO-b-PCL and phenolic/PEO-b-PCL. However, the pore size of mesoporous silicas increased when increasing the ratio of TEOS/PEO-b-PCL. The mesoporous phenolic resins presented different trends that became smaller when increasing the ratio of phenolic/PEO-b-PCL, as shown in Table 1. This result is described by the different intermolecular hydrogen-bonding interactions between silica precursors or uncured phenolic resin with the PEO-b-PCL block copolymer. It was expected that the intermolecular hydrogen bonding strength of phenolic–OH with PEO was stronger than that of Si–OH with PEO.127,128 As a result, the uncured phenolic resin would dissolve in both PEO and PCL blocks, but silica precursors would only locate at the corona of micelle in the PEO-b-PCL diblock copolymers. In addition, the hydroxyl group of the phenolic resin will also interact with the carbonyl of the PCL block at relative higher phenolic contents, resulting in the decrease of mesopore size after calcinations. This interaction will not occur in the silica system. Fig. S5 (ESI†) shows photograph images of a cured phenolic/PEO-b-PCL = 50/50 blend and its pyrolyzed product, implying that we can maintain the original shape of phenolic/PEO-b-PCL thin film after calcinations. The mesoporous phenolic resin thin film can be obtained and applied to various fields such as mesoporous carbon (Fig. S6 and S7, ESI†).
 | ||
| Scheme 2 Morphology changes in mesoporous silicas and mesoporous phenolic resin. | ||
Conclusions
We have successfully synthesized crystalline–crystalline block copolymers of PEO-b-PCL in the present study. DSC, FTIR, SAXS and TEM techniques were employed to investigate the crystalline behavior, competing hydrogen bonding interaction and mesoporous nanostructure of silicas and phenolic resins. The cooling results from DSC showed that the structure transition of PCL occurred through the Tf of PCL changing. TEM images and SAXS analyses indicated that different compositions of TEOS/PEO-b-PCL or phenolic/PEO-b-PCL blends resulted in different mesoporous nanostructures through the mediation of hydrogen bonding interactions between silica, phenolic resins and the PEO-b-PCL block copolymer. FT-IR spectra also provided evidence that the PEO ether group was a stronger hydrogen bond acceptor than the PCL carbonyl group. We obtained different mesoporous nanostructures of silicas and phenolic resins.Acknowledgements
This work was supported financially by the National Science Council, Taiwan, Republic of China, under Contract No. NSC 97-2221-E-110-013-MY3 and NSC-99-2628-E-110-003.References
- X. Zhuang, Y. Wan, C. M. Feng, Y. Shen and D. Y. Zhao, Chem. Mater., 2009, 21, 706 CrossRef CAS.
- Z. X. Wu, Y. X. Yang, B. Tu, P. A. Webley and D. Y. Zhao, Adsorpt.-J. Int.Adsorpt. Soc., 2009, 15, 123 Search PubMed.
- S. B. Wang, Microporous Mesoporous Mater., 2009, 117, 1 CrossRef CAS.
- G. Oye, W. R. Glomm, T. Vralstad, S. Volden, H. Magnusson, M. Stocker and J. Sjoblom, Adv. Colloid Interface Sci., 2006, 123, 17 CrossRef.
- M. Hartmann, A. Vinu and G. Chandrasekar, Chem. Mater., 2005, 17, 829 CrossRef CAS.
- M. Hartmann, Chem. Mater., 2005, 17, 4577 CrossRef CAS.
- C. Z. Yu, J. Fan, B. Z. Tian and D. Y. Zhao, Chem. Mater., 2004, 16, 889 CrossRef CAS.
- A. Vinu, V. Murugesan, O. Tangermann and M. Hartmann, Chem. Mater., 2004, 16, 3056 CrossRef CAS.
- A. Sayari and S. Hamoudi, Chem. Mater., 2001, 13, 3151 CrossRef CAS.
- Z. X. Wu, Y. Meng and D. Y. Zhao, Microporous Mesoporous Mater., 2010, 128, 1 CrossRef CAS.
- K. Nakajima, T. Fukui, H. Kato, M. Kitano, J. N. Kondo, S. Hayashi and M. Hara, Chem. Mater., 2010, 22, 3332 CrossRef CAS.
- H. A. Meng, M. Liong, T. A. Xia, Z. X. Li, Z. X. Ji, J. I. Zink and A. E. Nel, ACS Nano, 2010, 4, 4539 CrossRef CAS.
- R. M. Martin-Aranda and J. Cejka, Top. Catal., 2010, 53, 141 CrossRef CAS.
- N. Hao, Y. X. Yang, H. T. Wang, P. A. Webley and D. Y. Zhao, J. Colloid Interface Sci., 2010, 346, 429 CrossRef CAS.
- F. Chen, X. J. Meng and F. S. Xiao, Catal. Surv. Asia, 2011, 15, 37 CrossRef CAS.
- J. Cejka and S. Mintova, Catal. Rev. Sci. Eng., 2007, 49, 457 CAS.
- L. H. Chen, G. S. Zhu, D. L. Zhang, H. Zhao, M. Y. Guo, S. B. Wei and S. L. Qiu, J. Mater. Chem., 2009, 19, 2013 RSC.
- Y. Chen, H. R. Chen, M. Ma, F. Chen, L. M. Guo, L. X. Zhang and J. L. Shi, J. Mater. Chem., 2011, 21, 5290 RSC.
- T. L. Chew, A. L. Ahmad and S. Bhatia, Adv. Colloid Interface Sci., 2010, 153, 43 CrossRef CAS.
- N. Ehlert, M. Badar, A. Christel, S. J. Lohmeier, T. Luessenhop, M. Stieve, T. Lenarz, P. P. Mueller and P. Behrens, J. Mater. Chem., 2011, 21, 752 RSC.
- Q. Gao, W. J. Xu, Y. Xu, D. Wu, Y. H. Sun, F. Deng and W. L. Shen, J. Phys. Chem. B, 2008, 112, 2261–2267 CrossRef CAS.
- Q. J. He and J. L. Shi, J. Mater. Chem., 2011, 21, 5845 RSC.
- T. Heikkila, J. Salonen, J. Tuura, M. S. Hamdy, G. Mul, N. Kumar, T. Salmi, D. Y. Murzin, L. Laitinen, A. M. Kaukonen, J. Hirvonen and V. P. Lehto, Int. J. Pharm., 2007, 331, 133 CrossRef CAS.
- T. Heikkila, J. Salonen, J. Tuura, N. Kumar, T. Salmi, D. Y. Murzin, M. S. Hamdy, G. Mul, L. Laitinen, A. M. Kaukonen, J. Hirvonen and V. P. Lehto, Drug Delivery, 2007, 14, 337 CrossRef CAS.
- G. M. Liu, S. R. Zheng, D. Q. Yin, Z. Y. Xu, J. Fan and F. Jiang, J. Colloid Interface Sci., 2006, 302, 47 CrossRef CAS.
- B. V. Lotsch and G. A. Ozin, ACS Nano, 2008, 2, 2065 CrossRef CAS.
- M. M. Mekawy, A. Yamaguchi, S. A. El-Safty, T. Itoh and N. Teramae, J. Colloid Interface Sci., 2011, 355, 348 CrossRef CAS.
- H. A. Meng, M. Liong, T. A. Xia, Z. X. Li, Z. X. Ji, J. I. Zink and A. E. Nel, ACS Nano, 2010, 4, 4539 CrossRef CAS.
- G. J. Parker, M. D. B. Charlton, M. E. Zoorob, J. J. Baumberg, M. C. Netti and T. Lee, Philos. Trans. R. Soc. London, Ser. A, 2006, 364, 189 CrossRef CAS.
- L. Peng, A. Philippaerts, X. X. Ke, J. Van Noyen, F. De Clippel, G. Van Tendeloo, P. A. Jacobs and B. F. Sels, Catal. Today, 2010, 150, 140 CrossRef CAS.
- J. Salonen, A. M. Kaukonen, J. Hirvonen and V. P. Lehto, J. Pharm. Sci., 2008, 97, 632 CrossRef CAS.
- S. Shylesh, P. P. Samuel, S. Sisodiya and A. P. Singh, Catal. Surv. Asia, 2008, 12, 266 CrossRef CAS.
- A. Vinu, K. Z. Hossian, P. Srinivasu, M. Miyahara, S. Anandan, N. Gokulakrishnan, T. Mori, K. Ariga and V. V. Balasubramanian, J. Mater. Chem., 2007, 17, 1819 RSC.
- A. Vinu, M. Miyahara and K. Ariga, J. Nanosci. Nanotechnol., 2006, 6, 1510 CrossRef CAS.
- A. Vinu, M. Miyahara, V. Sivamurugan, T. Mori and K. Ariga, J. Mater. Chem., 2005, 15, 5122 RSC.
- W. Xia, J. Chang, J. P. Lin and J. Q. Zhu, Eur. J. Pharm. Biopharm., 2008, 69, 546 CrossRef CAS.
- X. C. Xu, C. S. Song, J. M. Andresen, B. G. Miller and A. W. Scaroni, Microporous Mesoporous Mater., 2003, 62, 29 CrossRef CAS.
- Q. H. Yang, J. Liu, L. Zhang and C. Li, J. Mater. Chem., 2009, 19, 1945 RSC.
- X. Yuan, W. Xing, S. P. Zhuo, W. J. Si, X. L. Gao, Z. H. Han and Z. F. Yan, J. Colloid Interface Sci., 2008, 322, 558 CrossRef CAS.
- Z. Y. Yuan and B. L. Su, J. Mater. Chem., 2006, 16, 663 RSC.
- M. Zhang, Y. P. Wu, X. Z. Feng, X. W. He, L. X. Chen and Y. K. Zhang, J. Mater. Chem., 2010, 20, 5835 RSC.
- Y. X. Zhang, S. C. Xu, Y. Y. Luo, S. S. Pan, H. L. Ding and G. H. Li, J. Mater. Chem., 2011, 21, 3664 RSC.
- W. R. Zhao, M. D. Lang, Y. S. Li, L. Li and J. L. Shi, J. Mater. Chem., 2009, 19, 2778 RSC.
- C. L. Zhu, X. Y. Song, W. H. Zhou, H. H. Yang, Y. H. Wen and X. R. Wang, J. Mater. Chem., 2009, 19, 7765 RSC.
- J. S. Beck, J. C. Vartuli, W. J. Roth, M. E. Leonowicz, C. T. Kresge, K. D. Schmitt, C. T. W. Chu, D. H. Olson, E. W. Sheppard, S. B. McCullen, J. B. Higgins and J. L. Schlenker, J. Am. Chem. Soc., 1992, 114, 10834 CrossRef CAS.
- C. T. Kresge, M. E. Leonowicz, W. J. Roth, J. C. Vartuli and J. S. Beck, Nature, 1992, 359, 710 CrossRef CAS.
- A. Corma, Chem. Rev., 1997, 97, 2373 CrossRef CAS.
- Q. S. Huo, D. I. Margolese and G. D. Stucky, Chem. Mater., 1996, 8, 1147 CrossRef CAS.
- J. C. Vartuli, K. D. Schmitt, C. T. Kresge, W. J. Roth, M. E. Leonowicz, S. B. McCullen, S. D. Hellring, J. S. Beck, J. L. Schlenker, D. H. Olson and E. W. Sheppard, Chem. Mater., 1994, 6, 2317 CrossRef CAS.
- H. Yang, N. Coombs and G. A. Ozin, Nature, 1997, 386, 692 CrossRef CAS.
- J. M. Seddon and M. E. Raimondi, Mol. Cryst. Liq. Cryst., 2000, 347, 465.
- C. Z. Yu, J. Fan, B. Z. Tian and D. Y. Zhao, Chem. Mater., 2004, 16, 889 CrossRef CAS.
- C. J. Brinker, Y. F. Lu, A. Sellinger and H. Y. Fan, Adv . Mater., 1999, 11.
- Y. Deng, C. Liu, D. Gu, T. Yu, B. Tu and D. Y. Zhao, J. Mater. Chem., 2008, 18, 91 RSC.
- Y. H. Deng, T. Yu, Y. Wan, Y. F. Shi, Y. Meng, D. Gu, L. J. Zhang, Y. Huang, C. Liu, X. J. Wu and D. Y. Zhao, J. Am. Chem. Soc., 2007, 129, 1690 CrossRef CAS.
- D. Grosso, C. Boissiere, B. Smarsly, T. Brezesinski, N. Pinna, P. A. Albouy, H. Amenitsch, M. Antonietti and C. Sanchez, Nat. Mater., 2004, 3, 787 CrossRef CAS.
- Y. Huang, J. P. Yang, H. Q. Cai, Y. P. Zhai, D. Feng, Y. H. Deng, B. Tu and D. Y. Zhao, J. Mater. Chem., 2009, 19, 6536 RSC.
- Y. Meng, D. Gu, F. Q. Zhang, Y. F. Shi, L. Cheng, D. Feng, Z. X. Wu, Z. X. Chen, Y. Wan, A. Stein and D. Y. Zhao, Chem. Mater., 2006, 18, 4447 CrossRef CAS.
- S. Valkama, A. Nykanen, H. Kosonen, R. Ramani, F. Tuomisto, P. Engelhardt, G. ten Brinke, O. Ikkala and J. Ruokolainen, Adv. Funct. Mater., 2007, 17, 183 CrossRef CAS.
- Y. Wan, Y. F. Shi and D. Y. Zhao, Chem. Commun., 2007, 897 RSC.
- K. Yu, A. J. Hurd, A. Eisenberg and C. J. Brinker, Langmuir, 2001, 17, 7961 CrossRef CAS.
- K. Kailasam, Y. S. Jun, P. Katekomol, J. D. Epping, W. H. Hong and A. Thomas, Chem. Mater., 2010, 22, 428 CrossRef CAS.
- J. Y. Zhang, Y. H. Deng, J. Wei, Z. K. Sun, D. Gu, H. Bongard, C. Liu, H. H. Wu, B. Tu, F. Schuth and D. Y. Zhao, Chem. Mater., 2009, 21, 3996 CrossRef CAS.
- R. L. Liu, Y. F. Shi, Y. Wan, Y. Meng, F. Q. Zhang, D. Gu, Z. X. Chen, B. Tu and D. Y. Zhao, J. Am. Chem. Soc., 2006, 128, 11652 CrossRef CAS.
- C. Liu, Y. H. Deng, J. Liu, H. H. Wu and D. Y. Zhao, Microporous Mesoporous Mater., 2008, 116, 633 CrossRef CAS.
- J. Rodriguez-Hernandez, F. Checot, Y. Gnanou and S. Lecommandoux, Prog. Polym. Sci., 2005, 30, 691 CrossRef CAS.
- I. U. Hamley, The Physics of Block Copolymers; Oxford University Press: Oxford, UK , 1998 Search PubMed.
- S. Foerster and M. Antonietti, Adv. Mater., 1998, 10, 195 CrossRef.
- N. Hadjichristidis, S. Pispas and G. A. Floudas, Block Copolymers Synthetic Strategies, Physical Properties, and Applications; John Wiley& Sons: Hoboken, 2003 Search PubMed.
- W. C. Chen, S. W. Kuo, U. S. Jeng and F. C. Chang, Macromolecules, 2008, 41, 1401 CrossRef CAS.
- W. C. Chen, S. W. Kuo, C. H. Lu, U. S. Jeng and F. C. Chang, Macromolecules, 2009, 42, 3580 CrossRef CAS.
- N. Hameed and Q. P. Guo, Polymer, 2008, 49, 922 CrossRef CAS.
- N. Hameed, N. V. Salim and Q. P. Guo, J. Chem. Phys., 2009, 131, 214905 CrossRef.
- I. H. Lin, S. W. Kuo and F. C. Chang, Polymer, 2009, 50, 5276 CrossRef CAS.
- N. V. Salim, T. Hanley and Q. P. Guo, Macromolecules, 2010, 43, 7695 CrossRef CAS.
- D. Y. Zhao, J. L. Feng, Q. S. Huo, N. Melosh, G. H. Fredrickson, B. F. Chmelka and G. D. Stucky, Science, 1998, 279, 548 CrossRef CAS.
- D. Y. Zhao, Q. S. Huo, J. L. Feng, B. F. Chmelka and G. D. Stucky, J. Am. Chem. Soc., 1998, 120, 6024 CrossRef CAS.
- X. Y. Bao, X. S. Zhao, X. Li, P. A. Chia and J. Li, J. Phys. Chem. B, 2004, 108, 4684 CrossRef CAS.
- L. Cao and M. Kruk, Colloids Surf., A, 2010, 357, 91 CrossRef CAS.
- J. P. Hanrahan, A. Donovan, M. A. Morris and J. D. Holmes, J. Mater. Chem., 2007, 17, 3881 RSC.
- S. S. Kim, A. Karkamkar, T. J. Pinnavaia, M. Kruk and M. Jaroniec, J. Phys. Chem. B, 2001, 105, 7663 CrossRef CAS.
- T. W. Kim, F. Kleitz, B. Paul and R. Ryoo, J. Am. Chem. Soc., 2005, 127, 7601 CrossRef CAS.
- B. Z. Tian, X. Y. Liu, Z. D. Zhang, B. Tu and D. Y. Zhao, J. Solid State Chem, 2002, 167, 324 CAS.
- D. H. Chen, Z. W. Li, Y. X. J. Tu, Y. F. Shi, Z. X. Chen, W. Shen, C. Z. Yu, B. Tu and D. Y. Zhao, J. Mater. Chem., 2006, 16, 1511 RSC.
- J. Lee, J. Kim, Y. Lee, S. Yoon, S. M. Oh and T. Hyeon, Chem. Mater., 2004, 16, 3323 CrossRef CAS.
- Z. Y. Wang and A. Stein, Chem. Mater., 2008, 20, 1029 CrossRef CAS.
- F. Q. Zhang, Y. Meng, D. Gu, Y. Yan, Z. X. Chen, B. Tu and D. Y. Zhao, Chem. Mater., 2006, 18, 5279 CrossRef CAS.
- J. Tang, Y. B. Fan, J. Hu and H. L. Liu, J. Colloid Interface Sci., 2009, 331, 191 CrossRef CAS.
- L. Y. Song, D. Feng, C. G. Campbell, D. Gu, A. M. Forster, K. G. Yager, N. Fredin, H. J. Lee, R. L. Jones, D. Y. Zhao and B. D. Vogt, J. Mater. Chem., 2010, 20, 1691 RSC.
- C. Urata, Y. Tamura, Y. Yamauchi and K. Kuroda, J. Mater. Chem., 2011, 21, 3711 RSC.
- G. W. Zhou, Y. J. Chen, J. H. Yang and S. H. Yang, J. Mater. Chem., 2007, 17, 2839 RSC.
- H. P. Lin, C. Y. Chang-Chien, C. Y. Tang and C. Y. Lin, Microporous Mesoporous Mater., 2006, 93, 344 CrossRef CAS.
- M. H. Sorensen, R. W. Corkery, J. S. Pedersen, J. Rosenholm and P. C. Alberius, Microporous Mesoporous Mater., 2008, 113, 1 CrossRef.
- L. M. Wang, B. Z. Tian, J. Fan, X. Y. Liu, H. F. Yang, C. Z. Yu, B. Tu and D. Y. Zhao, Microporous Mesoporous Mater., 2004, 67, 123 CrossRef CAS.
- J. F. Yao, H. T. Wang, K. Y. Chan, L. X. Zhang and N. P. Xu, Microporous Mesoporous Mater., 2005, 82, 183 CrossRef CAS.
- F. Q. Zhang, Y. Yan, Y. Meng, Y. Xia, B. Tu and D. Y. Zhao, Microporous Mesoporous Mater., 2007, 98, 6 CrossRef CAS.
- A. Soininen, S. Valkama, A. Nykanen, A. Laiho, H. Kosonen and R. Mezzenga, Chem. Mater., 2007, 19, 3093 CrossRef CAS.
- Y. Wan, Y. F. Shi and D. Y. Zhao, Chem. Mater., 2008, 20, 932 CrossRef CAS.
- Y. Meng, D. Gu, F. Q. Zhang, Y. F. Shi, H. F. Yang, Z. Li, C. Z. Yu, B. Tu and D. Y. Zhao, Angew. Chem., Int. Ed., 2005, 44, 7053 CrossRef CAS.
- J. Jin, N. Nishiyama, Y. Egashira and K. Ueyama, Microporous Mesoporous Mater., 2009, 118, 218 CrossRef CAS.
- X. F. Qian, H. X. Li and Y. Wan, Microporous Mesoporous Mater., 2011, 141, 26 CrossRef CAS.
- B. D. Vogt, V. L. Chavez, M. Z. Dai, M. R. C. Arreola, L. Y. Song, D. Feng, D. Y. Zhao, G. M. Perera and G. E. Stein, Langmuir, 2011, 27, 5607 CrossRef CAS.
- C. F. Xue, B. Tu and D. Y. Zhao, Nano Res., 2009, 2, 242 CrossRef CAS.
- F. Q. Zhang, D. Gu, T. Yu, F. Zhang, S. H. Xie, L. J. Zhang, Y. H. Deng, Y. Wan, B. Tu and D. Y. Zhao, J. Am. Chem. Soc., 2007, 129, 7746 CrossRef CAS.
- F. Kleitz, S. H. Choi and R. Ryoo, Chem. Commun., 2003, 2136 RSC.
- H. F. Yang and D. Y. Zhao, J. Mater. Chem, 2005, 15, 1217 RSC.
- K. P. Gierszal, T. W. Kim, R. Ryoo and M. Jaroniec, J. Phys. Chem. B, 2005, 109, 23263 CrossRef CAS.
- R. Ryoo, S. H. Joo, M. Kruk and M. Jaroniec, Adv. Mater., 2001, 13, 677 CrossRef CAS.
- H. F. Lee, S. W. Kuo, C. F. Huang, J. S. Lu, S. C. Chan, C. F. Wang and F. C. Chang, Macromolecules, 2006, 39, 5458 CrossRef CAS.
- S. C. Chen, S. W. Kuo, U. S. Jeng and F. C. Chang, Macromolecules, 2010, 43, 1083 CrossRef CAS.
- C. H. Lu, S. W. Kuo and F. C. Chang, Macromol. Rapid Commun., 2009, 30, 2121 CrossRef CAS.
- W. C. Chen, S. W. Kuo and F. C. Chang, Polymer, 2010, 51, 4176 CrossRef CAS.
- S. W. Kuo, C. L. Lin and F. C. Chang, Macromolecules, 2002, 35, 278 CrossRef CAS.
- H. L. Chen, S. C. Hsiao, T. L. Lin, K. Yamauchi, H. Hasegawa and T. Hashimoto, Macromolecules, 2001, 34, 671 CrossRef CAS.
- H. C. Lin, S. W. Kuo, C. F. Huang and F. C. Chang, Macromol. Rapid Commun., 2006, 27, 537 CrossRef CAS.
- M. W. Huang, S. W. Kuo, H. D. Wu, F. C. Chang and S. Y. Fang, Polymer, 2002, 43, 2479 CrossRef CAS.
- S. W. Kuo, S. C. Chan, H. D. Wu and F. C. Chang, Macromolecules, 2005, 38, 4729 CrossRef CAS.
- C. F. Huang, S. W. Kuo, F. J. Lin, W. J. Huang, C. F. Wang, W. Y. Chen and F. C. Chang, Macromolecules, 2006, 39, 300 CrossRef CAS.
- C. Y. Chiu, W. H. Hsu, Y. J. Yen, S. W. Kuo and F. C. Chang, Macromolecules, 2005, 38, 6640 CrossRef CAS.
- H. L. Chen, J. C. Wu, T. L. Lin and J. S. Lin, Macromolecules, 2001, 34, 6936 CrossRef CAS.
- Y. L. Loo, R. A. Register, A. J. Ryan and G. T. Dee, Macromolecules, 2001, 34, 8968 CrossRef CAS.
- H. L. Chen, S. Y. Lin, Y. Y. Huang, F. C. Chiu, W. Liou and J. S. Lin, Macromolecules, 2002, 35, 9434 CrossRef CAS.
- J. T. Xu, S. C. Turners, J. P. A. Fairclough, S. M. Mai, A. J. Ryan, C. Chaibundit and C. Booth, Macromolecules, 2002, 35, 3614 CrossRef CAS.
- J. Y. Hsu, I. F. Hsieh, B. Nandan, F. C. Chiu, J. H. Chen, U. S. Jeng and H. L. Chen, Macromolecules, 2007, 40, 5014 CrossRef CAS.
- S. W. Kuo and F. C. Chang, Macromol. Chem. Phys., 2001, 202, 3112 CrossRef CAS.
- S. W. Kuo, S. C. Chan and F. C. Chang, J. Polym. Sci., Part B: Polym. Phys., 2004, 42, 117 CrossRef CAS.
- M. M. Coleman, J. F. Graf and P. C. Painter, Specific Interactions and the Miscibility of Polymer Blends; Technomic Publishing, Lancaster, PA, 1991 Search PubMed.
- M. M. Coleman and P. C. Painter, Miscible Polymer Blend-Background and Guide for Calculations and Design; DEStech Publications, Inc, 2006 Search PubMed.
Footnote |
| † Electronic Supplementary Information (ESI) available. See DOI: 10.1039/c1ra00349f/ |
| This journal is © The Royal Society of Chemistry 2011 |
