Ultrafast infrared chemical imaging of live cells
Hemmel
Amrania
a,
Andrew P.
McCrow
a,
Mary R.
Matthews
a,
Sergei G.
Kazarian
b,
Marina K.
Kuimova
c and
Chris C.
Phillips
*a
aPhysics Department, Imperial College London, Prince Consort Road, London, SW7 2AZ, UK. E-mail: chris.phillips@imperial.ac.uk
bChemical Engineering and Chemical Technology Department, Imperial College London, Exhibition Road, London, SW7 2AZ, UK
cChemistry Department, Imperial College London, Exhibition Road, SW7 2AZ, UK
First published on 1st October 2010
Abstract
Mid-infrared (mid-IR) spectroscopy provides a unique chemical fingerprint of biomaterials, including DNA and proteins, from single molecules to highly organised structures and, ultimately, to live cells and tissues. However, acquiring good signal–to–noise mid-IR spectroscopic images, at the cellular level, typically involves a synchrotron, with imaging times of order of minutes. Here we use a new laser-based table-top IR spectroscopic micro-imaging system, to obtain vibrational fingerprint signatures of living human ovarian cancer cells at a diffraction limited spatial resolution, and at a spectral resolution (< 20 cm−1) sufficient to map out the spatial distributions of chemical moieties inside the cell itself. The bright laser pulses give very high signal–to–noise images, and ∼100 psec image acquisition times that are roughly 1011 times faster than current mid-IR spectroscopic imaging techniques. The imaging method is quantitative, non-phototoxic, marker-free and easily fast enough to “freeze” moving, living specimens. It can be applied to a range of cell-level biochemical processes, and we believe it could impact on the fields of drug action, cell physiology, pathology and disease as a whole.
Introduction
Mid-infrared (IR) radiation (wavelength λ∼3μm–20μm) is resonantly absorbed by tightly localised vibrational excitations in chemical bonds, and IR spectroscopic databases have been generated from which complex molecular mixes can be analysed on the basis of their characteristic spectral absorption “fingerprints”.1 By confining the absorption measurement to small sample areas (so-called microspectroscopy) the time evolution of chemical differences can be ascertained down to the level of a single cell.2,3 If the analysed area is rastered across a 2-dimensional sample a “Spectroscopic Image” (SI) can be generated. These SI's contain a wealth of scientific information and have found wide application, for example, in the fields of oncology, drug discovery, forensic science, proteomics, polymers and homeland security.1Photon energies in the IR are too low to have a photochemical effect and the photon fluxes are also low, so the technique gives no phototoxicity problems with biological specimens. It is also marker-free, so it allows a wide range of time–course studies to be undertaken with living systems. However, in spite of rapid technical advances in the past decade, acquiring an SI dataset of useful spatial resolution and signal–to–noise ratio (SNR) is an inconveniently slow process and this continues to severely restrict its scientific impact.
Commercially available SI systems consist of a Fourier-transform infrared (FTIR) spectrometer, equipped with a broadband thermal black-body Globar light source and some form of apertured optical system, typically a reflecting IR microscope. A flat sample is placed in the interferometer's output beam and point-wise IR absorption spectra are co-added as the sample is mechanically translated in two dimensions. However, the limited specific brightness available from Globars means that only apertures corresponding to sample areas larger than 20–30 μm diameter are feasible in practice, although in specialised circumstances “Attenuated Total Reflection” (ATR)4 coupling schemes, and image enhancing algorithms5 can be used to significantly improve on this spatial resolution. Even when these systems are equipped with modern cooled multichannel IR detection schemes, the time needed to acquire an image with a useful SNR ranges from minutes to hours.5,6
An alternative is to harness the intense IR radiation (specific brightnesses up to 100 times higher3 than Globars) available from synchrotrons. This approach has produced very impressive, cell-level spectroscopic images, with spatial resolutions all the way down to a diffraction limit of ∼5 μm.7
Raman imaging 1,5,8,9 can also be used to access molecular vibrational information. It benefits from using light sources and detectors that operate in the much more technologically mature visible/near IR spectral region, and the shorter wavelengths give correspondingly improved diffraction limits to the spatial resolution and improved access to aqueous samples. However the low (∼10−6) Raman efficiency demands high illumination levels (typically 10's of mW focussed into a fraction of a cubic micron9). This leads to significant phototoxicity issues,9 and the tendency, shared with the scanning synchrotron technique, of single cells to migrate out of the illuminated regions. Both methods need long (> minutes) acquisition times making the imaging of living, moving, samples a substantial challenge.1
In this paper, we show that a new lab-based technology, that uses a pulsed tuneable “Optical Parametric Generator” (OPG) source of IR, can give marker-free chemical images with spatial resolutions down to the diffraction limit and with sub-nanosecond temporal resolution. We image intact, living cells, without the use of stains and fixatives. We show that functional chemical groups can be mapped at the sub-cellular level and that, although the identification of such functional groups has its technical challenges at present, this technique offers a future route towards important new insights into chemical processes and modifications within individual cells.
Results
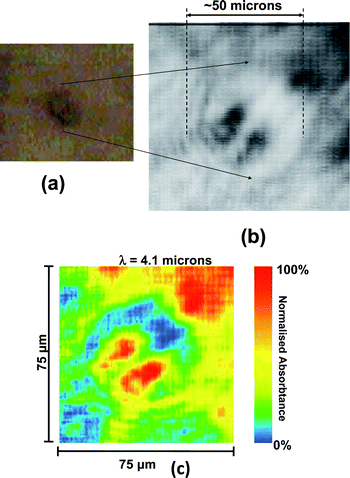
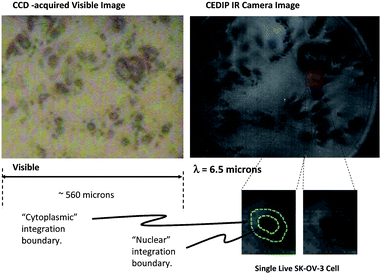
Initial images were taken at λ ∼ 4.1μm, corresponding to a peak (∼28%), in the IR transmission spectrum of the polystyrene Petri dish (Nunc Lab-Tek), and a series of single-shot images of live cells attached to the surface of a BaF2 window in the Petri dish were captured (Fig. 1). This wavelength gave clear contrast between the nucleus and the cytoplasm of individual cells (Fig. 2) and also allowed us to capture individual cells undergoing mitosis (Fig. 1). The camera gating time was 1 microsecond, but all the information in images in Fig. 1 and 2 was recorded during the OPG pulse width of 100 picoseconds, i.e. approximately 12 decades faster than typical present day vibrational spectroscopy imaging methods. | ||
| Fig. 1 Mid-IR image of a single live SK-OV-3 human ovarian cancer cell undergoing mitosis , in H 2 O based phosphate buffer solution . (a) Visible image taken with a CCD camera attached to the microscope and (b) imaged in transmission, at λ ∼ 4.1 μm with the OPG infrared source and mid-IR camera. (c) False colour rendition of image (b). The dividing nuclei of the cell are clearly resolved in the IR image, which was acquired in 100 psec at a pixel resolution of 1.9 μm × 1.9μm. | ||
 | ||
| Fig. 2 Images of cell cultures. Right, transmission mode image of living SK-OV-3 ovarian cancer cell culture (in D2O), acquired with the OPG wavelength tuned to λ ∼ 6.5 μm. Left, simultaneously acquired visible image. Inset, an example of how the sharpest focus cell images are visually selected for the cell-level spectroscopy analysis. The spatially-integrated signal regions corresponding to the cell nucleus and the cytoplasm are delineated by borders which are drawn by eye from the two images. | ||
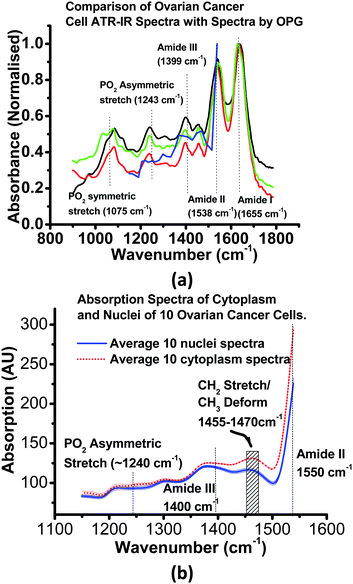
Fig. 3a compares the live cell-specific spectral information generated by the OPG-based imaging system with spectra of dried samples of the same SK-OV-3 cells taken in an instrument with an ATR geometry,4 with a conventional FTIR spectrometer equipped with a diamond ATR accessory (Imaging Golden GateTM, Specac Ltd). Qualitatively the two data sets agree to well within the experimental uncertainties, and the OPG laser data, although presently at a lower spectral resolution, display all the features present in the FTIR-ATR spectra of the dried cells. However, in the case of the dried samples, making a quantitative comparison is complicated by unknown variations in the average cell concentrations, and by the complexity of the optical physics of how the IR couples into the cells4 in the ATR geometry. This means the two data sets can only be compared by employing a normalising process at some arbitrary point in the spectrum.
 | ||
| Fig. 3 Cell Level Absorption Spectra . Fig 3a: blue line:- Infrared absorbance spectra of viable SK-OV-3 ovarian cancer cells (i.e. cytoplasmic and nuclear components averaged), in D2O, as obtained with the OPG imager. Red, green, black lines, Fourier transform IR spectra recorded from 3 different specimens of the same SK-OV-3 cells, dried and examined in an attenuated total-reflection (ATR) geometry with a FTIR spectrometer. Fig 3b: absorption spectra (heavy lines) with 1σ error margins (light lines) averaged for the nuclear (blue, solid) and cytoplasmic (red, dotted) components of 10 cells, in D2O, as described in Fig. 2. Each cell was imaged at wavelength increments of 0.05 μm steps in wavelength. The spectra from the two cellular components can be seen to diverge significantly in the spectral region > 1350 cm−1. | ||
Fig. 3b. summarises the cell-level spectroscopic information extracted from the OPG-based spectroscopic images. While both nuclear and cytoplasmic spectra contain a similar set of IR features, the quantitative nature of the transmissive mode measurement allows us to compare the spectra directly, and no scaling procedures are needed. This reveals highly statistically significant differences, particularly in the 1350–1600 cm−1 spectral region, where cytoplasm absorption is much stronger than that in the cell nucleus (Fig. 3b).
Discussion
Using accepted literature data1 we assign the band at 1540 cm−1 to the Amide II band, characteristic of bond vibrations in proteins. The weaker features at ∼1455 cm−1 and ∼1470 cm−1 can be assigned to CH2 symmetric stretch and various CH2/CH3 deformation modes, respectively; both also are expected to be found in proteins. These microspectroscopy data therefore allow us to distinguish, for the first time at an intra-cellular level in living cells, between the cell cytoplasm and the nucleus based on the higher concentration of proteins in the former.We see only small spectral differences in the 1240 cm−1 spectral region, characteristic of the phosphate asymmetric stretching vibration. An increase in absorption by the phosphate moiety might initially be expected in the nucleus, correlating with the elevated concentration of PO2−groups in the backbone of DNA. However, the amide III band (expected between 1240 and 1340 cm−1) could also be contributing to absorption in this region, as well as significant absorption at ∼1200 cm−1 by the D2O solvent. Thus the present spectral resolution is not quite sufficient to allow us to distinguish between these two bands at the sub-cellular level.
It appears that the higher concentration of protein in the cytoplasm gives a net absorbance in the region of ∼1240 cm−1 that is as high as in the nucleus, where the effects of a much lower concentration of protein are offset by the high DNA concentration. Future systems may circumvent this ambiguity, by changing the cut of the frequency mixing crystals in the OPG to extend the idler tuning range (currently spanning 1160–1550 cm−1) to probe the ∼1080 cm−1PO2− symmetric stretch vibration, where spectral crosstalk is negligible. Employing alternative OPG crystals, such as Cadmium Selenide (CdSe, idler tuning range: λ = 8.6–11.8 μm or 1160–850 cm−1) could also achieve this. Similarly, it may turn out to be preferable to image at the Amide I absorption peak (∼1650 cm−1) or even completely resolve the Amide II absorption peak (at ∼1550 cm−1).
We have demonstrated that IR microspectroscopy, using a high power OPG laser source, makes it possible to acquire in vitroIR spectral images at the sub-cellular level. It achieves this in a way that dramatically exceeds the capabilities of present day techniques and, ultimately, offers the prospect of a powerful turn-key lab instrument for exploitation in a wide range of chemical, biomedical and clinical research environments.
Experimental
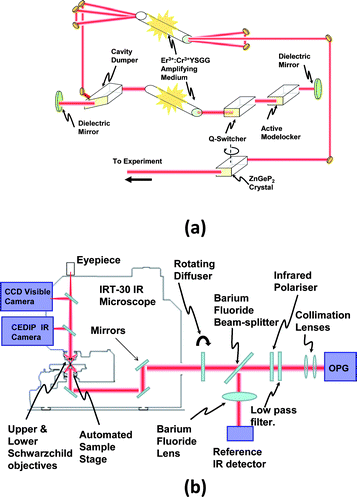
The SI system (Fig. 4) consists of a commercial all-reflecting IR microscope (JASCO IRT-30), which we have modified by adding a high spatial resolution, wide spectral response IR camera (CEDIP JADE). This has been coupled into a home-built Optical Parametric Generator (OPG) infrared laser source, as described in technical detail elsewhere.10 The high peak power (105W maximum, ∼ 103 W at the sample) allows good SNR images to be recorded with unprecedented short image acquisition times, while the short pulse duration (∼100psec) keeps the overall illumination fluence well below any phototoxicity limits, and allows moving specimens to be “frozen” in a way that mimics conventional flash photography. Acquiring the whole image simultaneously bypasses cell motility problems, and sequential images, taken only at wavelengths which have been previously identified as being most useful for chemical “fingerprinting”, can be used to acquire SI datasets with maximum efficiency and minimal sample exposure to the illuminating radiation. | ||
| Fig. 4 Schematic of the Optical setup. Fig 4a: the OPG IR radiation source comprises a short-pulsed λ = 2.78 μm laser, constructed around an Er3+:Cr3+ (YSGG) rod. The intracavity Q-switching, modelocking and cavity dumping components shape the laser output into a single ∼100 psec long pulse. After being amplified in a second Er3+:Cr3+ (YSGG) rod, this pulse is intense enough (∼3 mJ energy) to drive an efficient optical parametric generation (OPG) process in an angle tuned crystal of ZnGeP2. Fig. 4b: the OPG beam was first collimated with infrared lenses, and a fraction split off, with a BaF2 beam splitter, to a pyroelectric reference detector. Coherent speckle effects were eliminated by using a rotating diffuser placed at the entrance port to the microscope, and a rotating polariser was used to switch between the signal (λ = 4.0–4.95 μm) and idler (λ = 6.4–8.6 μm) pulses generated by the OPG. A low-pass filter (a polished slice of Indium Arsenide semiconductor) was used to block the residual λ = 2.78 μm laser light. | ||
The OPG is a pulsed laser source10 which is tuneable across the mid-IR spectral region, potentially spanning the wavelength range λ ∼ 3–20 μm. The IR is initially generated in a laser cavity consisting of a flashlamp-pumped Er3+:Cr3+ doped rod of Yttrium Scandium Gallium Garnet (YSGG). The resulting λ = 2.78 μm laser pulse is amplified to ∼10mJ and passed through a Zinc Germanium Phosphide (ZnGeP2) crystal, where it drives a second order optical parametric generation process. This generates idler and signal pulses which are orthogonally polarised, collinear, and with energies typically ∼ 1–10 μJ. Their photon energies sum to match that of the λ = 2.78 μm input but their individual wavelengths can be varied by angle-tuning of the ZnGeP2 crystal. The tuning range is determined by the angle of the cut of the facets on this crystal, and the full-width-half-maximum spectral linewidth of the output pulses varies in the range of ∼12–20 cm−1 as the centre wavelength is tuned.
The CEDIP IR camera has a cooled 320 × 240 element mercury–cadmium–telluride (MCT) photodiode Focal Plane Array (FPA) detector of overall dimension ∼ 7.2 mm × 9.6 mm. It was specially constructed, without the cooled IR filters which would normally be included to filter out thermal background radiation, and it had a spectral response spanning the λ ∼ 2–9.7 μm range. Images are recorded by using an LVDS (Low Voltage Differential Signalling) interface, which allows frame rates of up to 2000 frames per second (fps) at a 14-bit accuracy, corresponding to 16384 greyscale values per pixel. A background correction and Non-Uniformity Correction (NUC) procedure10 was developed to account for the pixel to pixel sensitivity, pixel linearity and illumination variations. The short OPG pulses allowed camera gating times to be used that are short enough to eliminate interference from thermal IR background signals.
The human ovarian carcinoma cell line, SK-OV-3, was obtained from the European Collection of Cell Cultures (ECACC). Cells were cultured in Dulbecco's modified Eagle's medium (DMEM) with 10% foetal calf serum, penicillin and streptomycin antibiotics. They were passaged, when 70–90% confluent, in 75 cm2 flasks grown at 37 °C in 5% CO2. For imaging experiments, SK-OV-3 cells were seeded, at 105cells/well, in 1 ml of culture medium into 24-well plates (VWR International Ltd.). They were allowed to grow to confluence on Barium Fluoride (BaF2) windows. These were immersed in each well for 24 h before being transferred to the imager, where they were ready for images to be taken within 5–10 min of having been taken from the culturing wells.
To obtain the images in Fig. 1, a BaF2 window (with live cell growth) was placed in a Petri dish and immersed to a depth of ∼0.5 mm in phosphate buffered saline (PBS) solution. It was placed in the microscope sample holder, [Fig. 4] which was adjusted to bring the largest possible number of cells to a focus under the ×16 magnification Schwarzschild-reflecting upper microscope objective. The sample was illuminated with a ∼500 μm diameter patch of OPG radiation and the imaged area corresponded to a 560 μm × 375 μm rectangle, with each detector pixel corresponding to a 1.9 μm × 1.9 μm square at the sample, i.e. roughly 1/4 of the diffraction-limited resolution. The all-reflecting nature of the microscope optics made it possible for us to add a dichroic beamsplitter to the microscope so the specimen could be simultaneously imaged in the IR, seen through the microscope objective, and imaged in the visible with a standard CCD camera.
For the spectroscopic imaging experiments (Fig. 2), a cell-laden BaF2 window was removed from the growing well and washed twice with a heavy water (D2O) saline solution. A drop of solution was placed over the cell layer to prevent the cells from drying out and a 0.5 mm thick BaF2 cover slip applied, leaving the live cells in a ∼100 μm thick D2O saline layer. Using D2O instead of H2O allowed useful measurements to be made in the 1250–1700 cm−1IR fingerprint region, (where H2O can obscure certain absorption features), and although D2O can affect spindle growth during mitosis in eukaryotic cells, previous trials11 have shown that D2O has no adverse effects on cell viability on the short timescales of our experiment.
The assembly was placed in the microscope sample holder. The cells were brought to focus under the microscope objective and successive images were recorded while the OPG wavelength was scanned across the range λ ∼ 6.4–8.6 μm in Δλ = 0.05 μm steps (Fig. 3). At each wavelength 200 images were co-added, each having been suitably background–subtracted and normalised against the OPG intensity reference channel (Fig. 4) to eliminate artefacts due both to pulse–to–pulse fluctuations in the OPG output, and to the variation in the mean OPG output as it was wavelength tuned. The data in Fig. 3 were generated using a Labview routine that allowed regions of the image corresponding to the cytoplasmic and nuclear regions of the cells in the sharpest focus to be manually delineated (Fig. 2) and then averaging their pixel values to give IR absorption spectra characteristic of the specific cell regions.
Acknowledgements
Financial support from the UK Engineering and Physical Sciences Research Council is gratefully acknowledged. MKK is thankful to the EPSRC Life Sciences Interface Programme for a personal fellowship, EP/E038980/1.Notes and references
- R. Salzer and H. W. Siesler ed. ( 2009) “Infrared and Raman Spectroscopic imaging” Wiley-VCH, Weinheim ISBN 978-3-527-31993-0 Search PubMed.
- D. A. Moss, M. Keese and R. Pepperkok, IR microspectroscopy of live cells, Vib. Spectrosc., 2009, 38, 185.
- P. Dumas, G. D. Sockalingum and J. Sule-Suso, Adding synchrotron radiation to infrared microspectroscopy; what's new in biomedical applications, Trends Biotechnol., 2007, 25(1), 40 CrossRef CAS.
- M. K. Kuimova, A. K. L. Chan and S. G. Kazarian, Chemical Imaging of Live Cancer Cells in the Natural Aqueous Environment, Appl. Spectrosc., 2009, 63, 164 CrossRef CAS.
- C. Matthaus, S. Boydston-White, M. Miljkovic, M. Romeo and M. Diem, Raman and Infrared Microspectral Imaging of Mitotic Cells, Appl. Spectrosc., 2006, 60(1), 1–8 CrossRef CAS.
- M. Diem, M. Romeo, S. Boydston-White, M. Miljkovic and C. Matthäus, A decade of vibrational microscopy of human cells and tissue, Analyst, 2004, 880 Search PubMed.
- J. Nadege, P. Dumas, J. Moncuit, W.-H. Fridman, J.-L. Teillaud, G. L. Carr and G. P. Williams, Highly resolved chemical imaging of living cells by using synchrotron infrared micro spectrometry, Proc. Natl. Acad. Sci. U. S. A., 1998, 95, 4837 CrossRef CAS.
- Y. S. Huang, T. Karashima, M. Yamamoto and H. Hamaguchi, Molecular Level Investigation of the Structure, Transformation and Bioactivity of Single Fission Yeast Cells by Time- and Space-Resolved Raman Spectroscopy, Biochemistry, 2005, 44, 10009 CrossRef.
- N. Uzunbajakava, A. Lenferink, Y. Kran, B. Willkens, G. Vrensen, J. Greve and C. Otto, Non-resonant Raman Imaging of Protein Distributions in Single Human Cells, Biopolymers, 2002, 72, 1.
- H. Amrania, A. McCrow and C. Phillips, A Benchtop Ultrafast Infrared Spectroscopic Imaging System for Biomedical applications, Rev. Sci. Instrum., 2009, 80, 123702 CrossRef.
- S. Hatz, J. D. C. Lambert and P. R. Ogilby, Measuring the Lifetime of Singlet Oxygen in a Single Cell: Addressing the Issue of Cell Viability, Photochem. Photobiol. Sci., 2007, 6, 1106–1116 RSC.
| This journal is © The Royal Society of Chemistry 2011 |
