Virtual cocrystal screening
Daniele
Musumeci
a,
Christopher A.
Hunter
*a,
Rafel
Prohens
b,
Serena
Scuderi
a and
James F.
McCabe
c
aDepartment of Chemistry, University of Sheffield, S3 7HF, UK. E-mail: C.Hunter@shef.ac.uk; Fax: +44 114 2229346; Tel: +44 114 2229476
bPlataforma de Polimorfisme i Calorimetria, Serveis Cientificotecnics, Universitat de Barcelona, Baldiri Reixac 10, 08028, Barcelona, Spain
cAstraZeneca, Silk Road Business Park, Macclesfield, Cheshire SK10 2NA, UK
First published on 18th February 2011
Abstract
Calculated gas phase molecular electrostatic potential surfaces have been used to identify sets of H-bond donor and H-bond acceptor sites that describe the possible intermolecular interaction sites on the surface of a molecule. The calculated H-bond parameters, αi and βj, were used to estimate interaction site pairing energies in the solid form of the compound through a hierarchical mapping of complementary donor and acceptor sites: the interaction energy for each contact is simply given by the product −αiβj. The approach assumes that all of the interactions that can be made in the solid are made and that the details of three-dimensional structure and crystal packing are of secondary importance. Comparison of the energy of two pure solids with cocrystals of various stoichiometries gives an energy difference, ΔE, which is a measure of the probability of forming a cocrystal. Tests on an experimental cocrystal screen from the literature and the recall of coformers for caffeine and for carbamazepine from a list of nearly 1,000 candidates have been used to validate the utility of the method. For systems that are experimentally found to form cocrystals, the calculated energy parameter ΔE tends to be very favourable. In the best case, for 846 potential caffeine coformers from the EAFUS list, 80% of the experimentally observed hits are in the top 11% of the ranked list of ΔE values. The results provide a calibration between the value of ΔE and the probability of cocrystal formation: when the cocrystal is favored by more than 11 kJ mol−1 over the two pure solids, the probability of obtaining a cocrystal is better than 50%. An advantage of this approach is that it is sufficiently fast to be used as a high throughput virtual screening tool.
Introduction
Cocrystals of active pharmaceutical ingredients (API) represent a class of multi-component crystalline forms that are of interest for their advantageous physical properties1–5 and for intellectual property implications.6 Increasing interest in this topic has led to the development of high-throughput (HT) experiments to screen for cocrystals of APIs.7 The original screening methods that were based on solution growth8,9 are now accompanied by solvent-drop grinding,10,11 slurrying12 and use of experimentally determined phase diagrams.13 Cocrystal formation from a eutectic phase was investigated by Davey, and this is becoming increasingly important in the context of pharmaceutical materials with the development of eutectic-based thermal screening methodology.14–16 However, experimental cocrystal screens are time-consuming and expensive.The ability to predict a priori which compounds are likely to form cocrystals with a given API would provide a complementary tool to experimental screening.9,17,18 One approach is to analyse the structures of crystalline solids based on the pairing of H-bond donors and acceptors that form repeating H-bonded supramolecular motifs called synthons. There are two categories of supramolecular synthon: homosynthons that are formed by two identical functional groups and heterosynthons that are formed by different and complementary functional groups.19 Statistical studies of X-ray crystal structures in the Cambridge Structural Database (CSD) have identified commonly occurring H-bonding motifs, and these have been used to design cocrystals.9,19,20 Thakur et al. used a computational supramolecular synthon approach based on quantum mechanics and a CSD study to predict cocrystal structures.21 Galek et al. developed a knowledge-based method to assess crystal stability based on hydrogen bonding.22 Aakeröy et al. used pKa values to identify the best H-bond donors to design ternary cocrystals,23 but this approach seems to be less reliable than the use of H-bond acceptor/donor strength.17,24 We have shown that molecular electrostatic potential surfaces can be used to rank the relative H-bond donor/acceptor strengths of different functional groups,25 and this approach has been used to predict the formation of ternary cocrystals.17
The analysis of solution phase H-bonding interactions that we have developed allows estimation of the free energy of formation of a single point H-bond contact based on the calculated gas phase molecular electrostatic potential surfaces (MEPS) of the individual compounds. Maxima and minima on the MEPS are converted into H-bond donor and H-bond acceptor parameters, α and β respectively, and the free energy of interaction is given by the product −αβ.25 Thus we treat all classes of intermolecular interaction as a form of H-bond or electrostatic interaction, and assume that differences in van der Waals or dispersion interactions are small in solution. We have shown that this method accounts quantitatively for solvent effects on the formation of H-bonded complexes.26 In this paper, we apply this approach to the solid state in order to estimate the probability of cocrystal formation. The approach is crude and based on major approximations, but the advantage is that it is very fast and straightforward to implement, so it becomes viable to screen very large libraries of potential coformers.
Approach
Our cocrystal prediction method is based on the principle that the structure of a crystalline solid is determined by a hierarchical organisation of functional group interactions: the strongest H-bond is formed between the best H-bond donor and the best H-bond acceptor, the next best H-bond donor interacts with the next best H-bond acceptor, and so on, until all of the interaction sites are satisfied.27,28 Thus rather than focus on the maximum and minimum on the calculated gas phase MEPS, which describe the main site of interaction in formation of a 1![[thin space (1/6-em)]](https://www.rsc.org/images/entities/char_2009.gif) :
:![[thin space (1/6-em)]](https://www.rsc.org/images/entities/char_2009.gif) 1 complex in solution, analysis of interactions in the solid state requires consideration of all sites of interaction across the entire surface of the molecule. By collecting all local maxima and minima on the MEPS, we can define a set of H-bond interaction sites, αi and βj, that completely describe the interactions that the molecule makes with its environment.
1 complex in solution, analysis of interactions in the solid state requires consideration of all sites of interaction across the entire surface of the molecule. By collecting all local maxima and minima on the MEPS, we can define a set of H-bond interaction sites, αi and βj, that completely describe the interactions that the molecule makes with its environment.
We assume that a crystalline solid optimises all possible interactions, so all H-bond sites on the surface of a molecule are independent and free to find their optimal partner in the solid. We ignore potential problems associated with the detailed arrangement of the molecules in the crystal, i.e. there are no steric constraints on contacts, no packing effects, and no cooperativity between sites that are close in space on the surface of the molecule. This approach has the advantage that a knowledge of the crystal structure is not required to estimate the stability and provides a simple strategy for predicting the pairwise interactions that will occur in the solid state. Thus the highest αi interacts with the highest βj, the second highest αi with the second highest βj, etc. The total interaction site pairing energy of the solid is estimated as the sum over all contacts (eqn (1)).
 | (Eqn. 1) |
In reality, there are often multiple solutions to the problem of packing molecules in the solid state, and the pairing of interaction sites differs from one solid form to another. However, the difference in energy between different polymorphic forms is usually small, because the changes in structure involve swapping intermolecular contacts of similar energy. Since we are interested in the overall pairing energy of the solid rather than the details of the structure, the approximations introduced by adopting a strict hierarchical pairing strategy are unlikely to be disastrous.
We assume that the solid contains only attractive electrostatic interactions. Thus if the number of H-bond donor and acceptor sites differs, we assume that the molecules can be arranged in such a way that the excess sites are not forced to make unfavourable contacts with each other, rather they find gaps or regions of low electrostatic potential such that they make no contribution to the total electrostatic interaction energy in eqn (1). Eqn (1) therefore provides a simple method for estimating the interaction site pairing energy of a solid.
A cocrystal is treated in exactly the same way as a single component solid. Thus for a two component cocrystal, we combine the values of αi and βj of the two components into a single list of H-bond parameters that describes the surfaces of both molecules, and then pair the highest αi with the highest βj and so on in exactly the same way as the calculation for a single component solid. Different cocrystal stoichiometries can be treated by adding the appropriate number of duplicate copies of αi and βj values to the list used in the sum in eqn (1). The difference between the interaction site pairing energies of the cocrystal and the two pure forms provides a measure of the probability of forming a cocrystal based on the formation of more favourable intermolecular interactions (eqn (2)). The higher the absolute value of the energy difference, ΔE, the stronger the interactions between the two different components and the more probable is the formation of cocrystals.
| ΔE = Ecc − nE1 − mE2 | (Eqn. 2) |
The interaction site pairing strategy used to calculate E means that the maximum value of ΔE in eqn (2) is zero, i.e. formation of the cocrystal can only improve the interaction energy. In the worst case scenario, the interaction sites that are paired will be identical in the cocrystal and pure forms, so the interaction site pairing energy for the cocrystal will be the same as for the pure forms. In addition to estimating the relative stabilities of the solids, the interaction site pairing strategy also makes predictions about the intermolecular contacts that are formed in the cocrystal, and this can be used to validate the approach for systems for which X-ray crystal structure data is available.
Results and discussion
To illustrate how the calculation works in practice, we will first examine a small experimental cocrystal screen. We then apply the method to screening large compound libraries with diverse functionality and explore the potential of the approach to identify cocrystal coformers from a list of nearly 1,000 substances from the EAFUS list (Everything added to food in the United States) published by the Food and Drug Administration (FDA).31 Note that some of the compounds in this list are liquids, but we do not make any distinction between liquids and solids or between cocrystals and solvates in the analysis that follows. In effect, we assume that the interaction site pairing energy of a liquid and a solid are identical for the purposes of the calculation.Comparison of a virtual and experimental cocrystal screen
An experimental cocrystal screen was recently reported on a series of 19 compounds containing phenol, pyridine and cyano moieties, and an API with more diverse functionality, bicalutamide (Fig. 1(a)).32 Pairwise combinations of all of these compounds resulted in a total of 13 cocrystals (or hits). This system provides us with a simple test of the computational approach outlined above. For each compound, gas phase ab initio calculations were used to identify maxima and minima in the molecular electrostatic potential mapped onto the 0.002 Bohr Å−3 electron density isosurface. The molecular electrostatic potentials were converted into the corresponding H-bond parameters, αi and βj, using eqn (3) and (4). The result is illustrated for compound A, 3-cyanophenol, in Fig. 1(b).| α = 0.0000162 MEPmax2 + 0.00962 MEPmax | (Eqn. 3) |
| β = 0.000146 MEPmin2 − 0.00930 MEPmin | (Eqn. 4) |
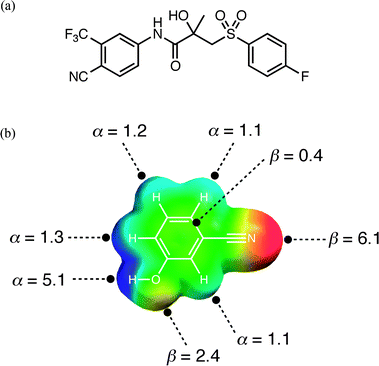 | ||
| Fig. 1 (a) The structure of compound E, bicalutamide. (b) Molecular electrostatic potential surface of compound A, 3-cyanophenol (blue +150 kJ mol−1 to red −150 kJ mol−1) used to determine H-bond donor parameters, α, from the positive regions and H-bond acceptor parameters, β, from the negative regions. | ||
The H-bond parameters were used in conjunction with eqn (1) and eqn (2) to calculate the change in interaction site pairing energy for formation of a 1![[thin space (1/6-em)]](https://www.rsc.org/images/entities/char_2009.gif) :
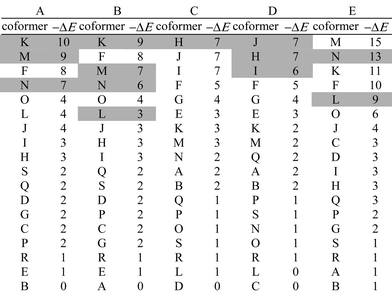
:![[thin space (1/6-em)]](https://www.rsc.org/images/entities/char_2009.gif) 1 cocrystal from the two pure forms for all pairwise combinations of the 19 compounds. The results are summarised in Table 1. For each compound that is found to form a cocrystal experimentally, the results for the 18 potential coformers are ranked by the calculated energy difference, ΔE. In all cases, the compounds that are found to form cocrystals experimentally (shaded boxes) are near the top of the ranked list. This suggests that the calculated parameter ΔE constitutes a rather good predictor of the probability of forming a cocrystal from two pure solid phases.
1 cocrystal from the two pure forms for all pairwise combinations of the 19 compounds. The results are summarised in Table 1. For each compound that is found to form a cocrystal experimentally, the results for the 18 potential coformers are ranked by the calculated energy difference, ΔE. In all cases, the compounds that are found to form cocrystals experimentally (shaded boxes) are near the top of the ranked list. This suggests that the calculated parameter ΔE constitutes a rather good predictor of the probability of forming a cocrystal from two pure solid phases.
| a (A) 3-cyanophenol, (B) 4-cyanophenol, (C) 3-cyanopyridine, (D) 4-cyanopyridine, (E) bicalutamide, (F) 1-hexadecanol, (G) 1-naphthol, (H) 4,4′-biphenol, (I) 1,3-dihydroxybenzene, (J) 1,3,5-trihydroxybenzene, (K) 4-phenylpyridine, (L) 4,4′-bipyridine, (M) 1,2-bis(4-dipyridyl)ethane, (N) trans-1,2-bis(4-dipyridyl)ethylene, (O) 1-cyanonaphthalene, (P) 1,3-dicyanobenzene, (Q) 1,4-dicyanobenzene, (R) 3-hydroxypyridine, (S) 5-hydroxyisoquinoline. | |||||||||
|---|---|---|---|---|---|---|---|---|---|
|
|||||||||
An attractive feature of the approach is that the origin of the favourable cocrystal energy can be directly attributed to specific functional group interactions. Although we do not calculate the three-dimensional structures of the solids, calculation of the interaction site pairing energies does involve assigning specific functional group interactions to each of the three solid phases. Thus the calculation involves prediction of functional group contacts that should be present in the solid, and these predictions can be tested for systems for which X-ray crystal structures have been determined. Fig. 2 illustrates the key functional group interactions that dominate ΔE for the cocrystal that is formed between compounds A and K. In pure A, the best H-bond donor, phenol (α = 5.1), is paired with the best H-bond acceptor, the cyano group (β = 6.1). In pure K, there are no good H-bond donors, so the best H-bond acceptor, pyridine (β = 7.3), makes a weak CH⋯N H-bond. In the cocrystal, the cyano-phenol H-bond is replaced by the much stronger pyridine-phenol H-bond, and the cyano group replaces pyridine in the weak CH⋯N H-bond. There is a net benefit of 4–5 kJ mol−1 associated with this H-bond exchange reaction. Fig. 2(b) shows the X-ray crystal structures of pure A and the cocrystal. All of the predicted H-bonds illustrated in Fig. 2(a) are indeed present. The sites of the CH⋯N interactions with compound K are not well-defined, because the interaction energy would be similar with any of the CH H-bond donor sites. The interaction illustrated in Fig. 2(a) happens to be the one observed in the cocrystal X-ray crystal structure, but this is not something that the method is capable of predicting.
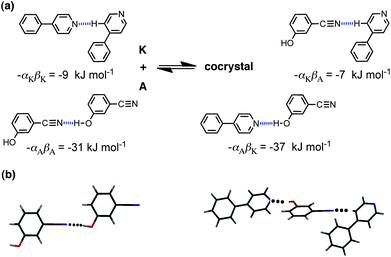 | ||
| Fig. 2 (a) Intermolecular interactions that make the most important contribution to the cocrystal energy for the cocrystal formed between compounds A and K. (b) The predicted H-bond for pure A is observed in the X-ray crystal structure (CCDC reference code ABEGEM), and the two interactions predicted for the cocrystal are observed in the X-ray structure (CCDC reference code KIHXAB). | ||
The values of the H-bond parameters, αi and βj, calculated by this method are subject to significant error. There is experimental data on the H-bond properties of compounds A and K in carbon tetrachloride solution. The experimental value of β for compound K is very close to the value calculated from the MEPS (7.4 compared with 7.3),33 but the experimental value of α for compound A (4.5) is significantly lower than the calculated value (5.1).34 Similarly, experimental data on the H-bond properties of aromatic nitriles suggest that the value of β should be closer to 5 than the calculated value of 6.1.35 Nevertheless, the approach appears to be sufficiently robust to tolerate these discrepancies and provide a reasonable prediction of the probability of forming a cocrystal. Moreover, the ability to relate the results of the calculation to specific functional group interactions should be particularly powerful in aiding the rational design of new cocrystals based on the key cocrystal motifs that are calculated. The example above is in some senses trivial, in that the interaction of phenols with pyridines is well-known. However, this example does provide an illustration of the potential of the method, because we are not just dealing with a single supramolecular synthon, the phenol-pyridine H-bond, rather we consider the sum over all interactions in the solid, and so it is a general approach. We will now examine how well this approach performs with a much more complicated and diverse set of compounds.
Caffeine cocrystals
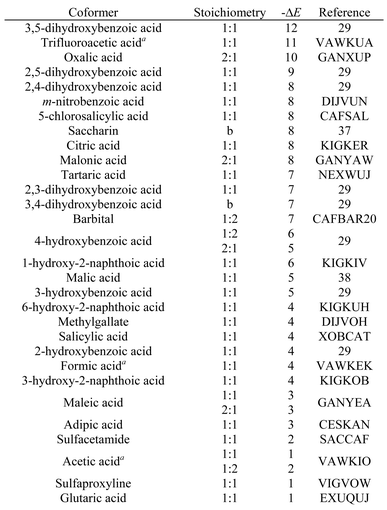
Caffeine is a typical pharmaceutical model compound which has been widely studied and 30 cocrystals have been reported (Table 2).36,29 We created a list of 849 potential coformers using compounds from the EAFUS list (Everything added to food in the United States) published by the Food and Drug Administration (FDA)31 with the addition of missing compounds that are known to form caffeine cocrystals experimentally. This list represents a large pool of compounds with very diverse functionality that can be used to carry out a virtual screen for caffeine cocrystals. A list of H-bond parameters, αi and βi, was calculated for each compound using the DFT MEPS, and eqns (1) and (2) were used to calculate the change in interaction site pairing energy for formation of a 1![[thin space (1/6-em)]](https://www.rsc.org/images/entities/char_2009.gif) :
:![[thin space (1/6-em)]](https://www.rsc.org/images/entities/char_2009.gif) 1 cocrystal with caffeine. This allowed the construction of a ranked list of the probability of obtaining a cocrystal with each of the 849 potential coformers based on the values of ΔE. In this case, the experimental screen of caffeine with all of the compounds on the list has not been carried out, but we assume that the 30 cocrystals that have been reported (the hits) represent the result of random sampling of compounds from the list. Thus there may be compounds near the top of the ranked list that have never been tested for cocrystal formation with caffeine, so that the fact they are not amongst the experimental hits has no significance. However, we expect that hits should be enriched at the top of the ranked list and depleted at the bottom, if the virtual cocrystal screening approach works well.
1 cocrystal with caffeine. This allowed the construction of a ranked list of the probability of obtaining a cocrystal with each of the 849 potential coformers based on the values of ΔE. In this case, the experimental screen of caffeine with all of the compounds on the list has not been carried out, but we assume that the 30 cocrystals that have been reported (the hits) represent the result of random sampling of compounds from the list. Thus there may be compounds near the top of the ranked list that have never been tested for cocrystal formation with caffeine, so that the fact they are not amongst the experimental hits has no significance. However, we expect that hits should be enriched at the top of the ranked list and depleted at the bottom, if the virtual cocrystal screening approach works well.
The energy differences calculated for the 30 hits span a wide range (Table 2), and there is no obvious pattern. However, if we compare these energies with the total distribution of ΔE values for all 849 compounds, it is clear that the distribution of ΔE values for the hits is significantly different from the random distribution (Fig. 3). The results for 1![[thin space (1/6-em)]](https://www.rsc.org/images/entities/char_2009.gif) :
:![[thin space (1/6-em)]](https://www.rsc.org/images/entities/char_2009.gif) 1, 1
1, 1![[thin space (1/6-em)]](https://www.rsc.org/images/entities/char_2009.gif) :
:![[thin space (1/6-em)]](https://www.rsc.org/images/entities/char_2009.gif) 2 and 2
2 and 2![[thin space (1/6-em)]](https://www.rsc.org/images/entities/char_2009.gif) :
:![[thin space (1/6-em)]](https://www.rsc.org/images/entities/char_2009.gif) 1 caffeine:coformer stoichiometries are plotted separately in Fig. 3, and in all three cases, the probability of finding a hit increases with the calculated ΔE value. In practice, the calculations for the three different stoichiometries do not yield very different results: neither the ΔE values nor the rank ordering of the compounds change significantly with stoichiometry, and so we will focus on the results for the 1
1 caffeine:coformer stoichiometries are plotted separately in Fig. 3, and in all three cases, the probability of finding a hit increases with the calculated ΔE value. In practice, the calculations for the three different stoichiometries do not yield very different results: neither the ΔE values nor the rank ordering of the compounds change significantly with stoichiometry, and so we will focus on the results for the 1![[thin space (1/6-em)]](https://www.rsc.org/images/entities/char_2009.gif) :
:![[thin space (1/6-em)]](https://www.rsc.org/images/entities/char_2009.gif) 1 stoichiometry. The results can be analysed in the form of a recall plot (Fig. 4). The calculations were used to construct a ranked list of all of the potential coformers in order of decreasing probability of cocrystal formation. As we descend the ranked list, the recall plot shows the fraction of hits found as a function of fraction of the ranked list sampled. In other words, the recall plot provides a representation of how well the approach would perform in choosing coformers in a screening experiment. As explained above, the experimental hits do not represent the result of a genuine screen, but we will treat the data as if it were in order to demonstrate the potential of the virtual screening methodology. The recall plot shows that the cocrystal prediction method would perform significantly better than random screening with almost 80% of the hits in the top 10% of the ranked list.
1 stoichiometry. The results can be analysed in the form of a recall plot (Fig. 4). The calculations were used to construct a ranked list of all of the potential coformers in order of decreasing probability of cocrystal formation. As we descend the ranked list, the recall plot shows the fraction of hits found as a function of fraction of the ranked list sampled. In other words, the recall plot provides a representation of how well the approach would perform in choosing coformers in a screening experiment. As explained above, the experimental hits do not represent the result of a genuine screen, but we will treat the data as if it were in order to demonstrate the potential of the virtual screening methodology. The recall plot shows that the cocrystal prediction method would perform significantly better than random screening with almost 80% of the hits in the top 10% of the ranked list.
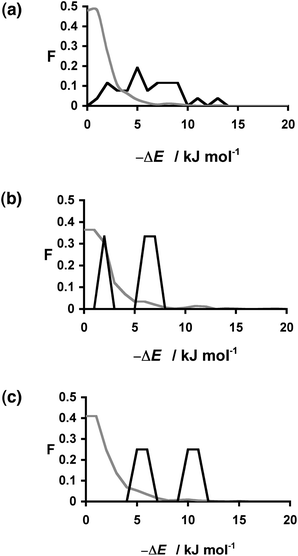 | ||
Fig. 3 Distribution of changes in interaction site pairing energy (ΔE in kJ mol−1) for formation of a cocrystal of caffeine and 849 coformers (grey) and the corresponding distribution for the experimentally observed hits (black). Calculations were carried out for caffeine:coformer stoichiometries of (a) 1![[thin space (1/6-em)]](https://www.rsc.org/images/entities/char_2009.gif) : :![[thin space (1/6-em)]](https://www.rsc.org/images/entities/char_2009.gif) 1 (b) 1 1 (b) 1![[thin space (1/6-em)]](https://www.rsc.org/images/entities/char_2009.gif) : :![[thin space (1/6-em)]](https://www.rsc.org/images/entities/char_2009.gif) 2 (c) 2 2 (c) 2![[thin space (1/6-em)]](https://www.rsc.org/images/entities/char_2009.gif) : :![[thin space (1/6-em)]](https://www.rsc.org/images/entities/char_2009.gif) 1. F is the normalised frequency for 1 kJ mol−1 bins of ΔE. 1. F is the normalised frequency for 1 kJ mol−1 bins of ΔE. | ||
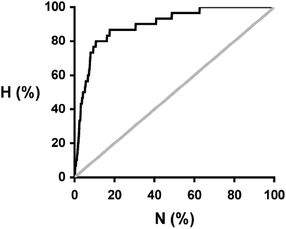 | ||
Fig. 4 Recall plot for the prediction of 1![[thin space (1/6-em)]](https://www.rsc.org/images/entities/char_2009.gif) : :![[thin space (1/6-em)]](https://www.rsc.org/images/entities/char_2009.gif) 1 cocrystals of caffeine with 849 potential coformers (black line). H is the fraction of total hits found plotted as function of the fraction of compounds sampled (N). The grey line represents probability of finding a hit as the result of random chance. 1 cocrystals of caffeine with 849 potential coformers (black line). H is the fraction of total hits found plotted as function of the fraction of compounds sampled (N). The grey line represents probability of finding a hit as the result of random chance. | ||
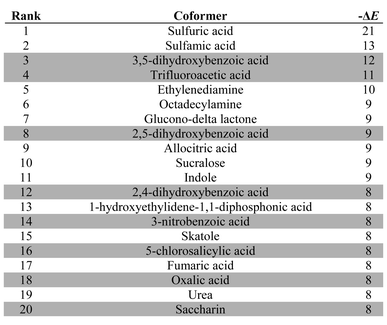
Table 3 lists the top twenty compounds in the ranked list of caffeine coformers. The compounds that are not shaded in Table 3 represent interesting candidates for experimental study, because there may not have been previous attempts to form cocrystals with caffeine. There are clear similarities between the top ranked compounds in Table 3. Compounds with very strong H-bond donor sites, acids, pyrroles and phenols, are preferred, because caffeine has many H-bond acceptor sites and no strong H-bond donors. Indeed, the supramolecular heterosynthon that is most commonly observed in X-ray structures of caffeine cocrystals is a H-bond between a carboxylic acid donor and the imidazole nitrogen acceptor of caffeine. In this context, the presence of simple amines in Table 3 is surprising. Inspection of the pairwise interactions that are responsible reveals that this is due to the fact that the amines are exceptional H-bond acceptors and have very poor donors. Thus the interchange of NH⋯N H-bonds for CH⋯N H-bonds favours the cocrystal. There is no experimental evidence to corroborate this observation.
![[thin space (1/6-em)]](https://www.rsc.org/images/entities/char_2009.gif) :
:![[thin space (1/6-em)]](https://www.rsc.org/images/entities/char_2009.gif) 1 stoichiometry (ΔE in kJ mol−1). Experimentally observed hits are shaded grey
1 stoichiometry (ΔE in kJ mol−1). Experimentally observed hits are shaded grey
|
Carbamazepine cocrystals
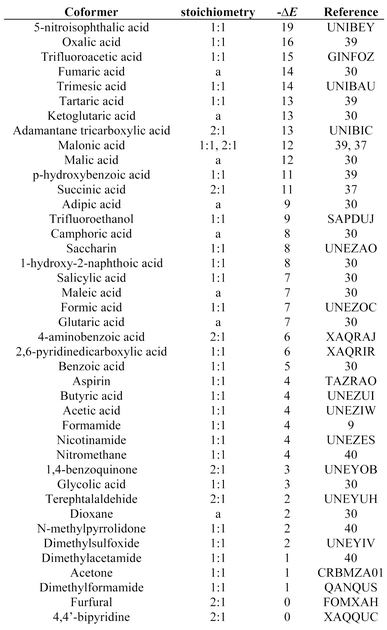
We carried out a similar analysis for carbamazepine. The solid forms of this API have been intensively studied, and 41 different cocrystals have been reported (Table 4).30,39 We again used the EAFUS list with the addition of missing compounds that are known to form carbamazepine cocrystals to create a list of 860 potential coformers. The change in interaction site pairing energy, ΔE, was calculated for each of the 860 compounds and used to construct a ranked list of the probability of obtaining a 1![[thin space (1/6-em)]](https://www.rsc.org/images/entities/char_2009.gif) :
:![[thin space (1/6-em)]](https://www.rsc.org/images/entities/char_2009.gif) 1 cocrystal with carbamazepine. The results for the compounds that are experimentally known to form cocrystals (the hits) are presented in Table 4. The ΔE values span a wide range with no clear trends. However, the distribution of ΔE values found for the hits is clearly different from that found for the entire sample: compounds that are hits have significantly higher values of ΔE than expected based on a random distribution of hits (Fig. 5(a)). The recall plot in Fig. 5(b) shows that identification of hits by this virtual screening approach is an improvement over random sampling with 50% of the hits in the top 10% of the ranked list.
1 cocrystal with carbamazepine. The results for the compounds that are experimentally known to form cocrystals (the hits) are presented in Table 4. The ΔE values span a wide range with no clear trends. However, the distribution of ΔE values found for the hits is clearly different from that found for the entire sample: compounds that are hits have significantly higher values of ΔE than expected based on a random distribution of hits (Fig. 5(a)). The recall plot in Fig. 5(b) shows that identification of hits by this virtual screening approach is an improvement over random sampling with 50% of the hits in the top 10% of the ranked list.
| a Stoichiometry not stated. | |||
|---|---|---|---|
|
|||
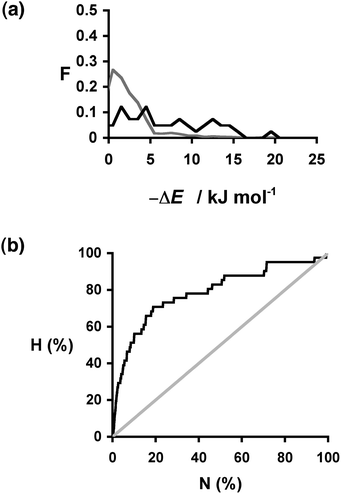 | ||
Fig. 5 (a) Distribution of changes in interaction site pairing energy (ΔE in kJ mol−1) for formation of a cocrystal of carbamazepine with 860 potential coformers (grey) and the corresponding distribution for the experimentally observed hits (black). F is the normalised frequency for 1 kJ mol−1 bins of ΔE. (b) Recall plot for the prediction of 1![[thin space (1/6-em)]](https://www.rsc.org/images/entities/char_2009.gif) : :![[thin space (1/6-em)]](https://www.rsc.org/images/entities/char_2009.gif) 1 cocrystals of carbamazepine with 860 potential coformers (black line). H is the fraction of total hits found plotted as function of the fraction of compounds sampled (N). The grey line represents probability of finding a hit as the result of random chance. 1 cocrystals of carbamazepine with 860 potential coformers (black line). H is the fraction of total hits found plotted as function of the fraction of compounds sampled (N). The grey line represents probability of finding a hit as the result of random chance. | ||
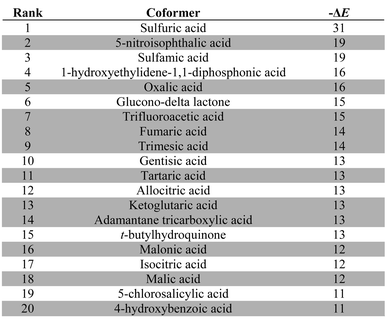
Carbamazepine is in principle a more difficult problem than caffeine in terms of functionality, because it contains both good H-bond donors and good H-bond acceptors, so the cocrystal exchange energy is determined by swapping different kinds of H-bonds. The recall plot is not quite as good as the one obtained for caffeine, but the results are still very promising. As for caffeine, the top compounds in the ranked list are mainly carboxylic acids (Table 5). The reason is illustrated in Fig. 6. Amides are significantly better H-bond acceptors than carboxylic acids, and carboxylic acids are much better H-bond donors than amides, so the heterosynthon is favoured over the two homosynthons by 4 kJ mol−1. The H-bond motifs in Fig. 6 are observed in all of the corresponding X-ray crystal structures of the pure carboxylic acids, pure carbamazepine and the cocrystals. The method we use to predict interaction site pairing does not take account of the geometric relationships between functional groups, so the formation of cooperative H-bonds between adjacent binding sites is missing from our analysis. Nevertheless, we appear to be able to make reasonably good predictions of the thermodynamic consequences of these motifs.
![[thin space (1/6-em)]](https://www.rsc.org/images/entities/char_2009.gif) :
:![[thin space (1/6-em)]](https://www.rsc.org/images/entities/char_2009.gif) 1 stoichiometry (ΔE in kJ mol−1). Experimentally observed hits are shaded grey
1 stoichiometry (ΔE in kJ mol−1). Experimentally observed hits are shaded grey
|
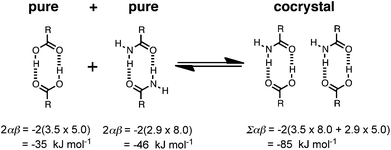 | ||
| Fig. 6 Intermolecular interactions that make the most important contribution to the change in the interaction site pairing energy for cocrystals formed between carboxylic acids and carbamazepine. These H-bond motifs are predicted by pairing the strongest donors and acceptors and are observed experimentally in X-ray crystal structures. | ||
Thermodynamic analysis
The distribution plots in Fig. 3(a) and 5(a) provide a means of assessing the relationship between the calculated value of ΔE and the probability of success in identifying a cocrystal. For the purposes of this analysis, we will assume that experimental collection of cocrystal data for caffeine and carbamazepine represents the result of an exhaustive screen of all of the compounds in our list of potential coformers. For every 1 kJ mol−1 bin of cocrystal exchange energy, we compare the number of potential coformers with the number of observed hits. This ratio is the probability of successful cocrystal prediction, P, for a given value of ΔE. Fig. 7 shows that there is a clear relationship between these two parameters for both the caffeine and carbamazepine data. In fact, the two data sets show remarkably similar behaviour, and the sigmoidal nature of the trends in Fig. 7 suggests that there may be a general relationship between P and ΔE. If we assumed that the pure and cocrystal states were in equilibrium, then the probability of populating the cocrystal state would be described by a Boltzmann distribution (eqn (5)). | (Eqn. 5) |
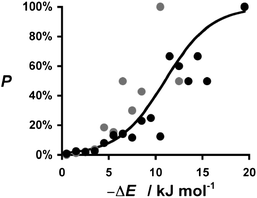 | ||
| Fig. 7 Relationship between the probability of obtaining a cocrystal, P, and the calculated change in interaction site pairing energy, ΔE. Data for caffeine cocrystals in grey and carbamazepine cocrystals in black. The curve represents the Boltzmann distribution calculated using eqn (5) and 6. | ||
This formulation provides a rather good description of the experimental data in Fig. 7 for the condition:
| ΔG = ΔE + 11 kJ mol−1 | (Eqn. 6) |
The constant term of 11 kJ mol−1 disfavours cocrystal formation. When the gain in interaction site pairing energy is less than this threshold, there is insufficient thermodynamic driving force to strongly perturb the probability of obtaining cocrystals from a crystallisation experiment, and cocrystallisation is a matter of chance. However, when ΔE < −11 kJ mol−1, then the chances of obtaining a cocrystal are better than 50![[thin space (1/6-em)]](https://www.rsc.org/images/entities/char_2009.gif) :
:![[thin space (1/6-em)]](https://www.rsc.org/images/entities/char_2009.gif) 50. This provides a rather useful insight into the significance of ΔE. By applying eqn (5) and (6), this parameter is transformed from a simple ranking tool to a direct estimate of probability of success in a cocrystallisation experiment, which provides a powerful practical tool for virtual screening.
50. This provides a rather useful insight into the significance of ΔE. By applying eqn (5) and (6), this parameter is transformed from a simple ranking tool to a direct estimate of probability of success in a cocrystallisation experiment, which provides a powerful practical tool for virtual screening.
Conclusions
This work is a first attempt to develop a virtual high-throughput screen to predict the probability of cocrystal formation based on interaction site pairing energies calculated using α and β H-bond parameters determined from molecular electrostatic potential surfaces. The approach allows rapid assessment of large compound libraries, because the calculation ignores all aspects of three-dimensional structure. We assume that all interactions that can be made in the solid state are made, and therefore the interactions formed in the crystal can be determined in a straightforward hierarchical manner by pairing the best H-bond donor with the best acceptor, the next best donor with the next best acceptor, and so on. The interaction site pairing energy of the solid is evaluated by simply summing over all of these contacts. The difference between the interaction site pairing energies of the cocrystal and the two pure forms, ΔE, provides a parameter for evaluating the probability of cocrystal formation. Test calculations on the recall of coformers for caffeine and for carbamazepine from a list of nearly 1,000 candidates have been used to validate the utility of the method, and the results provide a calibration between the value of ΔE and the probability of cocrystal formation. This new approach therefore appears to be a very promising computational tool for improving the efficiency of cocrystal screens by limiting the number of candidate coformers to be studied experimentally to only those compounds that show promise by virtue an array of functional groups that are complementary to the API of interest.Experimental
MEPS were computed using Spartan '06. The molecules were drawn in extended conformations and energy minimized using DFT B3LYP/6-31+G* ab initio calculations. Purpose-written software was used to extract local maxima and minima from the molecular electrostatic potential mapped onto the 0.002 Bohr Å−3 electron density isosurface. Conversion of these MEP values into αi and βj H-bond parameters and calculation of the energies of the pure and cocrystal solids, E, were performed using Excel spreadsheets.Eqn (3) and (4) that were used to convert MEP values into αi and βj H-bond parameters differ from the previously published relationship, which was based on semi-empirical AM1 calculations.25 DFT calculations provide a significantly better description of the experimentally determined H-bond parameters, α2H and β2H, than the AM1 methods that we used previously. However, the relationships between the DFT MEP values and α2H and β2H are quadratic rather than linear, as we found for AM1 MEP values.
Acknowledgements
We thank AstraZeneca for financial support. R.P. thanks the Government of Catalonia (DIUE) for a grant.Notes and references
- O. Almarsson and M. J. Zaworotko, Chem. Commun., 2004, 1889–1896 RSC.
- R. Banerjee, P. M. Bhatt, N. V. Ravindra and G. R. Desiraju, Cryst. Growth Des., 2005, 5, 2299–2309 CrossRef CAS.
- A. V. Trask, W. D. S. Motherwell and W. Jones, Int. J. Pharm., 2006, 320, 114–123 CrossRef CAS.
- D. P. McNamara, S. L. Childs, J. Giordano, A. Iarriccio, J. Cassidy, M. S. Shet, R. Mannion, E. O'Donnell and A. Park, Pharm. Res., 2006, 23, 1888–1897 CrossRef CAS.
- P. Vishweshwar, J. A. McMahon, J. A. Bis and M. J. Zaworotko, J. Pharm. Sci., 2006, 95, 499–516 CrossRef.
- A. V. Trask, Mol. Pharmaceutics, 2007, 4, 301–309 CrossRef CAS.
- S. L. Morisette, Ö. Almarsson, M. L. Peterson, J. F. Remenar, M. J. Read, A. V. Lemmo, S. Ellis, M. J. Cima and C. R. Gardner, Adv. Drug Delivery Rev., 2004, 56, 275–300 CrossRef.
- J. A. Bis, P. Vishweshwar, R. A. Middleton and M. J. Zaworotko, Cryst. Growth Des., 2006, 6, 1048–1053 CrossRef CAS.
- S. G. Fleischman, S. S. Kuduva, J. A. McMahon, B. Moulton, R. D. Bailey Walsh, N. Rodriguez-Hornedo and M. J. Zaworotko, Cryst. Growth Des., 2003, 3, 909–919 CrossRef CAS.
- T. Friščić, A. V. Trask, W. Jones and W. D. S. Motherwell, Angew. Chem., Int. Ed., 2006, 45, 7546–7550 CrossRef CAS.
- A. V. Trask, W. D. S. Motherwell and W. Jones, Chem. Commun., 2004, 890–891 RSC.
- G. G. Z. Zhang, R. F. Henry, T. B. Borchardt and X. C. Lou, J. Pharm. Sci., 2007, 96, 990–995 CrossRef CAS.
- R. A. Chiarella, R. J. Davey and M. L. Peterson, Cryst. Growth Des., 2007, 7, 1223–1226 CrossRef CAS.
- K. Chadwick, R. Davey and W. Cross, CrystEngComm, 2007, 9, 732–734 RSC.
- T. Friščić and W. Jones, Cryst. Growth Des., 2009, 9, 1621–1637 CrossRef CAS.
- E. Lu, N. Rodriguez-Hornedo and R. Suryanarayanan, CrystEngComm, 2008, 10, 665–668 RSC.
- C. B. Aakeröy, J. Desper and M. M. Smith, Chem. Commun., 2007, 3936–3938 RSC.
- N. Issa, P. G. Karamertzanis, G. W. A. Welch and S. L. Price, Cryst. Growth Des., 2009, 9, 442–453 CrossRef CAS.
- T. R. Shattock, K. Arora, P. Vishweshwar and M. J. Zaworotko, Cryst. Growth Des., 2008, 8, 4533–4545 CrossRef CAS.
- L. Infantes and W. D. S. Motherwell, Chem. Commun., 2004, 1166–1167 RSC.
- T. S. Thakur and G. R. Deiraju, Cryst. Growth Des., 2008, 8, 4031–4044 CrossRef CAS.
- P. T. A. Galek, F. H. Allen, L. Fabian and N. Feeder, CrystEngComm, 2009, 11, 2634–2639 RSC.
- C. B. Aakeröy, J. Desper and J. F. Urbina, Chem. Commun., 2005, 2820–2822 RSC.
- C. Laurence and H. Berthelot, Perspectives in Drug Discovery and Design, 2000, 18, 39–60 Search PubMed.
- C. A. Hunter, Angew. Chem., Int. Ed., 2004, 43, 5310–5324 CrossRef CAS.
- J. L. Cook, C. A. Hunter, C. M. R. Low, A. Perez-Velasco and J. G. Vinter, Angew. Chem., Int. Ed., 2007, 46, 3706–3709 CrossRef CAS.
- M. C. Etter and D. A. Adsmond, J. Chem. Soc., Chem. Commun., 1990, 589–591 RSC.
- M. C. Etter, J. Phys. Chem., 1991, 95, 4601–4610 CrossRef CAS.
- D.-K. Bucar, R. F. Henry, X. Lou, R. W. Duerst, L. R. MacGillivray and G. G. Z. Zhang, Cryst. Growth Des., 2009, 9, 1932–1943 CrossRef CAS.
- S. L. Childs, N. Rodriguez-Hornedo, L. S. Reddy, A. Jayasankar, C. Maheshwari, L. McCausland, R. Shipplett and B. C. Stahly, CrystEngComm, 2008, 10, 856–864 RSC.
- http://www.foodsafety.gov/%7Edms/eafus.html .
- J. A. Bis, P. Vishweshwar, D. Weyna and M. J. Zaworotko, Mol. Pharmaceutics, 2007, 4, 401–416 CrossRef CAS.
- M. Berthelot, C. Laurence, M. Safar and F. Besseau, J. Chem. Soc., Perkin Trans. 2, 1998, 283–290 RSC.
- M. H. Abraham, P. L. Grellier, D. V. Prior, P. P. Duce, J. J. Morris and P. J. Taylor, J. Chem. Soc., Perkin Trans. 2, 1989, 699–711 RSC.
- J. Y. Le Questel, M. Berthelot and C. Laurence, J. Chem. Soc., Perkin Trans. 2, 1997, 2711–2717 RSC.
- A. V. Trask, W. D. S. Motherwell and W. Jones, Cryst. Growth Des., 2005, 5, 1013–1021 CrossRef CAS.
- E. Lu, N. Rodriguez-Hornedo and R. Suryanarayanan, CrystEngComm, 2008, 10, 665–668 RSC.
- T. Friscic, S. L. Childs, S. A. A. Rizvi and W. Jones, CrystEngComm, 2009, 11, 418–426 RSC.
- S. L. Childs, P. A. Wood, N. Rodriguez-Hornedo, L. S. Reddy and K. I. Hardcastle, Cryst. Growth Des., 2009, 9, 1869–1888 CrossRef CAS.
- A. Johnston, B. F. Johnston, A. R. Kennedy and A. J. Florence, CrystEngComm, 2008, 10, 23–25 RSC.
| This journal is © The Royal Society of Chemistry 2011 |

