Novel electrode reactions of diazepam, flunitrazepam and lorazepam and their exploitation in a new redox mode LC-DED assay for serum†‡
Kevin C.
Honeychurch
a,
Ai Teng
Chong
b,
Khalil
Elamin
a and
John P.
Hart
*a
aCentre for Research in Biosciences, Health and Life Sciences, University of the West of England, Bristol, Frenchay Campus, Coldharbour Lane, Bristol, BS16 1QY, UK. E-mail: john.hart@uwe.ac.uk; Fax: +44 117 3282904; Tel: +44 117 3282469
bDepartment of Laboratory Medicine, National University Hospital, Singapore, 119074, Singapore
First published on 17th November 2011
Abstract
Previously unreported voltammetric redox behaviour was identified for flunitrazepam, lorazepam and diazepam at a glassy carbon electrode. This was successfully exploited for their determination in serum by high performance liquid chromatography dual electrode detection in the redox mode (LC-DED). Initial studies were performed to optimise the chromatographic conditions and these were found to be 50% acetone, 50% 100 mM pH 2 phosphate buffer at a flow rate of 0.8 ml min−1, employing a Hypersil C18, 5 μm, 250 mm × 4.6 mm column held at 40 °C. Cyclic voltammetric studies were made to ascertain the redox behaviour of these benzodiazepines over the pH range 2–10. Hydrodynamic voltammetry was used to optimise the applied potential at the amperometric generator and detector cells; these were identified to be −2.45 V (vs. stainless steel) and +1.0 V. (vs.Ag/AgCl).
Introduction
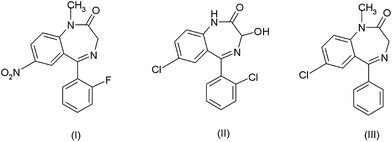
Benzodiazepines are a class of well-known tranquillisers that are prescribed medically for a number of conditions. In addition, recent reviews have also highlighted the forensic importance of this class of compounds,1,2 showing flunitrazepam (Rohypnol), (I) lorazepam (Ativan or Temesta) (II) and diazepam (Valium) (III) had been involved in criminal activity3 and abuse.4 Recently concern has also focused on the effects of such compounds in the environment5 which affects both humans6 and wildlife.7As a result of the above use and abuse of these three compounds a number of methods have been developed for their determination. The most popular approaches utilise gas chromatography-mass spectrometry (GC-MS), liquid chromatography with either mass spectrometry (LC-MS) or UV detection (LC-UV).8–10GC-MS requires the use of deuterated standards or derivatization,11 as a number of benzodiazepines are not thermally stable and decompose to common products making quantification difficult.12 Consequently, the relative ease of extraction and use of ambient temperatures has made LC a more attractive method, as derivatization is not required and problems of thermal degradation are not an issue. Commonly, reverse chromatography utilises only a relatively small number of organic mobile phase modifiers, such as methanol and acetonitrile. However, problems such as the periodic shortages in the availability of acetonitrile13,14 have highlighted the problems that this limited range of alternatives can present. Therefore, the introduction of an alternative solvent with similar chromatographic properties is highly desirable. However, such alternatives have not been widely explored because the majority of reverse phase LC applications utilise either UV or fluorescence detection which limits the number of possible solvents that can be successfully utilised. Other water miscible solvents such as acetone have relatively high UV cut-off (330 nm) and have not been generally reported as organic modifiers in reverse phase LC analysis. However, other detection formats such as mass spectroscopy,15,16 electrochemical,17 refractive index18 and light scattering19 could feasibly be used with an acetone based solvent system. However, of these alternative detector formats only electrochemical detection offers similar sensitivity, selectivity and economy to that exhibited by UV and fluorescence spectroscopy.20
Recently, we have investigated the possibility of utilizing other solvents such as ethanol and acetone for the LC electrochemical determination of p-nitrophenol17 and have shown these to be comparable to results obtained with methanol or acetonitrile. In this previous study, we utilised dual electrode detection (LC-DED). This has been shown to offer several advantages over LC with reductive mode detection, which is more commonly used for the detection of benzodiazepines.21–23 Reductive mode detection results in the reduction of common sample and mobile phase components such as oxygen, protons and trace metals; this causes problems with background current drifts and limits sensitivity. LC-DED can elevate a number of these problems as in this arrangement two electrochemical cells are arranged in series after the column; the upstream cell is used as the “generator” cell to produce an electroactive species, which is detected at the downstream “detector” cell. This offers the advantages that the electrochemically generated product is more readily oxidized or reduced than the parent compound; as the detector potential is operated at a low applied potential were most sample components do not interfere. Improvements in detection limits are also obtained due to the lower background currents occurring at these potentials.
We have also utilised LC-DED for the determination of the 1,4-benzodiazepine, nitrazepam24,25 and flunitrazepam.24 In the present study, we investigate the possibility of extending the range of benzodiazepine drugs that can be determined using the technique of LC-DED and explore the possibility of using acetone as the mobile phase modifier.
2. Experimental
2.1 Chemicals and reagents
All chemicals were obtained from Fisher (Loughborough, UK), unless otherwise stated. Deionised water was obtained from a Purite RO200 - Stillplus HP System, fitted with a Pur-1-te ion-exchanger (Purite Oxon., UK). Primary benzodiazepine stock solutions (Sigma-Aldrich, Dorset, UK), were prepared by dissolving the required mass in acetone (Fisher, HPLC grade) to give a concentration of 10 mM. Working standards, for initial voltammetric studies, were prepared by dilution of the primary stock in sufficient acetone, 100 mM pH 2 phosphate buffer, to give an overall concentration of 50% acetone, 50% 50 mM phosphate buffer (v/v). Standards for LC-DED analysis were made by dilution of the primary stock solution in mobile phase. Newborn calf bovine serum (HyClone) and ethyl acetate, n-hexane (Trace analysis grade) were obtained from Fisher.2.2 Apparatus and instrumentation
2.3 Cyclic voltammetric studies
Cyclic voltammograms were obtained utilising a supporting electrolyte consisting of 50% acetone, 50% 100 mM phosphate buffer (v/v). Degassing was achieved by purging with oxygen free nitrogen (BOC, Guildford, UK) for 5 min to eliminate oxygen reduction waves. A starting potential of 0.0 V was used, with an initial switching potential of −2.0 V and a second switching potential of +2.0 V, with a final potential of 0.0 V. The effect of scan rate was studied over the range 20 mVs−1 to 200 mVs−1.2.4 Hydrodynamic voltammetry
Hydrodynamic voltammetry (HDV) was performed by injecting fixed volumes of a combined standard solution of the three benzodiazepine under investigation and varying the applied potential between −2.10 V and −2.75 V for the downstream generator electrode, and between +0.80 V and +1.25 V for the upstream detector cell. HDVs were constructed by plotting the recorded peak current against the applied potential. The optimum potential was determined from the position of the plateau on the hydrodynamic wave.2.5 Extraction of diazepam, flunitrazepam and lorazepam form serum
A 1 ml aliquot of serum was thoroughly mixed with 1 ml of 0.5 M Na2CO3. Five ml of n-hexane: ethyl acetate (7![[thin space (1/6-em)]](https://www.rsc.org/images/entities/char_2009.gif) :
:![[thin space (1/6-em)]](https://www.rsc.org/images/entities/char_2009.gif) 3 v/v) was then added and the resulting mixture shaken by hand for 5 min. This was then allowed to stand until the two phases had separated. The upper organic phase was taken and blown down to dryness under nitrogen with gentle heating in a water bath. The resulting residue was then reconstituted in 100 μl of mobile phase and examined by LC-DED.
3 v/v) was then added and the resulting mixture shaken by hand for 5 min. This was then allowed to stand until the two phases had separated. The upper organic phase was taken and blown down to dryness under nitrogen with gentle heating in a water bath. The resulting residue was then reconstituted in 100 μl of mobile phase and examined by LC-DED.
3. Results and discussion
3.1 Cyclic voltammetric investigations of lorazepam, diazepam and flunitrazepam
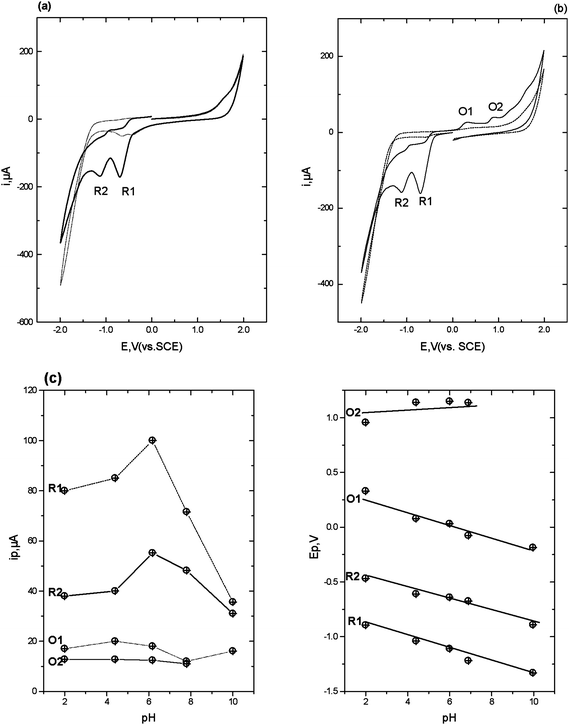 | ||
| Fig. 1 Cyclic voltammograms obtained in the presence (solid line) and absence (dotted line) of 1 mM flunitrazepam in 50% 0.2 M pH 2 phosphate buffer-50% acetone. Scan rate 50 mV s−1, starting and end potential 0.0 V. (a) initial switching potential +2.0 V, second switching potential −2.0 V. (b) initial switching potential −2.0 V, second switching potential +2.0 V. (c) ipversus pH and (d) Ep versus pH. | ||
 | ||
| Scheme 1 | ||
The second reduction peak, R2 is considered to result from the irreversible reduction of the 4,5-azomethine group (Scheme 1).24,25 Interestingly, as can be seen from Fig. 1b, if the scan is first implemented in the negative direction. Two reduction peaks, R1 and R2 were still observable, but several oxidation peaks can then be seen on the return positive scan. The oxidation peak denoted as O1 (+0.2 V at pH 2) was considered to result from the oxidation of the hydroxylamine species generated during R1, to the corresponding nitroso species as we have demonstrated in previous studies.25 To explore this further, cyclic voltammetric investigations were undertaken over the pH range 2 to 10. Peak currents (ip) were found to be pH dependent over the range investigated, with a maximum recorded at ca. pH 6 (Fig. 1c). The Ep of peaks R1, R2 and O1 were found to be pH-dependent, giving a slope of −60 mv/pH (Fig. 1d), indicating that the reactions involve an equal number of protons and electrons. However, O2 was found to be independent of pH, demonstrating that no protons were involved in the rate determining step of the oxidation process. Therefore, we would postulate that this peak resulted from the oxidation of the 1-N lone electron pair to give a radical species.
Notably, these further oxidation peaks are not seen without prior reduction of the molecule. This properly a result of the 1-N group now being freed from the resonance stabilisation of the 7-nitro group.26,27
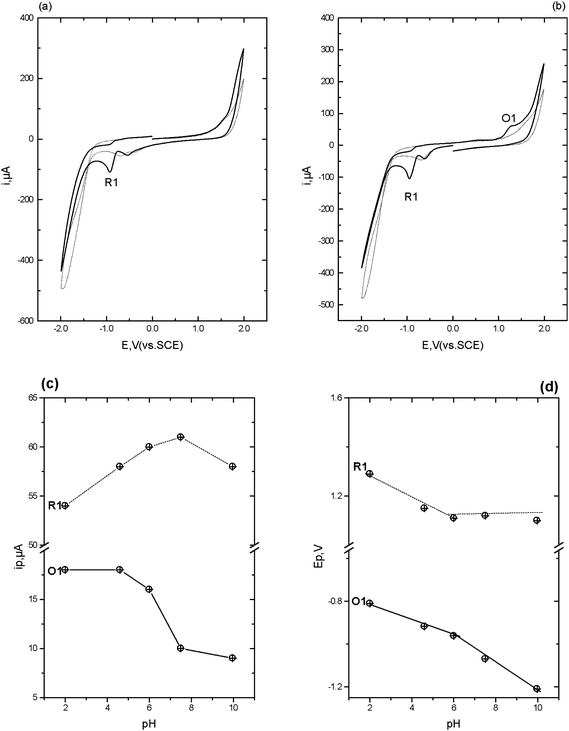 | ||
| Fig. 2 Cyclic voltammograms obtained in the presence (solid line) and absence (dotted line) of 1 mM diazepam in 50% 0.2 M pH 4 phosphate buffer-50% acetone. Scan rate 50 mV s−1, starting and end potential 0.0 V. (a) initial switching potential +2.0 V, second switching potential −2.0 V. (b) initial switching potential −2.0 V, second switching potential +2.0 V. (c) ipversus pH and (d) Ep versus pH. | ||
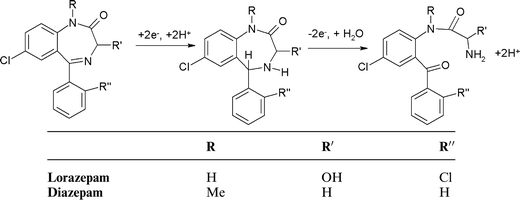 | ||
| Scheme 2 | ||
This scheme shows that diazepam may be first be reduced via a 2e−, 2H+ at the 4,5-azomethine group to give 4,5-dihydro-diazepam, resulting in the voltammetric peak R1. The formation of the secondary amine facilitates a 2e−, 2H+ oxidation leading to opening of the seven membered ring to give the corresponding primary amine and ketone groups (Scheme 2).
Fig. 2c shows the effect of pH, over the range pH 2 to pH 10, on the resulting ip for the redox processes identified. R1 was found to exhibit a maximum peak current at ca. pH 6, with a corresponding decrease in ip for O1. The plot of Epversus pH for both R1 and O1 showed a notable break point at pH 6 which indicates the existence of a pKa = 6. We believe that this is a reflection of the pKa of the 4,5-azomethine group. A previous study has reported a pKa of 3.3 for this group;30 however it is possible for this pKa to be shifted to higher values in the presence of negatively charged species.30
Lorazepam . Typical cyclic voltammograms for lorazepam obtained in 0.1 M phosphate buffer pH 4.0 containing 50% acetone are shown in Fig. 3. Similar cathodic behaviour is seen if the scan is first implemented in the negative (Fig. 3a) or positive (Fig. 3b) direction, with a single reduction peak (R1) being obtained. A smaller reduction wave is also observable at −0.6 V which we believe is a result of the reduction of oxygen substituted species such as aldehydes or mesityl oxide present as impurities in the acetone.31,32
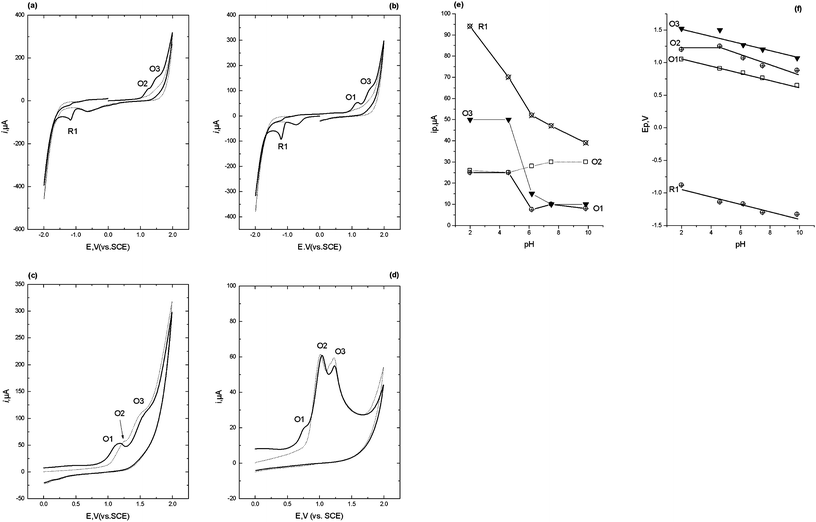 | ||
| Fig. 3 Cyclic voltammograms obtained in the presence (solid line) and absence (dotted line) of 1 mM lorazepam in 50% 0.2 M pH 4 phosphate buffer-50% acetone. Scan rate 50 mV s−1, starting and end potential 0.0 V. (a) initial switching potential +2.0 V, second switching potential −2.0 V. (b) initial switching potential −2.0 V, second switching potential +2.0 V. (c) anodic section, voltammetric conditions as figure 3a (d) anodic section, pH 8, other voltammetric conditions as figure 3a (blanks omitted for clarity) (e) ipversus pH and (f) Ep versus pH. | ||
Fig. 3c shows the anodic section of the voltammogram of lorazepam obtained at pH 4. If the scan is first implemented in the negative direction (not shown), then on the return anodic section two oxidation peaks are obtained (O1 and O3). However, without this negative scan, peak O1 is absent but O3 is present together with a new peak, O2. This indicates that O1 results from the oxidation of a compound formed during the reduction of lorazepam on the initial negative going scan.
Interestingly, at pH values above 4, (Fig. 3d) the three oxidation peaks are still observable. Again, O1 only occurred if the cyclic voltammogram had been implemented in the negative direction first. However, O2 is now present with or without prior reduction. We believe these observed differences in the cyclic voltammetric behaviour of lorazepam must result from two different mechanisms that occur above and below pH 4.
Previous investigations33,34 at Hg electrodes have shown that at low pH values lorazepam is reduced in a 4e−, 4H+ process resulting from the simultaneous 2e−, 2H+ reduction of the 4,5 azomethine bond and the 2e−, 2H+ reduction of the 3-OH group. This possibility may be deduced from the ipversus pH plot shown in Fig. 3e; clearly the magnitude of the current for R1 decreases by 50% when the pH is changed from pH 2 to pH 6. This is illustrated in Scheme 3. Fig. 3f shows that protons are also involved in the electrodes reactions. These previous studies did not report on any anodic behaviour consequently, the current paper appears to be the first that describes reduction and oxidation mechanisms for lorazepam, flunitrazepam and diazepam. We believe that the different anodic behaviour we have observed here in this study results from these two different pH dependent reduction processes occurring in the cathodic section of the voltammogram.
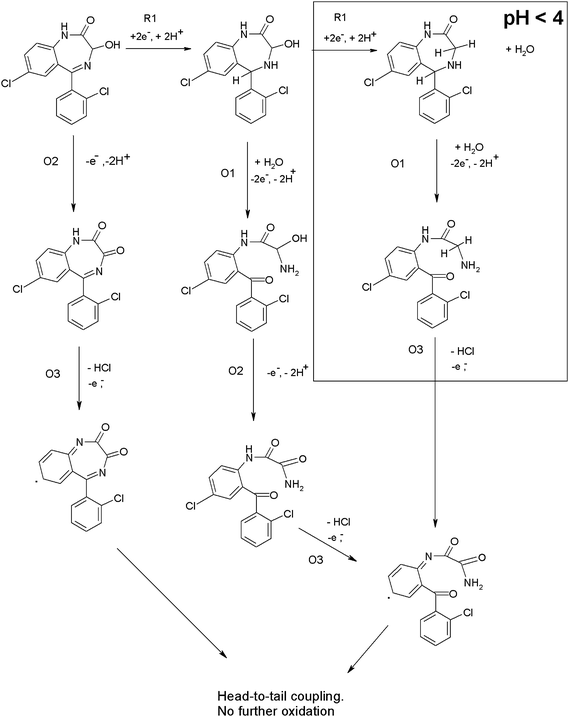 | ||
| Scheme 3 | ||
In summary, the three benzodiazepines (I,II,III) studied exhibit anodic peaks that are only manifested when the compound has been previous reduction of the molecule. Such behaviour is pre-requisite for redox mode dual electrode detection and we decided to exploit this behaviour for their determination following liquid chromatography.
3.2 Reverse phase liquid chromatographic separation of diazepam, flunitrazepam and lorazepam
Studies were carried out to examine the possibility of reducing these retention times by increasing the percentage of acetone in the mobile phase. Increasing the percentage of the organic modifier resulted in the desired decrease in the retention time of the three compounds; however, an accompanying decrease in peak magnitude was also seen with increasing acetone concentration.
3.3 Hydrodynamic voltammetry
Fig. 4a shows the cathodic HDV obtained with the generator cell varied over the potential range −2.15 V to −2.70 V whilst monitoring the current at the detector set at +1.0 V. The HDV exhibits a single wave for both lorazepam and diazepam, with two possible waves seen for flunitrazepam. This latter behaviour possible relates to the two reduction processes previously seen in the cyclic voltammogram shown earlier (Fig. 1). The optimum reduction potential for all three compounds was considered to be −2.45 V.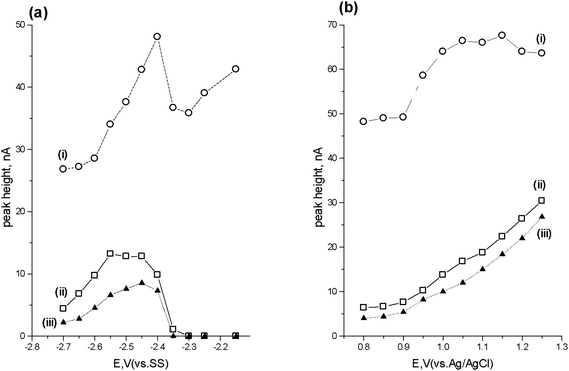 | ||
| Fig. 4 Cathodic (a) and anodic (b) hydrodynamic voltammograms for (i) flunitrazepam, (ii) lorazepam and (iii) diazepam. | ||
Fig. 4b shows the HDV obtained with the generator cell at a potential of −2.45 V and varying the detector cell potential between +0.8 V and +1.25 V. The optimum current response for the detector was considered to occur with a potential of +1.0 V, based on a balance between signal and background current. Consequently, further studies were undertaken using an applied potential of −2.45 V with the generator cell and +1.0 V with the detector cell.
3.4 Calibration plot, limit of detection, and precision
Standard solutions containing lorazepam, flunitrazepam and diazepam, in the concentration range 0.0–1.0 mM, were prepared in mobile phase and examined using the optimized LC-DED procedure. Table 1 summaries the performance characteristics obtained for the three benzodiazepines under the optimised conditions. These performance characteristics were found to be very favourable when compared to that previously reported for reductive mode electrochemical detection of a number of benzodiazepines. In these previous reports detection limits of 300 ng on column21 and 2 μg ml−123 were reported for diazepam. In our present study we have improved on these values and can detect down to 14 ng (Table 1).| Slope, pA ng−1 | R2 | Linear range | Detection limit | |
|---|---|---|---|---|
| Flunitrazepam | 17.01 | 0.9996 | 4 ng–1.6 μg | 2 ng |
| Lorazepam | 0.8053 | 0.9979 | 32.1 ng–4.0 μg | 15 ng |
| Diazepam | 1.029 | 0.9957 | 28.5 ng–3.6 μg | 14 ng |
3.5 Studies of possible interferences
A number of common drugs and components found in human serum were investigated as possible interferences when using the LC-DED method for the three target benzodiazepines. No response was seen for reduced glutathione, urea or aspirin at concentrations of 0.5 mM. Fluoxetine, azathioprine, paracetamol, ascorbic acid and salicylic acid all exhibited oxidative signals. However, azathioprine, paracetamol and ascorbic acid were seen as part of the unretained fraction and hence did not interfere. Both fluoxetine and salicylic acid were found to give well defined peaks at 5.2 and 7.0 min respectively, however, these were both well revolved from that of the target species. It should be mentioned a complicated factor arising with reductive electrochemical mode is the need for complete degassing of both the mobile phase and the sample extracts.21–23 However, all studies in this investigation were undertaken without degassing the mobile phase or degassing of the sample extracts. Consequently, oxygen was not found to interfere when using the newly developed when using the newly developed DED method for compounds I, II and III.3.6 Analytical application
To assess the performance of the LC-DED approach six replicate determinations on bovine serum fortified with the three benzodiazepines was undertaken. Aliquots of the sample were prepared using the procedure described in section 2.5, and quantification was achieved by external calibration. Fig. 5 shows representative chromatograms for bovine serum extracts, for fortified and unadulterated serum. Recoveries and precision obtained for the three benzodiazepines after fortification of the original sample are summarised in Table 2. The results demonstrated the feasibility of using a simple sample preparation procedure in conjunction with LC-DED for the analysis of a biological fluid.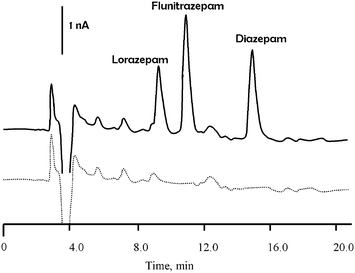 | ||
| Fig. 5 Typical chromatogram obtained in the redox mode for bovine serum extracts. Solid line, fortified with lorazepam (16.0 mg l−1), flunitrazepam (1.60 mg l−1) and diazepam (14.2 mg l−1), dotted line unadulterated. | ||
| Sample | Concentration spiked (mg L−1) | Concentration recovered (mg L−1) | Recovery (%) |
|---|---|---|---|
| a Mean recovery = 101%, %CV = 5.7%. b Mean recovery = 72.3%, %CV = 11%. c Mean recovery = 77.9%, %CV = 5.7%. | |||
| diazepam a | |||
| 1 | 14.2 | 14.9 | 105 |
| 2 | 14.2 | 15.2 | 107 |
| 3 | 14.2 | 15.2 | 107 |
| 4 | 14.2 | 14.2 | 100 |
| 5 | 14.2 | 13.5 | 95.2 |
| 6 | 14.2 | 13.4 | 94.1 |
| flunitrazepam b | |||
| 1 | 1.60 | 1.13 | 70.4 |
| 2 | 1.60 | 1.05 | 65.5 |
| 3 | 1.60 | 1.14 | 71.3 |
| 4 | 1.60 | 1.41 | 88.1 |
| 5 | 1.60 | 1.14 | 71.3 |
| 6 | 1.60 | 1.11 | 69.4 |
| lorazepam c | |||
| 1 | 16.0 | 12.1 | 75.6 |
| 2 | 16.0 | 13.6 | 85.0 |
| 3 | 16.0 | 12.6 | 78.5 |
| 4 | 16.0 | 12.6 | 78.5 |
| 5 | 16.0 | 12.6 | 78.6 |
| 6 | 16.0 | 11.4 | 71.4 |
4. Conclusions
An assay utilising LC-DED in the redox mode has been successfully developed for the determination of flunitrazepam, diazepam and lorazepam using a C18 reversed phase column in conjunction with acetone, phosphate buffer based mobile phase. This approach offers the advantages over that of GC-MS35 allowing for the determination of the thermal unstable lorazepam and has been shown to be more sensitive than reductive mode electrochemical detection. We have demonstrated the possibility of utilising acetone as an organic modifier. This affords several advantages over acetonitrile in terms of both economy and toxicity.36–38 We have shown previously unreported redox behaviour for diazepam, flunitrazepam and lorazepam and have successfully exploited this for their determination in serum by LC-DED.Acknowledgements
We are grateful to the University of the West of England and HEFCE for financial support. Gwen M. Davidson, Emma Brown and Jonathan Toner are thanked for their work with some preliminary studies. Alison McEwen, Paul Bowdler and Mervyn Lewis are thanked for their technical assistance.References
- T. Ohshima, J. Clin. Forensic Med., 2006, 13, 44–45 CrossRef CAS.
- M. Scott-Ham and F. C. Burton, J. Clin. Forensic Med., 2005, 12, 175–186 CrossRef.
- M. M. A. Majumder, A. Basher, M. A. Faiz, U. Kuch, W. Pogoda, G. F. Kauert and S. W. Toennes, Forensic Sci. Int., 2008, 180, 10–16 CrossRef CAS.
- T. Keller, A. Schneider and E. Tutsch-Bauer, Forensic Sci. Int., 2000, 109, 159–166 CrossRef CAS.
- V. Calisto and V. I. Esteves, Chemosphere, 2009, 77, 1257–1274 CrossRef CAS.
- A. C. Collier, EcoHealth, 2007, 4, 164–171 CrossRef.
- D. Pascoe, W. Karntanut and C. T. Müller, Chemosphere, 2003, 51, 521–528 CrossRef CAS.
- P. Fernandez, C. Vazquez, R. A. Lorenzo, A. M. Carro and A. M. Bermejo, Anal. Lett., 2010, 43, 1075–1084 CrossRef CAS.
- H. He, C. Sun, X.-R. Wang, C. Pham-Huy, N. Chikhi-Chorfi, H. Galons, M. Thevenin, J.-R. Claude and J.-M. Warnet, J. Chromatogr., B: Anal. Technol. Biomed. Life Sci., 2005, 814, 385–391 CrossRef CAS.
- V. F. Samanidou, A. P. Pechlivanidou and I. N. Papadoyannis, J. Sep. Sci., 2007, 30, 679–687 CrossRef CAS.
- S. J. Salamone (ed) Benzodiazepines and GHB, Detection and Pharmacology; Humana Press: NJ. 2002 Search PubMed.
- J. R. Joyce, T. S. Bal, R. E. Ardrey, H. M. Stevens and A. C. Moffat, Biol. Mass Spectrom., 1984, 11, 284–289 CrossRef CAS.
- S. Borman, Acetonitrile Shortage Hurts Research Laboratories, Chem. Eng. News, 1990, 68, 15 Search PubMed.
- A. Tullo, A Solvent Dries Up, Chem. Eng. News, 2008, 86, 27 Search PubMed.
- T. R. Keppel, M. E. Jacques and D. D. Weis, Rapid Commun. Mass Spectrom., 2010, 24, 6–10 CrossRef CAS.
- R. Fritz, W. Ruth and U. Kragl, Rapid Commun. Mass Spectrom., 2009, 23, 2139–2145 CrossRef CAS.
- K. C. Honeychurch and J. P. Hart, Electroanalysis, 2007, 19, 2176–2184 CrossRef CAS.
- G. N. Jham, R. Velikova, B. Nikolova-Damyavova, S. C. Rabelo, J. C. T. da Silva, K. A. P. Souza, V. M. M. Valente and P. R. Cecon, Food Res. Int., 2005, 38, 121–126 CrossRef CAS.
- S. C. Cunha and M. B. P. P. Oliveira, Food Chem., 2006, 95, 518–524 CrossRef CAS.
- E. J. Caliguri and I. N. Mefford, Brain Res., 1984, 296, 156–159 CrossRef CAS.
- W. Lund, M. Hannisdal and T. Greibrokk, J. Chromatogr., A, 1979, 173, 249–261 CrossRef CAS.
- M. Wilhelm, H.-J. Battista and D. Obendorf, J. Chromatograph. A, 2000, 897, 215–225 CrossRef CAS.
- I. Martins, L.d.S. Canaes, K. M. Doretto and S. Rath, Electroanalysis, 2010, 22, 455–462 CrossRef CAS.
- K. C. Honeychurch and J. P. Hart, J. Solid State Electr., 2008, 12, 1317–1324 CrossRef CAS.
- K. C. Honeychurch, G. C. Smith and J. P. Hart, Anal. Chem., 2006, 78, 416–423 CrossRef CAS.
- W. F. Smyth and A. lvaska, Analyst, 1985, 110, 1377–1379 RSC.
- W. F. Smyth, J. S. Burmicz and A. lvaska, Analyst, 1985, 107, 1019–1025 RSC.
- M. E. Lozano-Chaves, J. M. Palacios-Santander, L. M. Cubillana-Aguilera, I. Naranjo-Rodríguez and J. L. Hidalgo-Hidalgo-de-Cisneros, Sens. Actuator B-Chem., 2006, 115, 575–583 CrossRef.
- N. Nagappa, T. Mimani, B. Sheshadri and S. M. G. Mayanna, Chem. Pharm. Bull., 1998, 46, 715–717 CAS.
- A. E. M. I. Mohamed, Talanta, 1998, 46, 951–959 CrossRef CAS.
- J. H. Wahi, C. D. Bolz and K. L. Wahi, LC/GC, 2010, 23, 188–199 Search PubMed.
- W. F. Smyth, Voltammetric Determination of Molecules of Biological Significance; Wiley: Chichester. 1992 Search PubMed.
- J. A. Goldsmith, J. Jenkins, J. Grant and W. F. Smyth, Anal. Chim. Acta, 1973, 66, 427–434 CrossRef CAS.
- B. Maupas and M. B. Fleury, Electrochim. Acta, 1982, 27, 141–147 CrossRef CAS.
- M. Acikkol, S. Mercan and S. Karadayi, Chromatographia, 2009, 70, 1295–1298 CAS.
- International Programme on Chemical Safety ( 1993), Environmental Health Criteria 154. Acetonitrile, Geneva: World Health Organization, http://www.inchem.org/documents/ehc/ehc/ehc154.htm Search PubMed.
- C. Capello, U. Fischer and K. Hungerbuhler, Green Chem., 2007, 9, 927–934 RSC.
- Twenty-Fifth Commission Directive 2000/11/EC of 10 March 2000 adapting to technical progress Annex II to Council Directive 76/768/EEC on the approximation of laws of the Member States relating to cosmetic products. OJEC L65 of 2000-03-14, pp. 22–25.
Footnotes |
| † This article is part of a web theme in Analyst and Analytical Methods on Future Electroanalytical Developments, highlighting important developments and novel applications. Also in this theme is work presented at the Eirelec 2011 meeting, dedicated to Professor Malcolm Smyth on the occasion of his 60th birthday. |
| ‡ Presented at Electrochem 2010: Electrochemistry and Sustainability, University of Wolverhampton, Telford, UK, 14th–15th September 2010. |
| This journal is © The Royal Society of Chemistry 2012 |

