A novel enzymatic technique for determination of sarcosine in urine samples
Casey
Burton
,
Sanjeewa
Gamagedara
and
Yinfa
Ma
*
Department of Chemistry and Environmental Research Center, Missouri University of Science and Technology, Rolla, MO 65409, USA. E-mail: yinfa@mst.edu; Fax: +1 573-341-6033; Tel: +1 573-341-6220
First published on 5th December 2011
Abstract
Metabolites impart a significant importance to the understanding of biological reactions and consequently to the development of diagnostic and therapeutic techniques for specific diseases. Furthermore, there has been recent interest in metabolite concentrations present in urine for potential noninvasive disease diagnosis. The detection of specific metabolites, however, presents certain analytical difficulties such as low or ambiguous specificity of the techniques. This study developed a new technique, utilizing oxidative, enzymatic production of formaldehyde from the metabolite to produce a pH-induced change observed by fluorescein in acetone. This probe displays high sensitivity towards pH imbalances and, coupled with high enzymatic specificity, forms an accurate method to measure metabolite concentrations. Sarcosine was used as a model analyte in this study due to its potential for serving as a prostate cancer biomarker. Sarcosine was treated with sarcosine oxidase to generate formaldehyde, which was further oxidized to formic acid, and subsequently measured by the corresponding change in fluorescein. A good linearity was revealed with a correlation coefficient of 0.9961 and a detection limit of 20 nmol L−1. This method was applied to sarcosine analysis in nine urine samples. The results suggest that this is a viable, cost-effective technique for determination of sarcosine in urine samples without interferences such as alanine.
1. Introduction
1.1. Background
Tests for prostate-specific antigen (PSA), a common marker for prostate cancer diagnostics, cannot accurately differentiate between benign prostate conditions and active prostate cancer.1 This well-practiced technique, which relies upon an abnormally high presence of the antigen in serum, thought to be correlated with increased prostate gland size, is also well-known for being both false positive and negative prone.2 It has further been shown that the mortality rate does not significantly improve with PSA screening.3 This lack of sufficient diagnostic techniques for prostate cancer highlights the need for more effective screening methods.Whereas many diagnostic techniques rely on the presence of antigens, like PSA, metabolites can serve an equally important diagnostic role. Indeed, metabolites, as the intermediates and products of metabolic exchanges, have an intimate relationship with systemic changes in an organism. An important implication of this is that of carcinogenesis; while cancer has been traditionally seen in terms of gene regulation, affecting control and signal processes, disjoint from metabolites, it is becoming increasingly apparent that metabolites operate as key functions in the development of several types of cancer through numerous mechanisms, such as modulating various signal transduction systems.4
Effective analysis and quantification of such metabolites in applicable media may then characterize the progression of certain cancers when practical difficulties would otherwise exist.5,6 An example of this concept, applied to prostate cancer, was utilized in an attempted metabolomic profiling of biopsy-positive prostate cancer patients and biopsy-negative prostate control individuals that suggested a correlation between sarcosine levels and progression of the disease.7 This finding brought about great interest in determining sarcosine in various media, and although the correlation between sarcosine and prostate cancer has since been refuted,8,9 it adds stress to the importance of metabolites, such as sarcosine, as novel markers for cancer diagnostics.
Analytical methods for direct determination of metabolites from cells, plasma, or urine often include a combination of liquid chromatography and gas chromatography with mass spectroscopy. However, the major disadvantages of these techniques are high instrumentation costs and the interferences from other chemicals; for example, in the case of sarcosine, alanine has exactly the same mass as sarcosine and often co-elutes with it, traditionally complicating normal chromatographic techniques.10 Although chromatographic techniques have been reported to fully separate alanine and sarcosine,11,12 these techniques require instrumentation not generally available to clinics. Substrate-specific enzymes, however, have shown to be useful analytical reagents.13,14 One class in particular is the oxidoreductases, which often produce reactive oxygen species (ROS), such as peroxidase and hydrogen peroxide, respectively, being first reported in 1846.15 In the case of sarcosine, sarcosine oxidase serves as a catalyst in the oxidative demethylation of sarcosine, an intermediate metabolite, to glycine, formaldehyde, and hydrogen peroxide. Direct determination of sarcosine can be difficult, but indirect quantification can be achieved by this reaction. Indeed, an established analytical assay for sarcosine includes the sarcosine oxidase-mediated demethylation of sarcosine to hydrogen peroxide, which reacts with 4-aminoantipyrine and phenol to yield quinoneimine dye (Scheme 1).16 The disadvantage is that such colorimetric analyses can be skewed in complex matrices like urine and blood.
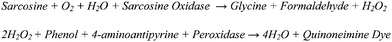 | ||
| Scheme 1 Colorimetric assay of sarcosinevia production of quinoneimine dye. | ||
A proposed solution to this skewing is the fluorimetric determination of sarcosine. One particular subset of fluorescein derivatives, including the commonly used 2′,7′-dichlorofluorescein diacetate (DCFH-DA), is currently being recognized for its high specificity to reactive oxygen species. Many of these compounds have reported detection limits in the nanomolar concentration range, providing useful probes for oxidative stress in cellular systems.17–20 Their premise was based upon the theory that non-fluorescent fluorescein derivatives will fluoresce upon oxidation by hydrogen peroxide and other ROS, and that this fluorescence is directly proportional to the concentration of ROS present.21
Indeed, this subset of fluorescein derivatives is growing everyday, and the specialized probes cited above formed the original basis of the proposed method for their relative structural and synthetic simplicity to newer compounds. Although this type of probe has the capability to indirectly quantify sarcosine by production of hydrogen peroxideviasarcosine oxidase, there exist several limitations: (1) as fluorescein derivatives, they are highly sensitive to pH changes and (2) hydrogen peroxide decomposition needs to follow a radical pathway. Under optimal conditions, the oxidation of sarcosine is significantly favorable to the further oxidation of formaldehyde to formic acid. The associated pH change from this was found to be more significant than that from oxidation of fluorescein by radicals formed by hydrogen peroxide decomposition. In addition to this, the basic conditions under which sarcosine oxidation occurs seemed to have favored the decomposition of hydrogen peroxide into water and oxygen gas, not radicals. Furthermore, synthetic preparation of these specialized fluorescein derivatives is often complex, and the direct purchase is expensive, when compared with pure fluorescein. In this study, a novel and low cost enzymatic technique has been developed for determination of sarcosine in urine samples, not by measuring ROS formed from hydrogen peroxide decomposition, but by the pH change associated with formaldehyde being oxidized to formic acid.
1.2. Reaction mechanism
The developed method relies simply on the pH sensitivity of ordinary fluorescein. Under acidic conditions (pH < 4), the non-fluorescent lactone form of fluorescein exists in high concentrations. When prepared in acetone, it is nearly the only form present and is furthermore readily soluble. Upon exposure to a basic reagent, lactoid fluorescein will readily change to the highly fluorescent monoanionic and dianionic forms. Thus, changes in the pH of a standard reagent can be quantitatively determined by the lactoid fluorescein, even with low concentrations and/or volumes. For the determination of sarcosine, this can be achieved by an enzymatic oxidation of sarcosine to glycine, resulting in hydrogen peroxide and formaldehyde as byproducts, and subsequent oxidation of formaldehyde to formic acid and methanol (Scheme 2). In the presence of NaOH and heat, the Cannizzaro reaction proceeds converting the formaldehyde to formic acid and methanol while degrading the hydrogen peroxide without forming interfering radicals. The conditions of the Cannizzaro reaction catalyze the decomposition of hydrogen peroxide to water and oxygen gas with minimal ROS being formed. The resultant decrease in pH from the formic acid results in a quantifiable deviation from the standardized pH of the solution without interference from radicals from hydrogen peroxide. In this way, the coupling of an enzyme and ordinary fluorescein provides two advantages: (1) high specificity for sarcosine and (2) a relatively cost-effective alternative to current methods such as DCFH-DA and liquid chromatography tandem mass spectrometry (LC-MS/MS).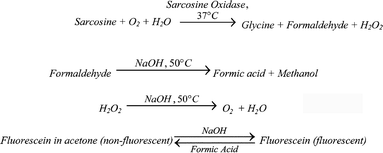 | ||
| Scheme 2 Proposed method for the determination of sarcosine. | ||
The combination of the two steps, substrate-specific enzymatic production of formaldehyde followed by conversion to formic acid coupled with subsequent fluorimetric analysis by fluorescein, supplies an effective, indirect, analytical technique for metabolite-specific determinations without interference from ROS. This idea was demonstrated by the determination of sarcosine in urine and further comparison to the same samples being analyzed using LC-MS/MS methods9 where alanine is presumed to be an interference.
2. Experimental
2.1. Preparation of sarcosine oxidase
Sarcosine oxidase from Corynebacterium sp. (lyophilized powder, 5–10 units mg−1) was purchased from Sigma-Aldrich (Saint Louis, MO, USA). A 20 mmol L−1potassium phosphate solution was prepared from ultra-pure water and potassium phosphate monobasic, and the pH was adjusted to 8.3 with 1 mol L−1sodium hydroxide. To 1 mL of buffer was added 0.7 mg of enzyme. The reagent was prepared fresh and chilled at 4 degree Celsius.2.2. Preparation of sarcosine stock solution
The sarcosine and Tris–HCl buffer used in this study were purchased from Sigma-Aldrich (Saint Louis, MO, USA). Ultra-pure water was generated using a Milli-Q Advantage A10 water purification system, 18 MΩ (Millipore, Billerica, MA, USA). A 200 mmol L−1 Tris–HCl buffer was prepared with ultra-pure water and Tris base, and the resulting pH was adjusted to 8.3 with NaOH. This represented the optimal pH of sarcosine oxidase and fluorescein. A stock of 2.5 μmol L−1sarcosine solution was prepared in the buffer.2.3. Analysis of sarcosine standard solutions
Into a 250 μL Corning Costar 96 flat bottom plate were added insertions of the sarcosine stock solution. These insertions were based on the sarcosine concentration range (200–1400 nmol L−1) reported by LC-MS/MS analysis of urine samples diluted 750 times. This insertion was supplemented with enough Tris–HCl buffer to make 75 μL. The plate was then heated to 37 °C. To this was added 25 μL cold enzyme reagent, and the plate was then incubated at 37 °C for 30 minutes. Upon incubation, the plate was chilled to room temperature, 5 μL 500 mmol L−1NaOH inserted, and re-incubated at 50 °C for 10 minutes to ensure complete formation of formic acid. The plate was then cooled to room temperature again, and fluorescence readings were taken. Upon which 5 μL 15 nmol L−1fluorescein dissolved in acetone was added, resulting in a total volume of 110 μL per sample. The plate was then shaken in double orbital fashion for two minutes and analyzed two hours later.2.4. Analysis of urine samples
Urine samples (n = 10) were provided by the Central Missouri Urology Clinic. The set was comprised of five normal samples and five prostate cancer positive samples. Prior to subjection to the method outlined in this study, the samples were analyzed vialiquid chromatography with tandem mass spectroscopy.9 The supernatants of the samples were then properly diluted in buffer solution whereby 75 μL was inserted into the well plate. The procedure then followed that of the sarcosine standards.2.5. LC-MS/MS analysis
A phenyl–hexyl, 3.0 μm, 3.0 × 150 mm column (Phenomenex, USA) and an Agilent 1100 series LC system (Santa Clara, CA) were used for the separation of sarcosine. LC was performed at 25 °C under a flow rate of 250 μL min−1 using a gradient system with the mobile phase consisting of A: 0.1% formic acid in water and B: 0.1% formic acid in acetonitrile (100%). The gradient program was: initial 98% A and 2% B; linear gradient to 60% A and 40% B in 5 min; return to initial conditions in 0.1 min at a flow rate of 250 μL min−1, followed by equilibration for 10 min. Run-to-run time was 15 min. The sample injection volume was 10 μL. An API 4000Q trap MS/MS system (Applied Biosystems, Foster City, CA) was used for the quantification of sarcosine in urine samples. Sarcosine was detected in multiple-reaction monitoring mode (m/z 89.9/44) with ESI-positive ionization.2.6. Fluorimetric instrumentation
Fluorescence emission spectra were obtained with a BMG Labtech Fluorstar Omega (Ortenberg, Germany) plate reader equipped with a xenon lamp. Excitation and emission wavelengths were attuned to 485 nm and 520 nm, respectively. The lamp was allowed sufficient time to warm prior to measurement. Data were collected and analyzed via BMG Omega software.3. Results and discussion
3.1. Spectral properties
It is well observed that fluorescein can exist in several forms: the highly fluorescent dianion form, the moderately fluorescent monoanion form, and three neutral tautomers: the quinoid, lactone, and zwitterionic. Furthermore, fluorescein is highly sensitive to both pH and solution, and the proportion of the forms present is consequently dependent upon those as well. The colorless, nonfluorescent lactone form has the greatest proportion (>99%) under acidic conditions (pH < 4.3), while the highly fluorescent dianion form is found best in pH conditions greater than 6.37.22 Dissolution in acetone, however, achieves an equally high proportionality of the lactone form while providing a relatively acidic environment (pH = 6.1) similar to that of urine. Therefore, addition of base raises the concentration of the fluorescent forms to the optimal conditions of fluorescein (pH = 8.3). Fig. 1 illustrates the changes between fluorescein in acetone and in buffered solution.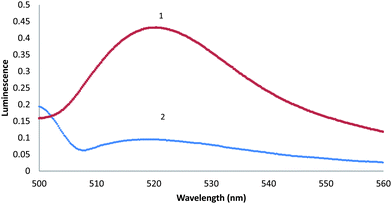 | ||
| Fig. 1 Emission spectra of 300 μmol L−1fluorescein in acetone (pH = 6.1) (1) and in buffer solution (pH = 8.3) (2) at 25 °C. | ||
3.2. Linearity, detection limits, and reproducibility
Sarcosine standard solutions were incubated with sarcosine oxidase under basic conditions to generate formic acid in order to produce a measureable pH change. A stable calibration curve (Fig. 2) was obtained from a set of sarcosine standards ranging from 23 nmol L−1 to 1704 nmol L−1. A fairly linear relationship was observed over this range with a correlation coefficient of 0.9961. The limit of detection was determined to be 20 nmol L−1 with a signal-to-noise (S/N) ratio of 3. Reproducibility was measured (n = 5), yielding a standard error of 4.2%. Based on these data, it was concluded that this technique is applicable over the given concentration range.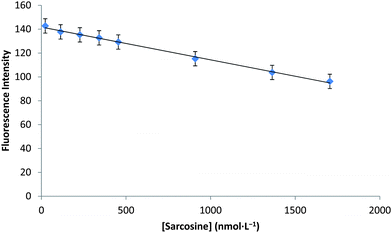 | ||
| Fig. 2 Calibration plot constructed from sarcosine standards ranging from 23 to 1704 nmol L−1. Correlation coefficient (R2) is 0.9961, and the standard error is 4.2% for 3 datasets. | ||
3.3. Determination of sarcosine from urine
Ten urine samples were analyzed vialiquid chromatography with tandem mass spectroscopy (with known interferences from alanine) and via the proposed fluorimetric determination of sarcosine. Analyte concentrations were compared for the undiluted urine samples, with the comparisons shown below (Table 1). Three preparations of each sample were prepared to provide validating statistical significance. Consequently an acceptable degree of reproducibility was established. All samples fell within the calibrated range except for one which initially yielded an undetectable amount of sarcosine. Similarly this sample produced a significantly low value by LC-MS/MS techniques as well. This zero value may be credited to the relatively high limit of detection (20 nmol L−1) of the fluorimetric method compared with that of LC-MS/MS (0.6 nmol L−1). In order to supply a non-zero value, the urine sample was diluted less until a detectable signal was achieved, and the base urine concentration was subsequently calculated. In addition to this, one sample was reported to have a 43% increase over the LC-MS/MS technique. This anomaly is most likely explained by the presence of a smudge on the well into which the urine sample was injected or residual sediment in the urine sample. Nonetheless, the data suggest the fluorimetric method generally produces lower sarcosine concentrations than the LC-MS/MS technique. This is expected because the LC-MS/MS technique utilized provides only a partial, if any, separation of alanine and sarcosine whereas the fluorimetric method, due to its enzymatic nature, displays a much higher specificity for sarcosine.| LC-MS/MS/mmol L−1 | Fluorimetric/mmol L−1 | Percent difference |
|---|---|---|
| 342.53 | 320.18 ± 10.13 | −6.53 |
| 278.50 | 251.22 ± 6.54 | −9.80 |
| 695.90 | 545.84 ± 22.43 | −21.56 |
| 195.92 | 201.15 ± 4.33 | 2.67 |
| 1061.19 | 572.39 ± 32.11 | −46.06 |
| 136.68 | 195.45 ± 4.99 | 43.00 |
| 268.33 | 248.28 ± 12.15 | −7.47 |
| 185.71 | 136.37 ± 7.36 | −26.57 |
| 333.45 | 315.78 ± 4.23 | −5.30 |
| 149.89 | 45.82 ± 4.97 | −69.43 |
Although a general decrease, via the fluorimetric method, in sarcosine concentrations has been observed, compared with the LC-MS/MS method, the decrease is not statistically significant (p = 0.23, paired t-test). This insignificance is actually expected; LC-MS/MS is a very precise analytical tool, much more so than fluorimetry. Despite its insignificance, the general decrease can reasonably be attributed to the utilization of the enzyme. The fluorimetric assay consisted of two general types of interferences: non-enzymatic oxidation of fluorescein, and inhibitors and substitutive substrates of sarcosine oxidase. The former, including urine acidity and oxidative components, was neglected due to the 750-fold dilution of the urine in 200 mmol L−1 Tris–HCl buffer. These buffered urine solutions were observed to have an equivalent pH as the sarcosine standards. Furthermore, it was found that the average pH of the unbuffered urine samples varied only slightly from that of unbuffered sarcosine. Since the change in fluorescence, not the final fluorescence, was used to determine sarcosine, the very minor deviations in buffered urine pH were negated. The employment of a strong buffer in very dilute samples also increases the application of the assay to other biological fluids, because the buffering capacities of the above said fluids can also be negated when compared with that of the strong buffer. Although inhibitors to sarcosine oxidase (including many inorganics) are likely present in urine to a small extent, sarcosine oxidase was provided in excess to the estimated sarcosine to counter this fact. However, one key substitutive substrate was present: D-alanine. It is speculated that D-alanine, which is present in urine in significant amounts, may interfere viaoxidation by sarcosine oxidase to yield additional formaldehyde or a keto acid, thereby producing a pH change unrelated to sarcosine. To assess the impact of its interference, D-alanine standard was compared with D-alanine treated with sarcosine oxidase under similar conditions using LC-MS/MS. An insignificant percentage (0.34%) of D-alanine was found to be degraded by sarcosine oxidase. This low degradation can even be attributed to the inter-run variation among LC-MS/MS samples. This determination corroborates previously reported numbers. Thus by eliminating possible interferences, it can reasonably conclude that the general decrease observed by the fluorimetric method can be attributed to the use of sarcosine oxidase.
A comparison plot of the two methods is shown below (Fig. 3). It is evident that the rate of change reported by the fluorimetric assay is much more pronounced as sarcosine concentrations decrease, compared with that of the LC-MS/MS method, implying increased relative sensitivity of the fluorimetric method to lower concentrations of sarcosine. This is reasonable: prior to fluorescein exposure, the pH of the sample was significantly above the pKa of the buffer (pKa = 8.06). Thus, as the sample pH approached the pKa of the buffer by production of formic acid, the buffering capacity was increased, explaining why lower sarcosine concentrations experienced a greater respective change in fluorescence than higher concentrations. This certainly presents a limitation to the fluorimetric assay described herein, but also implies an enhanced sensitivity to sarcosine concentrations near the lower limit of quantitation. This increased sensitivity means that urine samples should be diluted as necessary in order to achieve the highest accuracy possible.
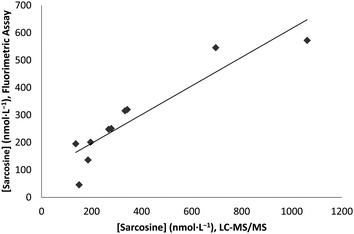 | ||
| Fig. 3 Comparison plot of the fluorimetric and LC-MS/MS techniques used to analyze sarcosine concentrations in 10 urine samples. Correlation coefficient (R2) is 0.8466. | ||
Furthermore, sarcosine levels, as well as any other metabolite, can vary greatly among urine samples due to a large array of factors such as fluid intake, prevalent diseases, diet, and more. Thus for clinical purposes, sarcosine alone cannot be used as a marker. As such, a ratio of sarcosine levels to creatinine,23 analyzed with LC-MS/MS acting as a normalization factor, was constructed. Although creatinine was not determined using the fluorimetric method, there are a host of quantitative methods for creatinine, and furthermore, creatinine may also be determined by the fluorimetric assay by converting it to creatine with creatinine amidohydrolase, and subsequent conversion to sarcosine by creatine amidinohydrolase. This ratio can be used for cancer comparisons, and although diagnostic comparisons between cancer positive and cancer negative samples were outside the scope of this current study, these data were readily available and further illustrate that this simple fluorimetric method can be applied to diagnostic purposes (as shown in Fig. 4).
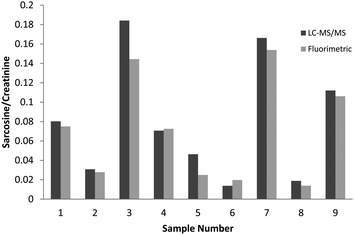 | ||
| Fig. 4 Comparison of sarcosine-to-creatinine ratio for LC-MS/MS and fluorimetric methods. Samples one through five are prostate cancer positive and samples six through 9 are prostate cancer negative. Sample ten is not shown due to null value. | ||
3.4. Recovery
Spiked recovery tests were conducted utilizing three different sarcosine concentrations. Sarcosine was added to the same urine sample prior to dilution in the following doses: 20 mmol L−1, 100 mmol L−1, and 500 mmol L−1. Analyte recovery in the low concentration was 86.45%, while recovery in the middle concentration was 106.32%, and recovery in the high concentration was 102.45%.4. Conclusion
This study aimed to present a novel fluorimetric technique for determination of sarcosine in urine by enzymatic production of formic acid to produce a pH change subsequently measured by fluorescence change of fluorescein. The utilization of the highly specific sarcosine oxidase has eliminated interferences caused by the presence of alanine, at least to a further extent than the LC-MS/MS technique used alongside the fluorimetric method. Although sarcosine has been successively separated in other LC-MS/MS techniques, the concept of a fluorimetric method provides a much more economical determination of sarcosine than these more advanced chromatographic techniques. The methodology presented here can further be applied to a large array of analytes which can act as substrates to enzymes, especially to oxidases. For example, D-amino acid oxidases (DAOs) act on a similar mechanism as sarcosine oxidase, producing a keto acid, and ammonia and hydrogen peroxide as byproducts. In this case, the keto acid may be evaluated directly very similarly to the one described here. Even though the sensitivity of this technique is lower than that of the LC-MS/MS method, it provided a fast and low cost technique for sarcosine analysis. The real novelty of the study is the coupling of the highly specific enzymatic approach with the economical fluorimetric analysis to provide an alternative technique for sarcosine analysis in complex matrices, such as urine; thus, the basis of a quick, accurate, and cheap clinical diagnostic tool has been established.Acknowledgements
This research work was supported by Opportunities for Undergraduate Research, Environmental Research Center, and Department of Chemistry at Missouri University of Science and Technology. Furthermore, this research could have not been conducted without help from the following individuals: Dr Prakash Reddy for thoughtful discussion and advice towards method development and Dr Robert Aronstam and his cDNA lab personnel for use of their plate reader.References
- D. S. Smith, P. A. Humphrey and W. J. Catalona, Cancer, 1997, 80(9), 1853–1856 CrossRef.
- I. Thompson, D. Pauler, P. Goodman, C. Tangen, M. Lucia, H. Parnes, L. Minasian, L. Ford, S. Lippman, E. Crawford, J. Crowley and C. Coltman, N. Engl. J. Med., 2004, 350(22), 2239–2246 CrossRef CAS.
- G. Andriole, R. Grubb and S. Buys, N. Engl. J. Med., 2009, 360(13), 1310 CrossRef CAS.
- A. K. Arakaki, R. Mezencev and N. J. Bowen, Mol. Cancer, 2008, 7, 57 CrossRef.
- C. Abate-Shen and M. Shen, Genes Dev., 2000, 14, 2410–2434 CrossRef CAS.
- E. Ruijter, et al. , Endocr. Rev., 1999, 20, 22–45 CrossRef CAS.
- A. Sreekumar, L. Poisson, T. Rajendiran, A. Khan, Q. Cao, J. Yu and A. Chinnaiyan, Nature, 2009, 457, 910–914 CrossRef CAS.
- E. A. Struys, A. C. Heijboer and J. Moorselaar, Ann. Clin. Biochem., 2010, 47, 282 CrossRef.
- F. Jentzmik, C. Stephan, K. Miller, M. Schrader, A. Erbersdobler, G. Kristiansen and K. Jung, Eur. Urol., 2010, 58, 12–18 CrossRef CAS.
- Y. Jiang, E. Schwiers, X. Cheng, C. Wang and Y. Ma, Anal. Chem., 2010, 82(21), 9022–9027 CrossRef CAS.
- T. Meyer, S. Fox, H. Issaq, X. Xu, L. Chu, T. Veenstra and A. Hsing, Anal. Chem., 2011, 83(14), 5735–5740 CrossRef CAS.
- P. Martinez-Lozano and J. Rus, J. Am. Soc. Mass Spectrom., 2010, 21, 1129–1132 CrossRef CAS.
- H. Stetter, Enzymatische Analyse, 1951 Search PubMed.
- T. S. Lee, Organic Analysis, 1954, 2, 242 Search PubMed.
- G. Osann, Ann. Phys. Chem., 1846, 67, 372–374 CrossRef.
- T. Kinoshita and Y. Hiraga, Chem. Pharm. Bull., 1980, 28, 350 Search PubMed.
- K. Xu, B. Tang and H. Huang, Chem. Commun., 2005, 5974–5976 RSC.
- H. Wong and J. A. Joseph, Free Radical Biol. Med., 1999, 27, 612–616 CrossRef.
- K. Xu, X. Liu and B. Tang, ChemBioChem, 2007, 8, 453–458 CrossRef CAS.
- A. S. Keston and R. Brandt, Anal. Biochem., 1965, 11, 1–5 CrossRef CAS.
- C. P. LeBel, H. Ishiropoulos and S. C. Bondy, Chem. Res. Toxicol., 1992, 5, 227–231 CrossRef CAS.
- A. Cook and A. Le, J. Phys. Chem., 2006, 10, 44–49 Search PubMed.
- S. Gamagedara, S. Gibbons and Y. Ma, Clin. Chim. Acta, 2011, 412, 120–128 CrossRef CAS.
| This journal is © The Royal Society of Chemistry 2012 |