Micro-determination of arsenic in aqueous samples by image scanning and computational quantification
Muhammad
Salman
*,
Makshoof
Athar
,
Waheed-uz-Zaman
,
Umer
Shafique
,
Jamil
Anwar
,
Rabia
Rehman
,
Sadia
Ameer
and
Muhammad
Azeem
Institute of Chemistry, University of the Punjab, Lahore, 54590, Pakistan. E-mail: salmans_rajpoot@yahoo.com
First published on 13th December 2011
Abstract
Arsenic is highly toxic in all of its forms found in natural groundwater. An improved method for the estimation of inorganic arsenic at low levels (μg L−1) in water has been proposed. The method involves the generation of arsine in a specially designed cell by borohydride reduction of arsenite (AsO21−). The resulting arsine is passed through a filter paper pre-dipped in mercuric bromide solution giving a yellowish brown complex. The color intensity of the spots is calculated by scanning the spotted paper and analyzing the image using specially designed software. The method was found to be effective at trace levels having a linear response at the concentration range 2–20μg L−1 (8–80ng). The detection limit of the proposed method is 1 μg L−1 (4 ng) which can be reduced further by making some modifications to the apparatus. The method was successfully applied to the analysis of synthetic samples and field samples of water.
Introduction
Arsenic occurs in nature in both inorganic and organic forms and the contamination of drinking water by arsenic is a worldwide problem. The main sources of arsenic in water are geochemical materials which release arsenic under geochemical conditions naturally.1 The permissible arsenic level in drinking water and as designated by the U.S. Environmental Protection Agency and the World Health Organization is 10 ppb (0.01 ppm).2 Thus, the arsenic content in industrial raw materials, product effluents as well as in drinking water supplies should be monitored with precision and reproducibility.3Several analytical techniques have been employed for arsenic determination at low levels. Most of the employed techniques involve sophisticated/expensive techniques like Atomic Absorption Spectrometry (AAS),4,5Inductively Coupled Plasma-Optical Emission Spectroscopy (ICP-OES),6UV/VIS Spectrometry,7–10HPLC11etc. Some other techniques which are not common in routine analysis have also been employed for arsenic determination at very low levels. These include amperometry,12neutron activation analysis,13voltammetry,14,15 X-ray fluorescence16etc.
Another analytical technique which has been employed for arsenic determination at microlevels is the spot test, a well known Gutzeit Method. It includes the complex formation of arsine generated from arsenic containing solution with mercuric bromide. The advantage of this technique is the elimination of expensive instruments and that it can be employed in kit form for the analysis of arsenic. Moreover, the method is sensitive, rapid and easy to perform.17,18 The major drawback is that the measurement of the colored complex involves the naked eye which leads to poor repeatability and a considerable determination error of 20–35%. Efforts are being made to make this method reproducible and precise.19
The aim of this work is a contribution towards these efforts. In this work a modified apparatus has been suggested for arsine generation and spot fixation. Moreover, the densities of the spots were measured using a flatbed scanner connected to a computer having specially developed software. The method presented is simple, portable, economical, accurate, and easy to use in field research.
Experimental
Reagents and apparatus
Sodium arsenite (East Anglia Chemicals), mercuric bromide (Fluka), sodium borohydride (Acros) and HCl (Merck) were used in the study. Watman filter paper No. 42 was used to prepare the reagent paper and a UV/Vis Spectrometer (Labomed UVD-3500) was employed to quantify arsenic by the conventional method. A reflective flatbed scanner (BENQ 5000 L) was used for image scanning in the proposed method.Stock solution of arsenic
A stock solution of arsenic (1000 mg L−1) was prepared by dissolving an appropriate quantity of extra pure sodium arsenite (NaAsO2). Standard solutions of required concentrations (2–20μg L−1) were prepared by successive dilution of this stock solution.Preparation of reagent paper
Watman filter paper No. 42 was dried to remove moisture and then soaked in the solution of mercuric bromide in a petri dish for 15 mins. After soaking it was then dried and used for arsenic quantification. Lead acetate paper was also prepared in the same fashion.Color density measurement
A reflective flatbed color scanner (BENQ 5000 L) was used to acquire the spot images. A ‘Visual Basic’ graphical application, specially developed for this purpose, was then used to calculate the cumulative color density of a predefined circular area of the spot. A fixed area was analyzed each time during the run.Assembly for arsine (AsH3) generation and spot fixing
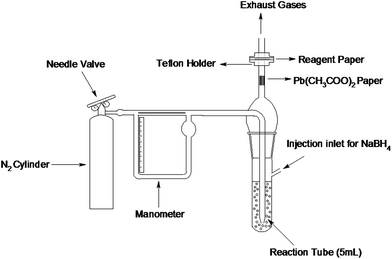
A schematic hydride generation assembly was fabricated that can convert soluble arsenic to volatile arsine (AsH3) and can guide the liberating arsine to pass through a reagent paper. The hydride generation assembly is shown in Fig. 1. The assembly consists of a pyrex glass tube having a capacity of 8 mL. The reaction tube has an acid inlet covered with a self sealing rubber stopper and an outlet for the guidance of arsine. The reaction tube is also fitted with a gas bubbler through which nitrogen gas can be bubbled in the reaction mixture in order to complete the removal of arsine from the mixture and to avoid stirring. The outlet of the reaction tube is passed through a teflon holder containing a reagent paper designed especially for this purpose. The holder was designed in such a way that the liberated arsine passes only through the center of the paper and the spots produced are of equal size every time. To avoid any leakage of the gas, rubber O-rings were screwed tightly to the outlet of the reaction tube and also within the holder. A needle valve flow controller was used to maintain a uniform flow of nitrogen and a glass manometer was used to measure the pressure of the nitrogen. | ||
| Fig. 1 Assembly of arsine generation and spot fixation. | ||
The same assembly can be used for samples having extremely low concentrations of arsenic in large volumes, just by replacing reaction tube with a round bottomed septum flask (100–250 mL).
Methodology
To start, 4 mL of arsenic standard solution (2 μg L−1; 8 ng As) was added to the reaction tube followed by the addition of hydrochloric acid (5 M, 2 mL). The assembly was then sealed as shown in Fig. 3.1. Nitrogen gas was then turned on to ensure the proper mixing of the solution components. 2 mL of sodium borohydride (5%) was injected drop wise through an injection branula no. 18 equipped with an injection syringe. As soon as sodium borohydride entered the reaction mixture arsine gas was liberated, this passed through the outlet which was equipped with a teflon holder containing reagent paper. The reagent paper was prepared by impregnating the circular disc (2 cm diameter) of Whatman filter paper No. 42 with freshly prepared mercuric bromide solution (2%) and then drying. A simple filter paper formerly dipped in lead acetate solution was placed between the passage of arsine and the reagent paper in order to eliminate any sulfide interference. A brownish yellow colored spot appeared on the paper. The reaction was continued for 3–5 min for complete liberation of arsine. The color density of the spot appearing on the reagent paper was then calculated by importing the spot image to the computer using a flat bed scanner (BENQ 5000L) and analyzing with densitometry software; a “Visual Basic” graphical application, specially developed for this purpose.Different process parameters such as the effect of concentration of arsenic solution, concentration of acid, concentration of mercuric bromide and time of reaction were studied to find the optimum working conditions. Fresh arsenic standards (8–80 ng) were analyzed, and a calibration line was plotted. Standard error of estimates, correlation coefficient, and other statistical parameters were calculated. In addition, synthetic arsenic samples were tested to evaluate the accuracy of the technique. The method was also successfully applied to field samples of water.
Results and discussion
Quantification of arsenic in environmental samples is a sensitive issue. Several methods have been employed for quantification of arsenic in environmental samples. But these methods are either costly or not precise at low levels. Efforts are being made around the world to develop accurate, inexpensive, portable and relatively easy methods to quantify this toxic pollutant. The present work is a contribution towards these efforts.The term “spot test analysis” means sensitive and selective detection methods that are based on chemical reactions in which an essential feature is to employ a drop of the analyte on the reagent(s). The detections are micro-analytical and applicable to a wide range of organic and inorganic compounds. In general, the spot test procedure is simple and rapid. Efforts have been made to quantify the process. The present study is also a contribution in this field as the technique is simple and cost-effective can be used as on-field analysis
In previous designs of apparatus for measuring arsenic by spot test, either a horizontal reaction tube was used or a tube inclined at an angle.19 Such a design has a serious drawback in that the reagent paper may be destroyed by the reaction mixture which has been previously removed by using a long capillary tube as used in the conventional Gutzeit method. But it introduces another drawback i.e. low sensitivity due to the increase in dead volume (the empty area where the generated arsine may be retained and effect precise quantification). In this study, the apparatus has been modified in such a way as to remove these drawbacks and increase sensitivity and reproducibility (Fig. 1). A nitrogen purging system is involved to reduce the dead volume effect and to ensure the proper mixing of the reaction contents thereby ensuring precise quantification. Another previous design containing a two section reaction tube filled with resin has been proposed for field analysis20 but the effect of dead volume was not taken into consideration.
In the proposed method, inorganic arsenic ions have been estimated indirectly, that is, by interacting ions with nascent hydrogen (produced in situ using sodium borohydride and hydrochloric acid) and converting them to arsine (AsH3). The resulting arsine gas is passed through the filter paper having lead acetate in its pores, where any sulfide impurity (in the form of H2S after reacting with HCl) gets reacted with lead acetate to produce lead sulfide (PbS). Finally the gas is allowed to pass through the reagent paper (Watman filter paper No. 42 pre-impregnated with mercuric bromide), where it reacts with mercuric bromide to form a yellow colored arsenic-mercuric bromide complex. The more arsenic ions are present in the solution the greater the amount of arsine produced and the greater the amount of As(HgBr)3 complex is produced on the reagent paper. As a result, the spots on the paper will become darker and darker with an increase in arsenic ions. Therefore, the As(HgBr)3 spots are quantifiable. A flow of nitrogen was used to decrease the effect of dead volume in the reaction flask/tube. However, the pressure of nitrogen should not be high, as it will rupture the paper. Sulfuric and hydrochloric acids were used to produce an acidic medium in the reaction, but the former created alot of heat when added to aqueous solutions of arsenic and the lead acetate-dipped paper burnt because of the rise in temperature of the passing gas. As a result, HCl was selected for all the experiments.
The quantification of arsenic spots was carried out using specially developed software. A digital image of the medium containing the developed spots was saved to a PC using a flatbed image scanner at 300 dpi, 24-bit RGB, reflective mode. The software measured the red, green, and blue parts of each pixel of the spot and summed up the values to give a final color depth. The RGB color space is a subtractive color presentation: a pure white color would mean that each of components is at their highest value (eight bits per component = 255) and a pure black color would have each red, green, and blue component equal to zero.21,22 For instance, in Fig. 2, the color density of the sixth spot (12 ppb arsenic concentration) was 107.05, which had 7.27 units red (6.79%), 32.38 green (30.24%), and 67.40 blue (62.97%).
 | ||
| Fig. 2 Spots with variable arsenic concentration 2–20 ppb (8–80 ng). | ||
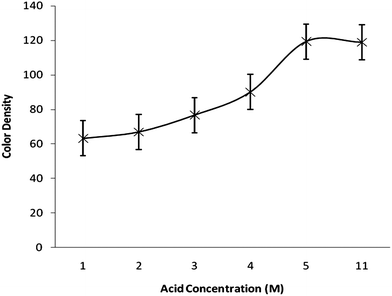
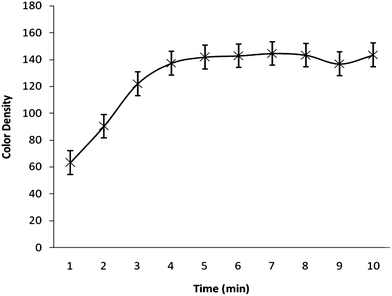
The effects of different parameters such as acid concentration, reaction time, sodium borohydride concentration, which may affect the color intensity of the spot, were also checked to find the optimal conditions. A series of solutions with varying acid concentrations (1–5 M) was prepared for studying the effect of acidity. Fig. 3. demonstrates the response as a function of acid concentration. The higher the HCl concentration, the more dense the spot on the reagent paper. So, it can be concluded that concentrated HCl can be used more effectively but should be used carefully because the reaction becomes so exothermic and extensive bubbling in the reaction tube was observed. Fig. 4 illustrates the color density as a function of reaction time. The spot intensity was found to increase continuously up to 4 min of reaction time after that there was no effect on spot intensity indicating that a 5 min reaction time would be enough for completion of the reaction. The effect of sodium borohydide concentration was also studied by varying its concentration (1–5%). It was found that there is no significant change in the color density of the spot due to variation in sodium borohydride concentration. A similar effect was noted for the variation in mercuric bromide concentration (0.5–2.5%).
 | ||
| Fig. 3 Color density as a function of HCl concentration. | ||
 | ||
| Fig. 4 Color density as a function of reaction time. | ||
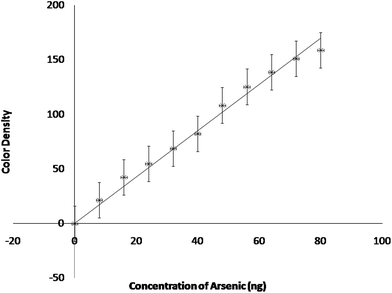
A calibration line for the estimation of arsenic was drawn with the concentration of arsenic as abscissa and the color density of the spots as ordinate (Fig. 5). The experiments for obtaining calibration were performed at optimized conditions. A correlation analysis was carried out to obtain the coefficient of determination or correlation of coefficient (R2). The value, 0.992 approaching to one points out the goodness of fit for the experimental data (Table 1). The detection limit for the experiment comes out to be 1 ppb aqueous arsenic concentration. The calibration data indicates a wide linear range i.e. 2–20 ppb (8–80 ng) arsenic concentration. It may extend up to 50 ppb (if needed). Beyond a concentration of 50 ppb arsenic the color of the spot becomes too dark making it difficult for the software to distinguish between the individual colors.
 | ||
| Fig. 5 Calibration line (color density signal as a function of arsenic concentration in the reaction tube). | ||
| Regression analysis for calibration line | |
|---|---|
| Line equation | y = 2.026x + 5.547 |
| Slope | 2.026 ± 0.06 |
| Intercept | 5.547 ± 1.5 |
| Correlation coefficient | 0.992 |
| Standard error of estimation | 5.081 |
| Sample analysis | |
|---|---|
| Arsenic added (ng) | Arsenic estimated (ng) (%age error) |
| 20 | 19.9 (0.50%) |
| 36 | 35.9 (2.50%) |
| 56 | 55.4 (2.85%) |
| 80 | 78.9 (0.13%) |
| 100 | 97.8 (2.20%) |
| Field sample analysis | ||||
|---|---|---|---|---|
| Sample | Arsenic found by proposed method | Arsenic found by conventional method | ||
| x ± SD (μg L−1) | RSD | x ± SD (μg L−1) | RSD | |
| Water from tube well (600–750ft depth) | 2.2 ± 0.06 | 0.296 | 2.3 ± 0.10 | 0.505 |
| Water from hand pump (70–120ft depth) | 8.9 ± 0.21 | 0.261 | 8.7 ± 0.15 | 0.195 |
| Canal water | 12.3 ± 0.15 | 0.138 | 12.4 ± 0.15 | 0.138 |
Another benefit of the method which differs from the previous methods is that it can be effectively employed to analyse samples with large volumes. It was also found that using the assembly for large volumes (100 mL) the detection limit of arsenic can be further reduced (if desired) as for the same concentration of arsenic in a large volume of solution a greater amount of arsenic is present as compared to that present in a low volume assembly (4 mL). For instance, 4 mL of 2 ppb solution contains 8 ng arsenic, while 100 mL of 2 ppb contains 200 ng arsenic ions.
To corroborate the accuracy of the technique, 5 artificial samples of different arsenic concentration were prepared and analyzed. The concentration of arsenic was calculated by interpolating the software-calculated color density from the respective calibration line. The experimental values were in close accordance to the theoretical ones (Table 1). The proposed method was also successfully applied to the field sample. Ground water and canal water samples from different locations of Lahore, Pakistan were chosen for the said purpose. Additionally, the conventional spectrophotometric molybdenum blue method23 to estimate arsenic was also practiced, and the results of these methods were compared with those of the proposed method. The standard deviation and RSD for 5 replicates for both the methods were calculated and are reported in Table 1. It was startling to note that the new method was more accurate even at very low concentrations. The analysis of artificial samples and comparison with standard methods showed that the present method was simple, economical, accurate, portable, and user-friendly for the on-field analysis of water samples to determine arsenic.
The interference of some common ions present in water (Na+, K+, SO4−2, Cl−, S−2) was also checked. It was found that these ions produce no effect on the arsenic determination even at a concentration 10 times the arsenic concentration except for S−2 ions. S−2 ions strongly interfere in the arsenic determination as they are converted to H2S gas when they interact with acid. This H2S gas can significantly affect the arsenic determination by destroying the reagent paper. This interference was removed using a lead acetate trap in the path of arsine.
Conclusion
The proposed method involves the determination of arsenic without using sophisticated/expensive instruments. The modifications in the apparatus increase the precision and accuracy of a well known Gutzeit method. The technique is easy to work and can easily be applied as a kit method for on-field arsenic analysis. It has an extremely low detection limit i.e. 1 ppb and a wide linear range (2–20 ppb) which indicates its applicability at trace levels. The technique does not require special/specific sample preparation which is its positive impact. Furthermore the results are reproducible. The technique has been successfully employed in the analysis of several synthetic and field samples in order to corroborate its efficiency.References
- F. N. Robertson, Environ. Geochem. Health, 1989, 11, 171–176 CrossRef CAS.
- J. H. T. Luong, E. Majid and K. B. Male, The Open Analytical Chemistry Journal, 2007, 1, 7–14 CAS.
- A. A. Nemodurk, The Analytical Chemistry of Arsenic. Analiticheskaya Khimiya Mysh'yaka. Moscow: Nauka, 1976 Search PubMed.
- A. G. Howard and M. H. Arbab-Zavar, Analyst, 1981, 106, 213–220 RSC.
- J. Aggett and G. Boyes, Analyst, 1989, 114, 1159–1161 RSC.
- Y. Feng and J. Cao, Anal. Chim. Acta, 1994, 293, 211–218 CrossRef CAS.
- A. G. Howard and M. H. Arbab-Zavar, Analyst, 1980, 105, 338–343 RSC.
- S. Kundu, S. K. Ghosh, M. Mandal, T. Pal and A. Pal, Talanta, 2002, 58, 935–942 CrossRef CAS.
- C. Pasha and B. Narayana, Bull. Environ. Contam. Toxicol., 2008, 81, 47–51 CrossRef CAS.
- H. D. Revanasiddappa, B. P. Dayananda and T. N. K. Kumar, Environ. Chem. Lett., 2007, 5, 151–155 CrossRef CAS.
- X. C. Le, W. R. Cullen and K. J. Reimer, Talanta, 1994, 41, 495–502 CrossRef CAS.
- T. W. T. Rupasinghe, T. J. Cardwell, R. W. Cattrall and S. D. Kolev, Anal. Chim. Acta, 2009, 652, 266–271 CrossRef CAS.
- A. Pazirandeh, A. H. Brati and G. Marageh, Appl. Radiat. Isot., 1998, 49, 753–759 CrossRef CAS.
- M. Kopanica and L. Novotny, Anal. Chim. Acta, 1998, 368, 211–218 CrossRef CAS.
- S. Jaya, T. P. Rao and G. P. Rao, Talanta, 1987, 34, 574–576 CrossRef CAS.
- A. S. Khan and A. Chow, Talanta, 1984, 31, 304–306 CrossRef CAS.
- W. Holak, Anal. Chem., 1969, 41, 1712 CrossRef CAS.
- I. Jaunakais, Int. Environ. Technol., 2002, 12, 2 Search PubMed.
- R. V. Abrazhee, A. D. Zorin, N. P. Savinova and Y. I. Sannikova, J. Anal. Chem., 2002, 57, 280–283 CrossRef.
- Hy. Almond, Anal. Chem., 1953, 25, 1766–7 CrossRef CAS.
- J. Anwar, Waheed-uz-Zaman, M. U. Shafique and M. Salman, Anal. Lett., 2010, 43, 367–371 CrossRef CAS.
- U. Shafique, J. Anwar, M. Salman, Waheed-uz-Zaman, A. Dar, R. Rehman, M. Azeem and S. Ameer, J. Sulfur Chem., 2011, 32, 151–157 CrossRef CAS.
- Vogel, Textbook of Quantitative Inorganic Analysis, Ed-4th, 2004, p. 732 Search PubMed.
| This journal is © The Royal Society of Chemistry 2012 |
