Investigation on the fire-induced hazards of Li-ion battery cells by fire calorimetry
Perrine
Ribière
a,
Sylvie
Grugeon
a,
Mathieu
Morcrette
a,
Simeon
Boyanov
b,
Stéphane
Laruelle
a and
Guy
Marlair
*b
aLaboratoire de Réactivité et Chimie des Solides, UMR CNRS 6007, Université de Picardie Jules Verne, 33 rue Saint Leu, 80039, Amiens, France
bInstitut National de l'Environnement et des Risques (INERIS), Direction des Risques Accidentels, Parc Technologique Alata, BP2 60550, Verneuil en Halatte, France. E-mail: guy.marlair@ineris.fr; Fax: +33 3 44 55 65 65; Tel: +33 3 44 55 63 70
First published on 22nd September 2011
Abstract
The use of the high energy Li-ion battery technology for emerging markets like electromobility requires precise appraisal of their safety levels in abuse conditions. Combustion tests were performed on commercial pouch cells by means of the Fire Propagation Apparatus also called Tewarson calorimeter in the EU, so far used to study flammability parameters of polymers and chemicals. Well-controlled conditions for cell combustion are created in such an apparatus with the opportunity to analyse standard decomposition/combustion gases and therefore to quantify thermal and toxic threat parameters governing the fire risk namely the rate of heat release and the effective heat of combustion as well as the toxic product releases. Using the method of O2 consumption, total combustion heats and its kinetic of production were determined as a function of the cell state of charge unveiling an explosion risk in the case of a charged cell. The resulting combustion heat is revealed to be consistent with cumulated contribution values pertaining to each organic part of the cell (polymers and electrolytes) as calculated from thermodynamic data. The first order evaluation of the dangerousness of toxic gases resulting from fire induced combustion such as HF, CO, NO, SO2 and HCl was undertaken and stressed the fact that HF is the most critical gas originating from F-containing cell components in our test conditions.
Broader contextSafety and safety management could remain for some time the hurdles to overcome before a sustainable development of lithium type electric storage systems is seen worldwide. Therefore, numerous initiatives have been launched by various organizations in the EU (CENELEC, UN Sub-Committee of experts on TDG in Geneva, Recharge, …), and overseas (SAE, NFPA, ISO, …) to learn more on technical aspects of safety issues and to improve—through testing and modelling—the resistance of such batteries to abuse conditions. However, fire, as rare an event it may become, remains a possibility. Therefore the consequences of fire scenarios involving lithium batteries need to be fully appraised for fire safety engineering purposes. This work is one of the earlier contributions in that direction, relying on the use of the so-called “Fire propagation apparatus”, internationally recognized as one of the most outstanding pieces of test equipment ever made available to fire scientists to produce scientifically sound data that can be extrapolated and in turn serve risk analysis in various contexts. Basic data allowing pertinent estimates of thermal and chemical threats following a burningLi-ion cell of the “pouch type” have been achieved and are discussed in a way that allows further evaluations regarding fire safety issues on the full value chain of electric energy storage. |
1. Introduction
Today, it is crucial to find a source of alternative energy respecting the environment through the use of renewable energies. The Li-ion battery is one of the emerging new systems of electric storage1–3 proposed in industries for innovative application (automobile, solar and wind energy, …) according to its high energy density (approximately three times that of the Ni-MH battery). However, although these batteries have become quite common for consumer market applications like cell-phones or laptops, the widespread use of this technology for emerging markets like electromobility or smart grids requiring stronger energy and power capacities must be examined from a safety point of view. In general, most of the inherent hazards trigger accidental scenarios when batteries are misused or facing abnormal environmental conditions. In such a case, the contact of highly energetic active materials with flammable organic solvent-based electrolytes can lead to situations out of control. When working out of the stability domain of the system (in terms of temperature or voltage), a series of undesirable reactions (varying according to the type of electrochemistry involved) may occur such as electrolyte reduction at the negative electrolyte interfaces,4–6lithium metal plating,7,8oxidation of electrolyte at high potential versusLi+/Li0,9,10 …. These side reactions can lead to release of heat and gases, then subsequently cause thermal runaway11 that entails significant threats such as explosion or fire phenomena such as the combustion of the electrolyte after rupture of battery confinement. Currently, tests are proposed to characterize the safety performance of the cell constituents of the batteries and appraise their safety levels in abuse conditions. They are determined from technical guidance documents and emerging standards are often under a revision process (UL,12ANSI, SEA, ISO and IEC, UN Manual of tests and criteria, …). A recent compilation of these tests was recently proposed by Doughty.13 These tests can be classified into electrical (overcharge, internal short circuit, external short circuit, overdischarge, …), mechanical (shock, nail penetration, crush, …) or environmental (thermal cycling, …) but hardly ever take account of fire conditions either resulting from a thermal runaway process or induced by external environment.In particular, a fire event resulting from those abuse tests is considered as severe (rated as level 5 to 6) according to hazards rating schemes (level rating from 0 to 7) developed by various organisations (Table 1). However, severity may or may not be critical according to potential adverse effects of such a fire event in a given context, and this consideration has received so far little attention.
| Overall hazard level | EUCAR description | SAE J2464 description | IEC description | Toxicity issue |
|---|---|---|---|---|
| 0 | No effect | No effect | No effect | |
| 1 | Passive protection activated | Passive protection activated | Deformation | |
| 2 | Defect/damage | Defect/damage | Venting | Yes |
| 3 | Leakage (Δmass < 50%) | Minor leakage/venting | Leakage | Yes |
| 4 | Venting (Δmass ≥ 50%) | Major leakage/venting | Leakage | Yes |
| 5 | Fire or flame | Rupture | Rupture | Yes |
| 6 | Rupture | Fire or flame | Fire | Yes |
| 7 | Explosion | Explosion | Explosion | Yes |
From a general survey of past fires that occurred in the last decades, it can be stated that a large proportion of fire injuries and fatalities can be attributed to the inhalation of smoke and toxic gases, so the identification and quantification of the released gases are of major interest as well as the determination of heat produced or onset temperature for thermal runaway. Researchers mainly focused so far on collecting the thermodynamic data, indeed the thermal abuse response of Li-ion cells has been studied at both the component and cell levels using differential scanning calorimetry (DSC)11,14–16 and accelerating rate calorimetry (ARC).17 In this paper, we report thermal tests performed with a fire calorimeter, namely the Fire Propagation Apparatus (ASTM E2058 & NFPA 287), also called the Tewarson Apparatus in Europe.18–20 This very versatile device originally developed by FM Global can give access to the most important fire parameters that are needed for qualifying actual accidental scenarios, such as the heat release rate (governing the thermal threat) and products release rate (governing the toxic threat). This calorimeter is routinely used to study the flammability parameters of polymers,20–22 but is also relevant to learn on the fire behaviour of chemicals23–25 and electrical components.26 The collected combustion thermal and chemical data are the basic input data required for performing thermal and toxic impact calculation to estimate the consequences of industrial fires. In particular, the on-line gas analysis instrumentation (including Fourier-Transform Infra Red equipment) conjugated to flow rate and mass loss rate measurements provides chemical data allowing the determination of the nature and the relating yields of toxic combustion or decomposition products.
In this article, a description of the Tewarson calorimeter and the heat rate calculation method is presented. Tests performed on commercial batteries with different states of charge are reported, supplemented by a discussion on possible mechanisms leading to the formation of the detected gases along with an evaluation of the human toxicity.
2. Experimental
Pretesting
First of all, to prevent the Tewarson calorimeter from being damaged by extreme fire scenarios, a preliminary test is performed to evaluate the explosion risk and relating effects. Hence, a sample of each battery to be studied in fire conditions in the Tewarson calorimeter was placed at first inside a concrete test chamber to undergo the impact of a pool fire of ethanol. In such conditions, no serious explosion risk was observed and adequate testing procedures were established according to further investigations making use of the Tewarson calorimeter.The fire propagation apparatus (Tewarson calorimeter)
The working principle of the Tewarson apparatus is illustrated in Fig. 1. This apparatus comprises two main subsystems. The lower part of the equipment is used to set the sample in combustion configuration under well controlled conditions. The upper part conveys the smoke gases into the exhaust system through a ducting section where critical measurements are made. In particular, the set of instruments allows the quantification of main thermal and toxic threat parameters such as the rate of heat release, the effective heat of combustion and the yields (or generation efficiencies) of the combustion products.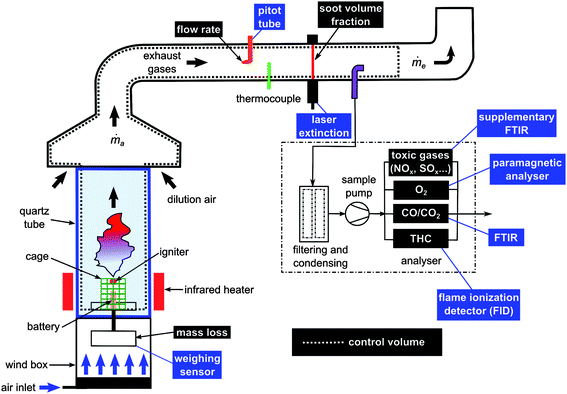 | ||
| Fig. 1 Schematic of the INERIS fire propagation apparatus (Tewarson calorimeter). | ||
An external heat flux is applied to the combustion chamber by four infrared heaters using tungsten filament quartz lamps inserted in both air-cooled and water-cooled reflectors (irradiance level impacting the sample in the order of 35 kW m−2) placed around the battery (at around 10 cm) and whose efficiency depends on the matching between the emitted wavelength and the absorption spectrum of the material to be heated. The resulting flammable gas released from the battery can be ignited thanks to a pilot-flame placed at 30 mm above. Such infra-red heaters are desirable as they provide thermal aggression comparable to a fire environment and do not bring any additional fuel source needed to set fire conditions that would otherwise interfere with emissions of gases from the item under testing.
A supplementary FTIR Instrument was also implemented to provide data on “standard” toxic gases such as hydrogen halides, HCN, NOx, SOx, and aldehydes. Herein are reported the most significant concentrations detected with a Nicolet 6700 spectrometer using a 2 m gas cell (V = 200 mL). It is worth noting that this fire calorimeter was recently listed as one of the rare lab-scale “fire physical models” capable of producing pertinent fire toxicity data at ISO level.27
Determination of the heat release rate (HRR)
The rate at which energy is released from a fire is the most important factor which governs its behavior.28 It is possible to determine the HRR experimentally in a convenient way using the method of oxygen consumption. During a combustion process that has gone to completion, it can be estimated by | (1) |
![[q with combining dot above]](https://www.rsc.org/images/entities/i_char_0071_0307.gif) is the heat release rate (kW), ṁO2 and
is the heat release rate (kW), ṁO2 and  are the mass flow rates of oxygen from the entrained air when a combustion occurs or not, respectively (kg s−1). E is the energy released per mass unit of O2 consumed for a given fuel (kJ g−1 of O2). For a large number of organic solids and liquids or gaseous compounds, this energy appears to be approximately constant (this is known as the Thornton principle). After having checked the values for all possible battery compounds that are able to burn, we took the averaged energy “E” of 13.1 kJ g−1 of O2. In most cases however, combustion in fire conditions is found to be incomplete implying carbon monoxide and soot particles formation. This leads to an overestimation of the HRR calculated from eqn (1) that therefore requires the following corrections:
 | (2) |
![[q with combining dot above]](https://www.rsc.org/images/entities/i_char_0071_0307.gif) CO→CO2 and
CO→CO2 and ![[q with combining dot above]](https://www.rsc.org/images/entities/i_char_0071_0307.gif) soot→CO2 are the HRR accounting for the CO and soot combustion respectively. They are defined as
soot→CO2 are the HRR accounting for the CO and soot combustion respectively. They are defined as ![[q with combining dot above]](https://www.rsc.org/images/entities/i_char_0071_0307.gif) CO→CO2 = ṁCOECO with ECO = 17.6 kJ g−1 of O2 required to convert CO to CO2,
CO→CO2 = ṁCOECO with ECO = 17.6 kJ g−1 of O2 required to convert CO to CO2, ![[q with combining dot above]](https://www.rsc.org/images/entities/i_char_0071_0307.gif) soot→CO2 = ṁsootEsoot with Esoot = 12.62 kJ g−1 of O2 required to convert soot to CO2.29 The interested readers may refer to ref. 22,30 and 31 to learn about the applicability of these fire calorimetry equations which remain a complex issue according to actual material burning, gases measured and inherent limitations of the technique.
soot→CO2 = ṁsootEsoot with Esoot = 12.62 kJ g−1 of O2 required to convert soot to CO2.29 The interested readers may refer to ref. 22,30 and 31 to learn about the applicability of these fire calorimetry equations which remain a complex issue according to actual material burning, gases measured and inherent limitations of the technique.
Batteries composition
For this study, 2.9 Ah (11 Wh) commercial pouch-type batteries were tested. Prior to being subject to the Tewarson test, a battery mass distribution (Fig. 2) has been established to subsequently compare with the combustion data resulting from the gas quantification. This mass distribution was assessed partially by support of physicochemical analysis of fully discharged battery components and by estimation from an industrial database. This battery was dismantled in an argon-filled glove box. The length, width, thickness and weight of the electrode and the separator were measured (Table 2). The electrode materials composition was determined by X-ray diffractometry (Bruker D8 with a PSD detector Cu Kα). To do so, a fragment of electrode was cut and then examined without washing. The separator was rinsed in acetonitrile to recover the electrolyte whose composition was analyzed by ElectroSpray Ionisation High Resolution Mass Spectrometry (ESI-HRMS) and GC/MS techniques. The conductive carbon content was estimated as representing 10% of the calculated electrodes weight and binder quantities were estimated at 10 and 5% of the negative and positive electrode mass respectively. The weight of the electrolyte was assessed by considering a density of 1.2 and a volume porosity of 50% for the separator and 30% for the electrodes.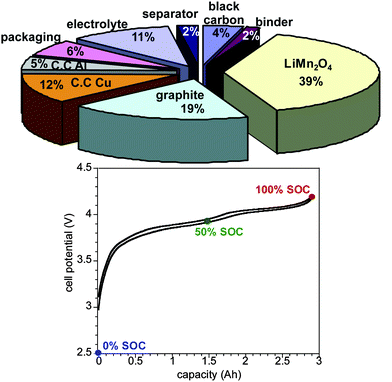 | ||
| Fig. 2 Mass distribution (m = 95 g) and potential–capacity curve (2.9 Ah) of the Li-ion battery. | ||
| Cathode | Al current collector | Anode | Cu current collector | Separator | |
|---|---|---|---|---|---|
| Length/cm | 11.9 | 12.3 | 12.3 | ||
| Width/cm | 6.5 | 6.9 | 6.9 | ||
| Thickness/cm | 2 × 0.007 | 0.04 | 2 × 0.0065 | 0.02 | 0.0031 |
| Number of electrodes | 11 | 12 |
Batteries state of charge
The calorimetric tests were undertaken at three different states of charge (100% SOC, 50% SOC and 0% SOC) and reproduced three times. All batteries were electrically preconfigured by initial cycling consisting of a galvanostatic charge/discharge cycle (C/10) between 2.0 and 4.1 V and then were brought to the wanted SOC (Fig. 2). In order to prevent self-discharge and storage effects, the cycling was carried out less than 24 hours before the calorimetric test. These cycling tests were performed with a VMP system (Biologic, Claix, France) equipped with an amplifier.3. Results and discussion
From the physicochemical analysis, graphite carbon and LiMn2O4 materials were identified at the negative and positive electrode respectively and the ethylene, diethyl and dimethyl carbonate solvents (EC![[thin space (1/6-em)]](https://www.rsc.org/images/entities/char_2009.gif) :
:![[thin space (1/6-em)]](https://www.rsc.org/images/entities/char_2009.gif) DEC
DEC![[thin space (1/6-em)]](https://www.rsc.org/images/entities/char_2009.gif) :
:![[thin space (1/6-em)]](https://www.rsc.org/images/entities/char_2009.gif) DMC) with LiPF6 salt were analyzed as electrolyte. The battery mass distribution is shown in Fig. 2. The active material represents 36% of the battery total mass while the current collectors weight percentage accounts for 30%. Other compounds namely the electrolyte, separator, binder and packaging materials that are mostly constituted of organic or polymers represent 27% (wt) in total.
DMC) with LiPF6 salt were analyzed as electrolyte. The battery mass distribution is shown in Fig. 2. The active material represents 36% of the battery total mass while the current collectors weight percentage accounts for 30%. Other compounds namely the electrolyte, separator, binder and packaging materials that are mostly constituted of organic or polymers represent 27% (wt) in total.
a. Calorimetric and kinetic analysis
During testing, all batteries behave globally the same way; starting to swell around 90 seconds after the starting point of the external radiant heating process, then opening from the tabs, similar to the movement of an accordion.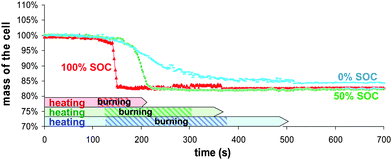 | ||
| Fig. 3 Samples mass loss during combustion as a function of time for different battery SOC. | ||
A visual observation of the cells after combustion clearly showed the exfoliated coiled copper foil and the presence of aluminium droplets due to Al melting. This observation indicates that the maximum temperature reached during the combustion test within the battery could be estimated between 660 and 1083 °C. At such temperature, all the organic and polymer compounds from separator, binder, packaging and electrolyte should have obviously burnt.
The packaging is comprised of an aluminium foil covered by polymer layers which can be roughly estimated at half the weight. So, the weight percentage of all organics and polymers deduced from this approximation and Fig. 2 data is about 23% which is comparable with the 17% mass lost during experiments. Visual observation of the battery after the test revealed that only the upper part of the packaging burnt that slightly decreases the organic compounds percentage to roughly 21%. Therefore, the decomposition and combustion of polymers and electrolytes are responsible for practically all the mass loss indicating such combustion conditions are optimal.
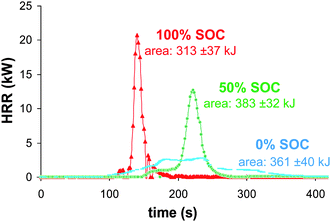 | ||
| Fig. 4 Comparison of 100, 50 and 0% SOC batteries heat release rates measured from oxygen consumption calorimetry. | ||
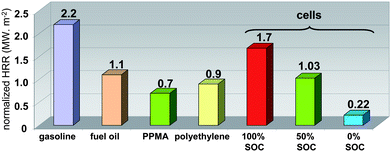 | ||
| Fig. 5 Comparison of 100, 50 and 0% SOC batteries normalized HRR (MW m−2) with that of different combustibles. | ||
The HRR profile integration allows the estimation of the overall dissipated combustion heat. The calculated average values were 313 ± 37, 383 ± 32 and 361 ± 40 kJ for 100, 50 and 0% SOC, respectively, corresponding to a maximum effective combustion heat of 4.03 ± 0.34 MJ kg−1 of cells (Fig. 6). Compared to gasoline, the maximum volumetric energy of the battery (50% SOC) is three-fold lower (10 vs. 33.1 MJ L−1). It can be noted that although the fully charged battery has the highest HRR values and reaction rates, the combustion energy displays the lowest value.
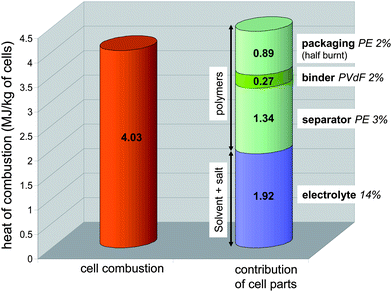 | ||
| Fig. 6 Maximum experimental combustion heat (HRR integration) of the battery compared with cumulated contribution values pertaining to its organic parts calculated from thermodynamic data. | ||
Thanks to the mass distribution of the battery that was previously estimated, we could predict the contribution of the combustion heat for organics namely the electrolyte and the polymers from separator, binder and packaging. The heat of combustion for PVdF as well as PE were found in the literature,33,34 and the heat of combustion of electrolyte was calculated using the heat of formation of solvents and salt35–37 and its assumed combustion products such as HF, Li2O, P4O10, CO2 and H2O.38 As shown in Fig. 6, the sum of these contributions compares well (91%) with the actual cell combustion heat deduced from Tewarson calorimeter data. The slightly higher value may indicate the yield of combustion is not quite complete as usually observed in fire conditions. It can be noticed the overall heat of combustion calculated for the polymers represents at least half the total heat.
Further discussion on uncertainties in HRR measurements. Apart from usual sources of uncertainties well described in the fire science literature (e.g.ref. 22,30, and 31), the brand new question here is the importance of energy that may be liberated through erratic electric discharge through external/internal shorts during the experiments (Joule effect), and that cannot indeed be related to O2 consumption. Our estimate of the maximum contribution of such a process is about 10% of the overall energy content of a fully charged cell. This calculation confirms that the use of the oxygen consumption technique is reasonably relevant for the estimation of HRR in support of related fire safety engineering objectives.
b. Gas analysis and the toxic threat in abuse conditions leading to fire
The production of volatiles from the battery combustion could come from solids involving for the most part, thermal decomposition processes, or from liquids by a simple evaporation process. Also, as the temperature of a burning solid tends to be high, chemical reactions between the battery compounds or/and volatiles should be considered implying that the composition of gases which are ignited tends to be extremely complex. In this study, the gases we focused on allowed the assessment of the combustion overall efficiency (CO, THC), the HRR value (O2, CO2, CO) and the toxic risk (CO, HF, HCl, NOx, SO2).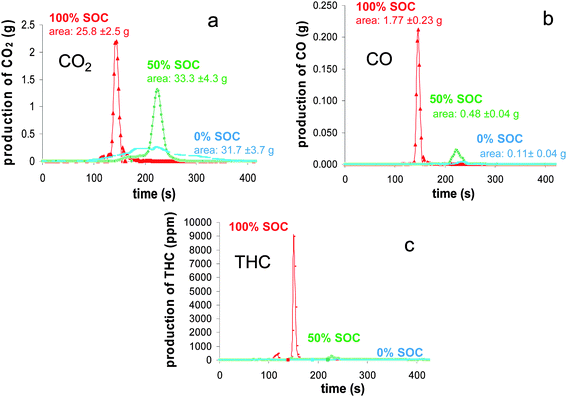 | ||
| Fig. 7 Mass flux of CO2 (a), CO (b) and THC (c) as a function of time during the combustion of the batteries at different SOC. | ||
During the experiments, “standard” toxic gases production was followed by means of the Infra-Red technique. The analysis revealed consequent yield for five of them: SO2, HCl, CO, NO and HF.
In Fig. 8a, nitrogen oxide production is reported during combustion. This production depends on the SOC; when the SOC increases, the NO concentration increases and the production time is shortened. The origin of the nitrogen source was checked by testing different parts of the battery (packaging, separator, positive and negative electrodes) but no such source was identified. The nitrogen oxide might be produced as a reaction product of nitrogen (originating from air or fuel-bound N2) and oxygen from air within the flame (thermal route of NOx production). Usually, temperatures as high as 2500 K are necessary and radical processes as below are involved:
| O* + N2 ↔ NO + N*, N* + O2 ↔ NO + O* |
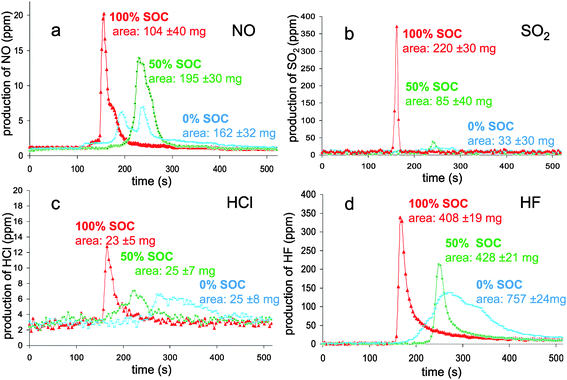 | ||
| Fig. 8 Mass flux of NO (a), SO2 (b), HCl (c) and HF (d) as a function of time during the combustion of the batteries at different SOC. | ||
Visual observation of the combustion (video recording) confirms an apparent relationship between the flame intensity and the NO production measured: highly intense in a short time for the 100% SOC, less intense in a longer time for the 50% SOC and a dim flame for around 3 minutes in the case of 0% SOC. As far as the N2 presence is concerned, further testing at larger scale would be needed to clarify its origin.
The yield of SO2 was analyzed (Fig. 8b) and, surprisingly, was found to be in a higher concentration in the case of the fully charged battery. The origin of sulfur containing molecules arises from battery additives. Indeed, sulfur-based compounds are known to be used as additives for their property in facilitating SEI formation.39–41 The heat release reaches a threshold for which the temperature is enough to initiate the degradation of the additive to form sulfur oxide. Unlike fully charged batteries, 50% and 0% SOC HRR values seem to be too low to allow such reaction.
Chlorine was detected through halide production (Fig. 8c). Polymers are chlorine potential sources and may be found in three components of the battery: binder, separator and packaging. The common binders used for commercial batteries, PVdF or CMC,42 do not contain chlorine; the sole halogen element which can be found is fluorine in PVdF. Combustion experiments on separator and packaging were undertaken and only the separator revealed the presence of chlorine. The HCl production kinetic for the 100% SOC batteries was different from the others for which the production spans at least two minutes. The quantity of this rejected halide has no SOC dependence and remains low (∼25 mg).
From the gas effluents, hydrofluoric acid (HF) was also detected (Fig. 8d). The preliminary analyses of the battery components revealed that the major sources of fluorine were the electrolyte salt (LiPF6) and the binder (PVdF). Its production kinetic turned out to be different according to the battery SOC and followed the HRR profiles. Consequently, HF emission extends over a longer time (200 seconds) for a 0% SOC compared to 50 seconds for a 100% SOC. In accordance with the reaction rate, half-charged batteries behaved as an intermediate case.
Surprisingly, the HF cumulative masses calculated from the peak integration indicated quite different values; the higher one corresponding to the discharged batteries. From the mass distribution analysis, the HF equivalent mass could be estimated to be 1.21 g from the electrolyte and 1.23 g from the binder. Hence, the detected maximum value (0.757 mg) only represents a third of the total equivalent mass of fluorine contained in the battery. It is worth noting here that, unlike the batteries, the combustion of a EC![[thin space (1/6-em)]](https://www.rsc.org/images/entities/char_2009.gif) :
:![[thin space (1/6-em)]](https://www.rsc.org/images/entities/char_2009.gif) DMC
DMC![[thin space (1/6-em)]](https://www.rsc.org/images/entities/char_2009.gif) :
:![[thin space (1/6-em)]](https://www.rsc.org/images/entities/char_2009.gif) DEC (1
DEC (1![[thin space (1/6-em)]](https://www.rsc.org/images/entities/char_2009.gif) :
:![[thin space (1/6-em)]](https://www.rsc.org/images/entities/char_2009.gif) 1
1![[thin space (1/6-em)]](https://www.rsc.org/images/entities/char_2009.gif) :
:![[thin space (1/6-em)]](https://www.rsc.org/images/entities/char_2009.gif) 1 wt) LiPF6 (1 M) electrolyte tested alone in a pool burning mode by means of the same PFA apparatus entailed the release of nearly the total equivalent mass of HF (∼98%). Hence, in the case of battery combustion, either a large part of HF is absorbed on battery components or fluorine is involved in complex chemistry43,44 so that other fluorine based compounds, not detected here, might be released.
1 wt) LiPF6 (1 M) electrolyte tested alone in a pool burning mode by means of the same PFA apparatus entailed the release of nearly the total equivalent mass of HF (∼98%). Hence, in the case of battery combustion, either a large part of HF is absorbed on battery components or fluorine is involved in complex chemistry43,44 so that other fluorine based compounds, not detected here, might be released.
c. Toxicity evaluation
A judicious question is the significance of toxic gas data from these combustion tests. A series of national and international standards give general guidance regarding the toxicity of gas as carbon dioxide, carbon monoxide, hydrogen halides (HCl, HBr, and HF), sulfur dioxide, hydrogen cyanide, nitrogen oxides, formaldehyde (CH2O) and acrolein (C3H4O) gases. Based on the French standard,45 the evaluation of the dangerousness46 of the combustion gas products was undertaken. Two toxicity limit values were taken into account: the Irreversible Effects Threshold (IET) and the First Lethal Effects Threshold (FLET), as defined in the French regulatory context to perform toxic hazard studies in industrial environment. For a first order toxic hazard evaluation, we have considered the maximum quantity of gas released during all the combustion experiments in a fictive scenario where these gases are evenly distributed in a room of 50 m3 to compare experimental values with the mentioned thresholds.From the experiments, the maximum values used were 0.22 g (4.4 × 10⁻³ g m−3), 0.025 g (5 × 10⁻⁴ g m−3), 1.77 g (3.54 × 10⁻² g m−3), 0.195 g (3.9 × 10⁻³ g m−3) and 0.757 g (1.5 × 10⁻² g m−3) for SO2, HCl, CO, NO and HF, respectively. Fig. 9 plots the FLET and IET values as a function of both the exposure time and the maximum concentration of gas released from the battery combustion tests. Whatever the exposure time, experimental values are far from IET limits. By basic extrapolation not taking account any scale-up effect on toxic species yields (which is indeed a very questionable assumption), we have evaluated the electrical energy of the batteries required for reaching the individual IET and FLET (Table 3) at a 60 minutes exposure time. Energies as high as 60 to 1320 Wh and 110 to 7880 Wh are announced to approach both the IET and FLET toxicity limits respectively, indicating that the hazard driven by those toxics would require full combustion of relatively large batteries to become critical. From this viewpoint, emerging e-mobility applications (hybrid electric vehicles, plug-in hybrid electric vehicles, full electric vehicles…) that require embarked electric energy storage systems in the range of 15 to 30 kWh would actually deserve dedicated studies focusing on toxicity impacts in the case of EV related fire scenarios. This is true in particular for storage fires and EV car fires, all the more in the latter case than the volume in which toxic smoke may be trapped could be far less than 50 m3 (e.g. car interior), or in case multiple car burning may be feared depending on the confinement taken into consideration (e.g. garage, underground park place, …).
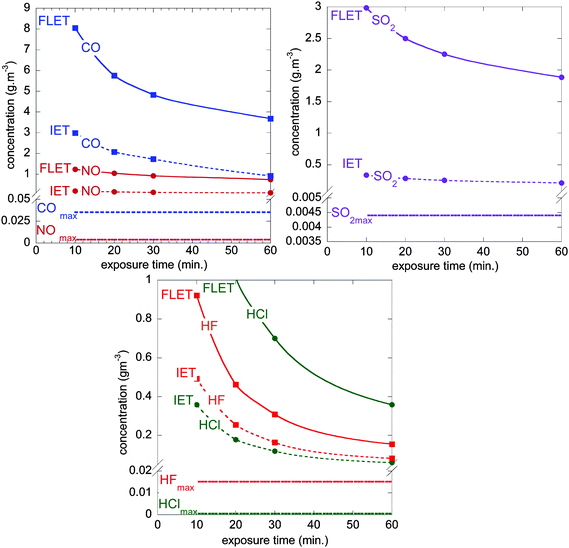 | ||
| Fig. 9 FLET and IET concentration values as a function of exposure time with maximum concentration of CO, NO, SO2, HCl and HF gases released from the batteries combustion (2.9 Ah pouch cell burning in a 50 m3 room). These graphs allow first-order evaluation of their dangerousness (see Table 3). | ||
| (Wh) | HF | CO | NO | SO2 | HCl |
|---|---|---|---|---|---|
| IET | 60 | 290 | 280 | 530 | 1320 |
| FLET | 110 | 1140 | 2080 | 4710 | 7880 |
Note that CO toxicity is a common threat of any fire burning any carbon containing material. The actual threat being clearly related to the amount of material burning, combined (often additive) actions of individual gases, temperature and confinement conditions. More attention might be paid for hydrofluoric acid, since energies of 60 and 110 Wh (roughly equivalent to that of a laptop) are necessary to achieve the IET and FLET limits in these conditions. So, it can be deduced that fluorine based molecules are one of the key points for the battery security field. As it was mentioned above, fluorine sources are coming from the binder and the electrolyte. The removal of fluorine from the binder is conceivable and already exists with the use of binders such as carboxymethyl cellulose but replacement of fluorine containing salts in the electrolyte is a challenging situation for most applications. Reducing flammability of solvents might possibly serve fire toxicity management.
4. Conclusion
The calorimeter implementation for battery safety application was undertaken to add to the existing techniques, equipment able to provide more insight into the fire battery behaviour. This study has demonstrated the interest of the Tewarson calorimeter in the scope of battery safety field. This apparatus permits on-line analysis of mass loss and combustion gases production such as O2, CO, CO2, hydrogen halides, HCN, NOx, SOx, aldehydes, and THC. From these data, the heat released rate, the heat of combustion and the mass of burnt products from the combustion tests can be deduced. These data could be of great help for fire simulation. Moreover, the identification and quantification of toxic emissions from combustion gases can also be estimated. As a result, the whole data could have a part in the improvement of battery from safety point of view.2.9 Ah pouch type batteries were tested at 100, 50 and 0% state of charge. Results showed that the masses lost during all the fire experiments were practically identical and roughly corresponded to the mass of organics. Nevertheless, depending on the SOC, the way of losing mass was different revealing the major role of the accumulated electrochemical energy.31 Upon heating (radiation of infrared heaters), this energy is released through different reaction pathways, leading to thermal runaway within the materials and production of fuel gas. The exact nature of these extra-reactions is beyond the scope of this paper but could be reactions of electrode materials with the electrolyte, electrolyte decomposition or positive active material decomposition. In the case of the fully charged batteries, the energy is rapidly released verging on explosion, and the phenomenon suddenness restricts the oxygen consumption leading to incomplete combustion. This can be noticed by the hydrocarbons detection, the highest carbon monoxide production and the lowest heat energy value. When the battery is half-charged, the thermal runaway is less important allowing the combustion to go nearly to completion. For the fully discharged case, the burning of the battery is relatively slow (8 minutes) leading to the complete combustion condition.
Quantification of O2, CO and CO2 gases allowed estimation of the cell combustion heat either by O2 consumption or by CO and CO2 releases. The maximum value (∼4 MJ kg−1 of the tested pouch 2.9 Ah batteries) was found to be close to the one calculated from thermodynamic data (combustion and formation heat of the organics). This quite good correlation brings to light that a battery heat of combustion can be estimated through simple addition of the contributions of all polymers and electrolyte combustion heats. Note that for the tested pouch cells, at least 50% of the combustion heat originates from polymers.
From the online analysis, significant concentrations of toxic gases are detected as HF, CO, NO, SO2 and HCl. The production of these gases also depends on the cell SOC; carbon oxides and nitrogen oxide are the direct products of combustion and their kinetics follow the HRR profile. SO2 is probably the reaction product of sulfur-based additive added into the electrolyte and its formation requires high heat that the fully charged battery is only able to release. The yield of HCl remains low and seems to have no SOC dependence. In contrast, HF results indicate a SOC dependence and the maximum concentration is achieved with the fully discharged battery. The evaluation of the dangerousness of the gaseous combustion products was undertaken by a simple extrapolation of the toxicity thresholds. The results stress the problem of fluorine-based compounds from a safety point of view and more precisely in the case of EV and HEV large-scale application. Despite the fact that experiments were conducted under high air flow and with high heat flux applied to the battery, it seems that future works have to be focussed on the replacement of LiPF6 by a less fluorine-containing salt47,48 and by the removal of fluorine in the binder.
Acknowledgements
This work was supported by “Région de Picardie” through the BatteryNanosafe project. The authors are grateful to Jean-Pierre Bertrand for his technical assistance and to Alexandra Paillart and Michel Armand for helpful discussions.References
- M. Armand and J.-M. Tarascon, Nature, 2008, 451, 652 CrossRef CAS.
- B. Scrosati, J. Hassoun and Y.-K. Sun, Energy Environ. Sci., 2011, 4(9), 3287 CAS.
- V. Etacheri, R. Marom, R. Elazari, G. Salitra and D. Aurbach, Energy Environ. Sci., 2011, 4(9), 3243 CAS.
- J. O. Besenhard, J. Gurtler and P. Komenda, DECHEMA Monogr., 1987, 109, 315 CAS.
- A. Xiao, L. Yang, B. L. Lucht, S.-H. Kang and D. P. Abraham, J. Electrochem. Soc., 2009, 156(4), A318 CrossRef CAS.
- Z. Chen, Y. Qin, Y. Ren, W. Lu, C. Orendorff, E. P. Roth and K. Amine, Energy Environ. Sci., 2011 10.1039/c1ee01786a , Advance article.
- S. S. Zhang, K. Xu and T. R. Jow, J. Power Sources, 2006, 160(2), 1349 CrossRef CAS.
- M. C. Smart and B. V. Ratnakumar, J. Electrochem. Soc., 2011, 158(4), A379 CrossRef CAS.
- M. Pasquali, G. Pistoia, V. Manev and R. V. Moshtev, J. Electrochem. Soc., 1986, 133, 2454 CrossRef CAS.
- D. Aurbach, B. Markovsky, G. Salitra, E. Markevich, Y. Talyossef, M. Koltypin, L. Nazar, B. Ellis and D. Kovacheva, J. Power Sources, 2007, 165, 491 CrossRef CAS.
- H. Yang, H. Bang, K. Amine and J. Prakash, J. Electrochem. Soc., 2005, 152(1), A73 CrossRef CAS.
- UL Standard for Safety for Lithium Batteries, UL 1642, Underwriters Laboratories Inc, Northbrook IL, 4th edn, 2005 Search PubMed.
- D. Doughty, Proceedings of Battery Safety 2010, Boston (USA), 2010, p. 347 Search PubMed.
- P. Biensan, B. Simon, J. P. Pérès, A. De Guibert, M. Broussely, J. M. Bodet and F. Perton, J. Power Sources, 1999, 81–82, 906 CrossRef CAS.
- E. P. Roth, D. H. Doughty and J. Franklin, J. Power Sources, 2004, 134, 222 CrossRef CAS.
- D. Choi, J. Xiao, Y. J. Choi, J. S. Hardy, M. Vijayakumar, M. S. Bhuvaneswari, J. Liu, W. Xu, W. Wang, Z. Yang, G. L. Graff and J.-G. Zhang, Energy Environ. Sci., 2011 10.1039/c1ee01501j , Advance article.
- H. Maleki and J. N. Howard, J. Power Sources, 2004, 137, 117 CrossRef CAS.
- A. Tewarson and R. F. Pion, Combust. Flame, 1976, 26, 85 CrossRef CAS.
- A. Tewarson, J. Fire Sci., 1992, 10(3), 188 CrossRef CAS.
- A. Tewarson, F. H. Jiang and T. Morikawa, Combust. Flame, 1993, 95(1–2), 151 CrossRef CAS.
- A. Tewarson, J. Fire Flammability, 1977, 8, 115 CAS.
- G. Marlair and A. Tewarson, Proceedings of the 7th International Symposium on Fire Safety Science, Worcester (USA), 2002, p. 629 Search PubMed.
- C. Costa, G. Treand, F. Moineault and J.-L. Gustin, Process Saf. Environ. Prot., 1999, 77 B3, 154 CrossRef.
- S. Brohez, G. Marlair and C. Delvosalle, Fire Mater., 2006, 30, 131 CrossRef CAS.
- S. Brohez, G. Marlair and C. Delvosalle, Fire Mater., 2006, 30, 35 CrossRef CAS.
- E. Thibert and B. Gauthier, Polym. Degrad. Stab., 1999, 64, 585 CrossRef CAS.
- Iso TR 16321-2, Geneva, 2007.
- V. Babrauskas, Fire Saf. J., 1985, 8(3), 199 CrossRef.
- S. Brohez, C. Delvosalle, G. Marlair and A. Tewarson, J. Fire Sci., 2000, 18(5), 327 CAS.
- H. Biteau, PhD thesis, University of Edinburgh, 2009.
- H. Biteau, T. Steinhaus, C. Schemel, A. Simeoni, G. Marlair, N. Bal and J.-L. Torero, Fire Safety Science, 2009, 9, 1165 Search PubMed.
- B. Barnett, Proceedings of Battery Safety 2010, Boston (USA), 2010, p. 24 Search PubMed.
- A. Tewarson, F. Chu and F. H. Jiang, Proceedings of the 4th International Symposium on Fire Safety Science, Ottawa (Canada), 1994, p. 563 Search PubMed.
- R. N. Walters, S. M. Hackett and R. E. Lyon, Fire Mater., 2000, 24(5), 245 CrossRef CAS.
- W. L. Calhoun, J. Chem. Eng. Data, 1983, 28, 146 CrossRef CAS.
- K. S. Gavritchev, G. A. Sharpataya, A. A. Smagin, E. N. Malyi and V. A. Matyakha, J. Therm. Anal. Calorim., 2003, 73, 71 CrossRef CAS.
- S. J. Harris, A. Timmons and W. J. Pitz, J. Power Sources, 2009, 193, 855 CrossRef CAS.
- Handbook of Chemistry and Physics, ed. D. R. Lide, CRC Press, 73rd edn, 1992, pp. 5–1 Search PubMed.
- M. W. Wagner, C. Liebenow and J. O. Besenhard, J. Power Sources, 1997, 68, 328 CrossRef CAS.
- G. H. Wrodnigg, J. O. Besenhard and M. Winter, J. Electrochem. Soc., 1991, 46, 470 Search PubMed.
- G. H. Wrodnigg, J. O. Besenhard and M. Winter, J. Power Sources, 2001, 97–98, 592 CrossRef CAS.
- J. H. Lee, U. Paik, V. A. Hackley and Y. M. Choi, J. Electrochem. Soc., 2005, 152(9), A1763 CrossRef CAS.
- A. Hammami, N. Raymond and M. Armand, Nature, 2003, 424(6949), 635 CrossRef CAS.
- C. L. Campion, W. Li, W. B. Euler, B. L. Lucht, B. Ravdel, J. F. DiCarlo, R. Gitzendanner and K. M. Abraham, Electrochem. Solid-State Lett., 2004, 7, A194 CrossRef CAS.
- http://www.ineris.fr/substances/fr//page/23 .
- D. Lisbona and T. Snee, Process Saf. Environ. Prot., 2011 DOI:10.1016/j.psep.2011.06.022.
- L. Li, S. Zhou, H. Han, H. Li, J. Nie, M. Armand, Z. Zhou and X. Huang, J. Electrochem. Soc., 2011, 158, A74 CrossRef CAS.
- L. Niedzicki, S. Grugeon, S. Laruelle, P. Judeinstein, M. Bukowska, J. Prejzner, P. Szczeciñski, W. Wieczorek and M. Armand, J. Power Sources, 2011, 196(20), 8696 CrossRef CAS.
| This journal is © The Royal Society of Chemistry 2012 |
