Influence of design and operating parameters of pneumatic concentric nebulizer on micro-flow aerosol characteristics and ICP-MS analytical performances
Valerie
Geertsen
*a,
Pascal
Lemaitre
b,
Michel
Tabarant
c and
Frédéric
Chartier
c
aCommissariat à l'Energie Atomique, CEA/DSM/IRAMIS/SIS2M/LIONS, CEA/CNRS/UMR 32-99, Centre de Saclay, 91191, Gif Sur Yvette Cedex, France
bInstitut de Radioprotection et de Sûreté Nucléaire/DSU/SERAC, BP 68, 91192, Gif-sur-Yvette Cedex, France
cCommissariat à l'Energie Atomique, DEN/DPC, Centre de Saclay, 91191, Gif Sur Yvette Cedex, France
First published on 8th November 2011
Abstract
This paper describes the development of a very simple micro-flow pneumatic ICPMS nebulizing solution based on a commercial glass concentric slurry nebulizer and a fused-silica capillary. It appears as a well-performing, low cost system able to nebulize efficiently at a low liquid flow rate (40![[thin space (1/6-em)]](https://www.rsc.org/images/entities/char_2009.gif) 000 cps for a 1 ppb 238U solution at 1 μL min−1). Experimentally, it provides a practical set-up for studying the influence of not only operating conditions (liquid and gas flow rates, temperature) but also nebulizer design (nozzle configuration, capillary tip shape, capillary inner diameter). More precisely it allows the study of liquid-capillary-tip to gas-exit stick-out, i.e. recessed position (e < 0), coplanar liquid and gas exits (e = 0) or liquid protruding configuration (e > 0) in combination with various liquid capillary inner diameters or tip shapes. This investigation brings out several practical results even if the relation between the primary aerosol characteristics (studied by three complementary techniques (PIV, shadowgraphy and ILIDS)) and the ICPMS signal measured on a tertiary aerosol is not easy to establish precisely. These results are systematically compared to the literature data, replacing them in a more global perspective. It highlights the prime importance of the nozzle configuration i.e. stick-out and liquid capillary inner diameter. The stick-out (e) parameter is of crucial importance both for the primary spray homogeneity in terms of droplet velocity distribution and for tertiary signal intensity and stability but shows no influence on the oxide ratio or on the droplet size distribution. This last characteristic may not be the most relevant criterion for low liquid uptake nebulizers, contrary to millilitre flow-rate ones. The authors hypothesize that this may be linked to the evaporation capacity of the nebulising gas largely exceeding the liquid uptake, creating a fundamentally different situation for the two types of nebulizers. This study also displays the interest of using a flat-end capillary instead of a tapered end which is the solution most commonly employed, and it highlights the existence of an optimum nozzle configuration (e > 0) in terms of sensitivity and stability, that is dependent on the capillary inner diameter.
000 cps for a 1 ppb 238U solution at 1 μL min−1). Experimentally, it provides a practical set-up for studying the influence of not only operating conditions (liquid and gas flow rates, temperature) but also nebulizer design (nozzle configuration, capillary tip shape, capillary inner diameter). More precisely it allows the study of liquid-capillary-tip to gas-exit stick-out, i.e. recessed position (e < 0), coplanar liquid and gas exits (e = 0) or liquid protruding configuration (e > 0) in combination with various liquid capillary inner diameters or tip shapes. This investigation brings out several practical results even if the relation between the primary aerosol characteristics (studied by three complementary techniques (PIV, shadowgraphy and ILIDS)) and the ICPMS signal measured on a tertiary aerosol is not easy to establish precisely. These results are systematically compared to the literature data, replacing them in a more global perspective. It highlights the prime importance of the nozzle configuration i.e. stick-out and liquid capillary inner diameter. The stick-out (e) parameter is of crucial importance both for the primary spray homogeneity in terms of droplet velocity distribution and for tertiary signal intensity and stability but shows no influence on the oxide ratio or on the droplet size distribution. This last characteristic may not be the most relevant criterion for low liquid uptake nebulizers, contrary to millilitre flow-rate ones. The authors hypothesize that this may be linked to the evaporation capacity of the nebulising gas largely exceeding the liquid uptake, creating a fundamentally different situation for the two types of nebulizers. This study also displays the interest of using a flat-end capillary instead of a tapered end which is the solution most commonly employed, and it highlights the existence of an optimum nozzle configuration (e > 0) in terms of sensitivity and stability, that is dependent on the capillary inner diameter.
Introduction
The use of ICPMS as a detector for hyphenated techniques (CE-ICPMS, LC-ICPMS, etc.)1–4 and also more generally its application to fields such as biology or nuclear science5,6 have reinforced in these last years the interest for very low-consumption nebulizers (few μL min−1 or less).3,7–12 The main challenge in this case is probably the optimization of the proportion of the vaporized sample which is really analyzed or at least introduced into the plasma. This proportion must be improved so as not to diminish excessively the analytical sensitivity. Developing a nebulizer that operates at significantly lower flow rates requires a coupled optimization of aerosol physical characteristics and analytical parameters. Numerous pneumatic low-consumption concentric nebulizers are described in the literature.13,14 These can be classified into two categories, the first involving a droplet sorting by a low volume total-consumption nebulisation chamber, the second being directly introduced into the plasma (DIHEN,15Vulkan DIN, d-DIHEN,16etc.). Almost all these low flow devices show the same disadvantages. They are more costly than conventional nebulizers and prone to clogging due to the reduction of the liquid channel dimension. Some of them are of course demountable but it involves the addition of removable capillary tubing. The tube is then introduced directly inside the gas flow showing a tendency to vibrate and inducing signal stability loss. Capillaries can also be stiffened with PEEK tubing or a thin metallic needle and centered through a sapphire orifice but this increases the nebulizer complexity.16–18We propose to study the performances of a pneumatic glass nebulizer which has been modified in a reversible way to efficiently spray 1 μL min−1 of liquid. More precisely, the study detailed here consists of selecting not a narrow-bore nebulizer but, on the contrary, a commercial glass concentric slurry nebulizer providing a liquid capillary inner diameter wide enough to introduce a fused-silica capillary tubing transporting the low-volume liquid sample. The fused-silica capillary is then perfectly centered and naturally protected from the gas flow vibration by the nebulizer large glass liquid capillary bore, the inner-wall of this being just a little wider than the external diameter of the fused-silica capillary. This experimental setup also permits a variety of nozzle configurations to be performed (liquid and gas respective exit position, liquid inner diameter, etc.) which can be realized here with a single device allowing us to easily study the relation between the nozzle configuration and the spray characteristics.
A nozzle configuration study has been reported previously by Coggins and Baker20 in 1983 but the nebulizer they fabricated was dedicated to pesticide delivery onto target surfaces. The device consisted of a concentric nebulizer modified by the introduction of a sharp pointed needle in the center of the liquid flow tubing. It operated with nitrogen at low gas flow and provided large droplets.19,20 The results showed a high influence of the needle inner diameter and position on the spray quality. As reported in the past by Gustavsson,21 Nukiyama and Tanasawa, working on carburetor theory, studied three different nebulizer nozzles (convergent, straight-bored and knife-edged) but found no influence of nozzle configuration on droplet size distribution. Here also, the jet-injection nebulizer they studied showed dimensions and flows far from the low-consumption spray we are interested in.
Recently, Inagaki and co-workers have reported very interesting work on a commercial high performance concentric nebulizer modified in order to introduce tapered-end fused-silica capillaries.22 This study clearly highlights the influence of the capillary tip-to-nozzle position on the aerosol characteristics. Unfortunately only recessed capillary nozzle configurations, that is, positions where the fused-silica capillary is set back from the nozzle, are considered. In addition, capillary tips are only tapered shape and capillary inner diameters are narrow bore. A few years before, a paper reporting the comparison of three direct injection high efficiency nebulizers (DIHENs) also mentioned the influences of the liquid capillary position proposing a protruding nozzle configuration but without studying it specifically.16
The characterization of nebulizers can be realized directly on the aerosol by various observation techniques such as light scattering interferometry23–25 alone or in combination with laser induced fluorescence for optical patternation,26,27 laser diffraction,22 infrared particle sizing,28 near femto-second laser ablation29 or 2-dimensional phase Doppler30,31 and also by means of their analytical performances.32–34
The present investigation offers characterization of both primary and tertiary aerosols produced by the modified slurry nebulizer at a low liquid uptake flow rate (1 μL min−1) with a study of gas flow rates and nozzle configurations. More precisely, in the first part of the study the low droplet density of the primary aerosol (i.e. the aerosol expanding out of the nozzle) allows us to perform Particle Imaging Velocimetry (PIV), shadowgraphy and Interferometric Laser Imaging for Droplet Sizing (ILIDS). The aerosol is then characterized in terms of on-axis and off-axis droplet velocity profiles, cone shape, droplet size distribution, etc. This primary aerosol study, which is time consuming, was conducted only on a first set of parameters. The interest we found in the information it provided led us to complete this study by the evaluation of analytical performances which is described in the second part. A tertiary aerosol study (i.e. the aerosol sorted by the nebulisation chamber and introduced into the plasma) was then realized measuring the ICPMS signal of a uranium solution at micro-flow rates. It is performed in the instrumental conditions of the first characterization (flow rate, capillary diameter, nozzle configuration, etc.) and also on a wider and more systematic basis. The influence of the fused-silica capillary inner diameter or tip-shape (flat or tapered) on the analytical performances is for instance shown. By comparison of these two distinct studies, some relations between aerosol characteristics and ICPMS signals are then highlighted.
Experimental section
In order to characterize the present nebulizer with a liquid flow rate of 1 μL min−1, the droplet sizes and velocities are measured in the near field of injection with the help of ILIDS and PIV optical diagnostics.35 The primary and secondary atomization zones are studied shadowgraphically. The three experimental set-ups associated with these techniques are summarized in this section.1. Particle Image Velocimetry
The optical set-up adopted for PIV, presented in Fig. 1-a, consists of a dual cavity frequency doubled Nd:YAG pulsed laser (pulse duration: 9 ns, wavelength: 532 nm, time between pulses: 3 μs) equipped with a cylindrical lens in order to form a laser sheet. This laser sheet has a Gaussian intensity profile and a full width at half maximum of 1.6 mm. The images are recorded on a CCD camera (1024 × 1280 pixels2) equipped with a 105 mm focal length lens, located at an off axis angle of 90° from the laser sheet axis. | ||
| Fig. 1 Primary aerosol characterization (a): Particle Image Velocimetry setup, (b): Interferometric Laser Imaging for Droplet Sizing, and (c): high speed shadowgraphy principle. | ||
2. Interferometic Laser Imaging for Droplet Sizing
Interferometric Laser Imaging for Droplet Sizing (ILIDS) provides the instantaneous size and spatial distribution of transparent and spherical particles (droplets and bubbles) in a section of a flow. It was first introduced by Konig et al.,36 and further improved by Glover et al.35 in image acquisition and data processing.Fig. 1-b shows the basic principle of this optical diagnostic. A pulsed laser sheet is sent toward a group of droplets and the scattered light is collected off-axis by receiving optics. Different set-ups can be found in the literature, with off-axis values of 66°35,37 or 90°.38 The angle of 66° is particular because, at this angular location, the intensities of the orders of diffusion corresponding to reflected (p = 0) and refracted (p = 1) lights are equal, for an incident wave polarised perpendicularly to the scattering plane.39 Two bright spots are observed in the focal plane; these spots are commonly called glare points and the distance between them is a direct function of the droplet size.40 For ILIDS diagnostic the images are recorded by a camera positioned on a non-focal plane (out-of-focus imaging).
The camera observes the interferometric pattern of the laser light scattered by the particles. This pattern results from the interference between the light reflected at the droplet surface (p = 0) and the light refracted within the droplet (p = 1). Each droplet is thus associated with a fringe pattern in a disk. For each droplet, the number of fringes (or the fringe frequency) is linked to the droplet diameter, by a factor which depends on the receiving optics parameters (numerical aperture, focal length, out-of-focus distance, etc.). Images are finally processed numerically.
Mounaim-Rousselle and Pajot38 established eqn (1) that links the droplet diameter (d) to the fringe frequency of an out-of-focus particle image (f):
 | (1) |
The optical setup developed for this measurement is exactly the same as the one described for PIV measurement except that the camera is defocused and placed at an off axis angle equal to 66°.
3. High speed shadowgraphy
Shadowgraphy consists of illuminating an object with a bright light source (a continuous argon laser in our case). A camera is positioned in order to place the light source, the object and the camera on the same line. The camera measures the shadow of the object backlit by the laser (Fig. 1-c). In our configuration a large magnification is needed, as a consequence an optical bellow is added between the lens (60 mm f/2.8) and the CCD sensor (1024 × 1280 pixels2).4. ICPMS Instrumentation and operating conditions
The borosilicate glass concentric slurry nebulizer (AR30-1–FS6E) was purchased from Glass Expansion (West Melbourne, Australia). The nebulizer liquid path has a 450 μm internal diameter which allows the introduction of a fused silica 360 μm outside diameter capillary (Fig. 2-a). The fused-silica capillaries have internal diameters of 20 μm, 50 μm, 75 μm or 100 μm for a 360 μm outside diameter (Upchurch Scientific, Oak Harbor, USA and Beckman Coulter, Brea, USA). The primary spray characterization is performed with a 75 μm inner diameter fused-silica capillary. Conically tapered-tip fused silica capillaries have a 360 μm outside diameter with a 75 μm or 50 μm inside diameter (New Objectives, Woburn, USA) (Fig. 2-b). Capillaries are cut with a fused silica tubing rotary cutter equipped with a built-in magnifying glass to control the tip flatness (Upchurch Scientific). Fused-silica capillaries are fixed via a PEEK sleeve (Upchurch Scientific) to a 1/16′ union connector (Upchurch Scientific) glued to a drilled barrel installed in an aperture platform of a ball bearing linear stage (Micro-Controle Spectra-Physics SA, Evry, France). The micrometric screw allows precise positioning of the fused-silica capillary relative to the nebulizer nozzle. The distance (e) between the capillary tip and nebulizer nozzle varies from −0.1 mm to +1 mm. (Fig. 2-b). The liquid flow is delivered at 1 μL min−1via a syringe pump (Pump 11 Plus, Advanced Single Syringe, Harvard Apparatus, Holliston, USA). | ||
| Fig. 2 Two nozzle configuration schematics of the commercial slurry nebulizer into which is introduced a fused-silica capillary. | ||
Two nebulizer chambers are used, a PFA total-consumption cylindrical nebulisation chamber (MC CE, Burgener Research Inc., Mississauga, Canada) and a 20 mL jacketed Cinnabar cyclonic spray chamber made of borosilicate glass (Glass Expansion).
The analytical measurements are realized on an Element 2 high resolution magnetic sector field ICPMS (Thermo-Scientific). The signal is acquired in the integration mode measuring 10 runs of 10 passes. The instrument is optimized every day with a 1 ppb multi-element nitric solution, until a 2-million cps peak height is obtained on uranium with a 100 μL min−1 Micromist nebulizer (Glass Expansion) with stability (RSD %) better than 1.5%.
5. Samples and solutions
To avoid corrosion effects, primary aerosol characterizations are not performed on nitric acid solutions but on water or on 35 g L−1NaCl water solution. Tertiary aerosol measurements are realized with 1 ppb of uranium in 2 M nitric acid. Uranyl nitrate is diluted from 1000 mg mL−1 standard solution (Spex Certiprep, Metuchem, NJ, USA) in spectrapure grade nitric acid solution (SCP Science, Courtaboeuf, France).6. Fused-capillary modified slurry nebulizer characteristics
The experimental device is based on a commercial nebulizer designed for slurries and suspensions at high liquid flow rates but used here at microflow rates. To compare this device with other nebulizers, the first thing is to calculate its geometrical characteristics (Table 1). For micronebulizers, the liquid gas interaction area (A) outside the nebulizer can be estimated according to the following equation:10| A = πdliqL = 5πdliqagaz | (2) |
| Nebulizer | Gas outlet cross-section area/mm2 | Liquid capillary inner diameter/mm | Capillary wall thickness/mm |
|---|---|---|---|
| HEN 8 | 0.011 | 0.10 | 0.03 |
| MCN 8 | 0.017 | 0.10 | 0.03 |
| MM 8 | 0.025 | 0.14 | 0.05 |
| DIHEN 10,15 | 0.0094 | 0.104 | 0.020 |
| Vulkan DIN15 | 0.0126 | 0.125 | 0.062 |
| Slurry nebulizer | 0.0092–0.0128 | 0.450 (without fused capillary) | 0.010–0.014 |
For the modified slurry nebulizer with fused-silica capillary inner diameter between 50 and 100 μm, the liquid gas interaction area varies between 0.009 and 0.019 mm2. This range has to be compared to the calculations realized by J L Todoli and Mermet,10 who found that the interaction area is about 0.160–0.250 mm2 for conventional concentric nebulizer and decreases down to 0.030–0.070 mm2 for commercial micronebulizers. The very small interaction area shown by the modified slurry appears as a handicap for the generation of fine droplets. This disadvantage is compensated by a high gas kinetic energy at the exit of the nozzle due to the presence of a thin gas annulus. For the modified slurry nebulizer studied here, the gas cross-section area is about 0.011 mm2, which appears to be in the range of most commercial micronebulizers. Compared to commercial nebulizers, this modified slurry nebulizer combines thus a very small liquid–gas interaction area with a rather high gas kinetic energy.
Results and discussion
Numerous approaches are mentioned in the literature for the nebulizer performance study but none of them seems to take precedence over the others. They show on the contrary complementarity. This is why this paper combines aerosol characterization and an analytical performance (ICP signal) study.1. Primary aerosol characterization
The first part of this study is dedicated to the characterization of the aerosol between the nozzle exit and a distance reaching 20 mm (except for ILIDS performed further). Light scattering interferometry was first tested but aerosol density at 1 μL min−1 was too low for measurement (not enough light reflected).Three alternative, more sensitive, techniques were then selected for characterization (shadowscopy, ILIDS and PIV). As mentioned previously, the setup allows modifications of both operating conditions (gas flow, sprayed solution composition) and instrumental parameters, that is, fused-silica liquid capillary inner diameter, tip shape and especially fused-silica capillary tip to nozzle distance value (e). In this section it was chosen to simplify the aerosol characterization by fixing the capillary inner diameter and tip shape (75 μm, flat-end capillary). The study is then focused on the influence of the nozzle configuration and comparison with literature data. With the same setup, it is thus possible to impose a configuration promoting prefilming with increased liquid–gas interaction by deeply recessing the liquid capillary tip inside the nebulizer body (chosen for the commercial PFA microflow nebulizer from Elemental Scientific Inc., Omaha, USA) or to impose a less recessed configuration for a nebulizer tip blockage risk minimization if working at high salt solution concentration (as proposed with Micronist Nebulizer Serie or MM from Glass Expansion, West Melbourne, Australia). This recessed configuration was also studied recently with the high performance concentric nebulizer or HPCN22 which was made of a commercial nebulizer and a tapered-end fused-silica capillary (Onizuka Glass/ST, Japan). The liquid capillary tip can also be made coplanar with the nebulizer orifice as in the high efficiency nebulizer (HEN) or with the direct injection high efficiency nebulizer (DIHEN, J.E. Meinhard Associates Inc., Santa Ana, CA). A protruding configuration can also be evaluated as for the microconcentric nebulizer or MCN (CETAC Technologies, Omaha, USA). This last configuration was also reported by A. Montaser et al.16 for a demountable direct injection high efficiency nebulizer or d-DIHEN equipped with a moving liquid sample fused-silica capillary positioned in a protruding configuration.
 | ||
| Fig. 3 Gas–liquid interaction for e = −0.1 mm (a), 0 mm (b), +0.1 mm (c), +1 mm and (d) at different time periods. Conditions: QG = 0.7 mL min−1, QL = 1 μL min−1. | ||
Fig. 4 shows typical PIV spray velocity distributions. The nebulizer tip is materialised as a rectangle, the nebulizer is vertically positioned, and velocity is measured on falling droplets. Close to the nebulizer tip, there is a continuous liquid jet not observable by the technique. The beam appears at around 3 mm from the nozzle, this distance is independent from the e distance in the range tested.
 | ||
| Fig. 4 PIV, water and NaCl droplet velocity maps. Experimental conditions: QG = 0.7 L min−1 except d: QG = 0.85 L min−1, QL = 1 μL min−1, a, b, and d: water, c: NaCl, fused-silica capillary inner diameter: 75 μm, flat tip. The grey rectangle indicates the nebulizer nozzle position. | ||
The e distance or nozzle configuration shows a great influence on the beam shape, droplet velocity distribution and on the relation between gas flow rate and droplet velocity. Three cases are described in the following sections: recessed capillary position (e < 0), coplanarity (e = 0) and finally protruding position (e > 0).
1.2.1 Recessed capillary position (e = −0.1 mm). Looking at the beam itself it appears that when the fused-silica capillary is recessed in the nebulizer body (e = −0.1 mm), the aerosol shape is an asymmetrical cone with a diameter reaching 8 mm at 19 mm from the tip (Fig. 4-a). Two high velocity zones are observed at 12 and 17 mm from the tip. The first high velocity zone is due to the droplet acceleration imposed by the argon gas flow expansion at the nozzle exit. In the lower velocity region separating the two high velocity zones, droplet coalescence may occur. After passing through this recombination zone, the droplets are re-entrained and accelerated again by the argon gas flow in the second high velocity zone. The PIV spray velocity mapping shown here is performed at a low gas flow rate but the influence of the gas flow was studied between QG = 0.7 L min−1 and QG = 1 L min−1. At high QG, the two distinct high velocity zones are replaced by a more complicated distribution in the form of several small areas located not only along the nozzle axis but also in more edging zones.
To examine the influence of gas flow rate, beam axis droplet velocity profiles are plotted. Fig. 5-a shows three profiles measured respectively at 0.7, 0.85 and 1 L min−1 gas flow rate between approximately 3 and 20 mm from the nozzle. Considering the variation curve obtained at QG = 0.7 L min−1, it appears that the droplet velocities increase regularly along the axis reaching about 11 m s−1 (first high velocity zone), diminishing and then re-increasing, reaching again 11 m s−1 (second high velocity zone). Increasing gas flow rate results in the appearance of multiple high velocity zones materialized as several local maxima. More globally the velocity variation curves show little dependence on gas flow rate variations. This observation agrees with the phenomenological descriptions by Sharp19 of a flow in a converging nozzle. In this description, the gas pressure (P) varies from the upstream pressure P0 (that is the reservoir pressure feeding the nozzle) to the downstream pressure (Pb) at the nozzle exit. The presence of a gas flow inside the nozzle entails a pressure drop not exceeding a critical value P* from which no further change in the flow state inside the nozzle is observed. The pressure adjustment occurs afterwards by lateral and longitudinal expansion outside the nozzle. This description shows that for a converging nozzle, an isentropic gas flow and experimental conditions above the critical pressure ratio (P0/Pb > 0.4871 for Ar), gas exit velocity does not vary with its upstream pressure. This phenomenological description could probably be a good basis to explain the observations described with a converging nozzle and a recessed nozzle configuration. The lack of gas velocity variation at the nozzle exit in the described model could entail a lack of droplet velocity variation when the gas flow changes.
 | ||
| Fig. 5 Droplet velocity profiles along the beam axis at three different nozzle configurations (a): recessed condition e = −0.1 mm, (b): planar condition e = 0, and (c): stick-out condition e = 0.1 mm. Experimental conditions: QL = 1 μL min−1, water; fused-silica capillary inner diameter: 75 μm, flat tip. | ||
This description is completed by off-axis droplet velocity profiles. These profiles are reported for QG = 1 L min−1 at two distances 6.3 mm (Fig. 6-a) and 15.4 mm (Fig. 6-b) from the nebulizer tip. The figures clearly highlight aerosol profile dissymmetry and droplet velocity reduction on the beam edge. As reported elsewhere for concentric nebulizers,41 this velocity reduction is due to the drag force acting upon the nebulization gas when moving into still gas at ambient temperature. This effect of course increases when moving outwards from the axis position. Decreasing the gas flow rate in the range tested deteriorates the beam symmetry even more and shows no influence on the amount of satellite droplets at the spray periphery which materialise as positive speed vectors (ascending droplets). The presence of these ascending satellite droplets is very detrimental as the solvent evaporation is probably higher in the aerosol fringe than in the axis region because of a lower droplet density. Evaporation plays a great part in the reduction of the droplets size especially at a low liquid flow rate and only droplets below 8 μm in diameter are said to usefully contribute to the signal to background ratio.19 Unfortunately even if these satellite droplets may certainly be fine enough to be analyzed, they are located in the fringe and show little probability of taking part in the ICPMS signal as their velocity and direction will not allow them to be directed towards the plasma.
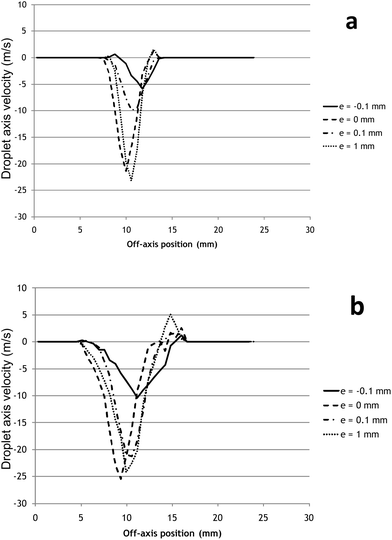 | ||
| Fig. 6 Influence of nozzle configuration on the off-axis droplet velocity profile (m s−1) performed by PIV at two distances from the nebulizer tip. (a): 6.3 mm and (b): 15.4 mm. Experimental conditions: QG = 1 L min−1, for other conditions see Fig. 5. | ||
1.2.2 Coplanar capillary position (e = 0 mm). As previously mentioned, the liquid and gas exit coplanarity (e = 0) is a configuration that is exploited in a few commercial nebulizers such as HEN42 or DIHEN.41 Moreover, the HEN and the modified slurry nebulizer setup described here show the same gas cross-section area, reinforcing the interest for this nozzle configuration. The PIV velocity mappings realized in the coplanar configuration show very dissymmetrical conical sprays with many ascending satellite droplets in the beam fringe, especially at a high gas flow rate (Fig. 4-d). Dissymmetrical aerosol plume has actually already been mentioned elsewhere for characterization of HEN.43 The presence of ascending droplets has also been reported before in the conical aerosol edge of a DIHEN.15,26,41,43 As mentioned in the previous section, these characteristics are detrimental to the spray quality and incompatible with high efficiency nebulization.
Looking more into details on the PIV mappings, it appears that just one zone of high velocity is observed, except at a low gas flow rate (0.7 L min−1) where a small high velocity area appears at 12 mm from the nozzle tip. This behaviour differs from the recessed configuration where an increase in the number of high velocity zones was observed at high flow rate.
If focusing on velocity profile variation curves, erratic variations of the velocity along the longitudinal axis are observed (Fig. 5-b). This is partly an artefact as the dissymmetry of the aerosol beam means that the longitudinal section is more at the edge of the high velocity zone than in its centre. Despite that, Fig. 5-b clearly illustrates the difference in behaviour between recessed and coplanar configurations. The gas flow rate strongly influences droplet velocities. Raising QG from 0.7 L min−1 to 1 L min−1 increases droplet velocity by a factor of 3 at an approximate 10 mm distance from the nozzle. At 1 L min−1 the droplet velocity can reach 30 m s−1 against 12 m s−1 in the same experimental conditions but in recessed capillary position. This result is coherent with those of other coplanar nebulizer studies also showing high droplet velocities. To illustrate this, axial mean velocities reaching up to 46 m s−1 have been measured at 15 mm from a HEN nozzle working at a 0.97 L min−1 gas flow rate.43 The off-axis velocity profiles show high heterogeneity of droplet velocity with very rapid droplets along the beam axis and ascending satellite droplets at the edge (Fig. 6). It seems then that liquid and gas coplanar exit disturbs gas flows which adjust to atmospheric pressure by lateral and longitudinal expansion outside the nozzle. These adjustments lead to chaotic instabilities which are probably softened by nebulisation chambers in the case of a tertiary aerosol. Thus, the efficiency of coplanar nebulizers can probably be ascribed to the high kinetic energy of the droplets in a disrupted, poorly homogeneous aerosol where the instability is weakened by the use of a nebulisation chamber.16
1.2.3 Protruding capillary position (0.1 mm < e < 1 mm). The last configuration consists of a capillary tip protruding slightly beyond the nozzle (e = 0.1 mm). Even if rarely exploited, this design is mentioned before in the microconcentric nebulizer or MCN and in at least one study on the d-DIHEN.16 In this case, the nebulisation takes place at a given distance from the gas outlet, the liquid interacting with an expanded gas as in a cross-flow nebulizer.19 The aerosol plume appears to be restrained with an almost constant diameter (5 mm) when reaching 15 mm tip distance, showing a dimension comparable to those reported elsewhere on DIHEN at a high gas flow rate27 but a much smaller aerosol cone diameter than reported for commercial concentric micro-nebulizers working at low liquid uptake rates (5–160 μL min−1) (Fig. 4-b). In that case, the spatial characterization of a MCN gives cone diameters measuring 10 mm at 5 mm from the tip.8 This observation is of importance as divergent sprays include a large proportion of droplets with nonappropriate directions for entering the plasma. In contrast, in the case of restrained beams, the low aerosol expansion results in a high density spray favourable to coalescence but balanced by the solvent evaporation rate. Pulling the liquid capillary 0.1 mm out of the nozzle induces a reduction of the satellite droplet amount especially at a high gas flow rate (QG = 1 L min−1). In this condition, a unique high velocity region is present on the PIV map. The axis velocity profiles show that the influence of gas flow rate on droplet velocity in protruding conditions is similar to the recessed nozzle configuration, that is, droplet velocities are independent of the gas flow (Fig. 5-c). The axis mean droplet velocity reaches 20 m s−1 at its maximum, which appears as an intermediate speed between the recessed configuration (12 m s−1) and the coplanarity (30 m s−1). Compared to coplanarity, the off-axis velocity mapping study also shows a reduction of the speed heterogeneity with a flatter radial profile (Fig. 6). In conclusion, slightly protruding the liquid capillary tip outside the nozzle tip induces the formation of a homogeneous focused beam aerosol with a lower mean droplet velocity. This is in agreement with the literature data16 that also report lower mean droplet velocities, especially at low liquid and gas flow rates with the d-DIHEN (e = +0.1 mm) if compared to classical DIHEN or large-bore DIHEN, both of these last nebulizers exhibiting a planar configuration.
When the fused-silica capillary is even more pulled out of the nozzle (e = 1 mm), the spray degrades but remains very focussed even if an increase of satellite droplets number is observed. The high velocity region is moved closer to the nebulizer tip without any modification of the droplet velocity limit.
1.2.4 Influence of sprayed solution. The influence of the solution composition on the aerosol characteristics is studied by replacing water by NaCl solutions. Nitric acid would be more representative but could be detrimental to the optical instrument integrity. The first results showed that the nozzle configuration plays a great part in terms of droplet velocity and beam shape also in the case of NaCl. In that case, velocity mapping studies are thus performed for each of the e values previously described for water but only at a low gas flow rate (0.7 mL min−1).
In the recessed capillary configuration (e = −0.1 mm), the nebulization of a NaCl solution does not show any significant axial velocity modification compared to water. The beam remains dissymmetrical with a backflow of liquid in the edges. In the coplanar nozzle configuration, the velocity mapping, in contrast, highlights an influence of the solution composition on beam shape and droplet velocity. The presence of NaCl induces a velocity increase and a displacement of the high speed region towards the nebulizer tip. In the region located between 6 and 14 mm from the tip, the axis velocity increases up to 16 m s−1 instead of ranging between 6 and 10 m s−1 for water. When the capillary slightly protrudes from the nozzle tip (e = 0.1 mm), important modifications of the aerosol characteristics are observed when compared to water. When no backflowing droplets are present, the beam is very symmetrical and a single high velocity region is observed. The maximum droplet axis velocity remains unchanged reaching 18 m s−1 but the high velocity region is located closer to the nebulizer tip, 9 mm from the nozzle against 13 mm in the same operating conditions for the water aerosol. Sticking out the capillary up to 1 mm entails a degradation of the beam shape and a droplet velocity collapse. The maximum velocity does not exceed 15 m s−1 against 20 m s−1 in the same conditions for water.
In conclusion, the nature of the solution modifies the velocity mapping results in terms of velocity and beam shape, in general degrading the aerosol characteristics except if the fused-silica capillary is slightly protruding from the nozzle. At e = 0.1 mm, replacing pure water with a NaCl solution even entails an improvement in aerosol characteristics providing the most homogeneous aerosol of this study (Fig. 4-c).
The spray is characterized here in terms of water droplet size distribution at constant gas (0.85 L min−1) and liquid flow rates (1 μL min−1). This study is realized by ILIDS on two (radial) surfaces situated at 50 and 80 mm from the nebulizer tip and for two geometries (coplanarity e = 0 and protruding e = +1 mm). It is always interesting to perform droplet size distribution as close as possible to the nebulizer tip to eliminate the influence of the solvent evaporation on the primary aerosol characteristics. The first surface is located at the closest distance experimentally compatible with the technique, that is, where droplet density allows visualization of individual droplet surfaces. Fig. 7 shows a comparison between the two nozzle geometries at 80 mm from the nebulizer tip. On these two distributions, only monomode droplet populations are observed. The same result is obtained at 50 mm from the nebulizer tip. These sharp droplet populations stretch roughly from 2 to 12 μm with no droplet with diameter inferior to 2 μm, probably because fission after electrical repulsions combined with evaporation rate at these liquid and gas flow rates leads to the fast disappearance of the finest droplets. In the coplanar configuration, the proportion of droplets with diameter smaller than 8 μm is 93% in both radial surfaces. This performance in terms of droplet size distribution remains unchanged when the fused-silica capillary is largely pulled out of the body with 94% of droplets under 8 μm at both 50 and 80 mm from the nozzle. Of course the amount of droplets in some size classes differs from one configuration to the other but globally droplet size distributions do not seem to vary significantly with the distance or the nozzle configuration.
 | ||
| Fig. 7 Droplet size distribution measured by ILIDS at an 80 mm nozzle distance for two nozzle configurations. Conditions: e = 0 mm and e = 1 mm, QG = 0.85 mL min−1, QL = 1 μL min−1. | ||
The literature does not seem to report primary aerosol droplet size distribution at such liquid low-flow rates, making comparison difficult. Characterization of the two direct-injection nebulizers realized at 5 and 15 mm from the nebulizer nozzle by light-scattering interferometry has been reported but at higher liquid flow rates (85–90 μL min−1). In these conditions, the liquid flow rate is too high for complete solvent evaporation by the argon stream. At 5 mm from the tip, the droplet size distribution ranges from 1 to 80 μm for the Vulkan DIN (e < 0). For the DIHEN (e = 0), two-mode droplet size populations were observed with diameters ranging from 1 to 35 μm and from 65 to 80 μm.15,41 In the HPCN study (e < 0) realized at a much lower liquid flow rate (5 μL min−1), two populations of droplets are also obtained but centred around lower values (2.5 μm and 10 μm).
The absence of obvious influence of the nozzle configuration on the droplet size distribution is in contradiction with the work of Coggins and Baker20 and also with a previous primary aerosol characterisation realized with a MCN (e > 0).8 In these two cases, the liquid capillary positioning outside the nebulizer body entails the production of coarser droplets. This phenomenon is explained as a diminution of liquid–gas interaction efficiency due to the kinetic energy gas loss produced by the expansion of the gas stream at the nebulizer vent. This is not observed here probably because the reduced liquid flow leads to a good liquid–gas interaction with a slim liquid vein inside a high gas flow. Another explanation could be the length of the observation distance imposed by the ILIDS allowing the evaporation process to level off the difference that could be induced by nozzle configuration on the droplet size distribution. But in this case, this should be confirmed by a lack of influence of nozzle configuration on the analytical signal which is not observed here. Conversely this lack of geometry influence is in agreement with the work of Nukiyama and Tanasawa on a modified slurry nebulizer.19,21 From their work based on jet-injection nebulizers, they proposed an equation often used to predict the Sauter mean diameter (d0) for an analytical ICP nebulizer. This relation is often applied even out of its initial validity range (which is also the case here) as the equation was first developed for low gas velocities; but it has since shown its use to predict droplet sizes generated by supersonic flows.45 In this relation, d0 is only related to liquid and gas flow rates and velocity differences but not to the shape or size of liquid and gas nozzles. This is in accordance with the results obtained here. More precisely, the mean Sauter diameter measured at 50 mm and 80 mm from the nozzle for e = 0 and e = 1 is about 10 μm. The mean Sauter diameter calculated here from this equation for water and argon at QL = 1 μL min−1 and QG = 0.85 L min−1 is 18 μm assuming that the gas velocity reaches Mach 1 (276 m s−1 for argon) during the isentropic gas expansion at the nozzle exit. It has to be pointed out that the second term of the Nukiyama and Tanasawa equation is negligible under our conditions, reducing the calculation to an accurate determination of the argon velocity. Anyway, the discrepancy between calculated and experimental values is in the standard range.19
2. Tertiary spray characterization through analytical ICPMS performances
The second part of this study is dedicated to the impact of the different nebulizer geometries on the ICPMS 238U signal via the production of a tertiary aerosol. In this part of the work two supplementary parameters (fused-silica capillary inner diameter and capillary tip shape) are added and the influence of the e distance is explored between −0.5 mm and +1 mm with increments of 0.1 mm. Studying a tertiary aerosol involves choosing a nebulisation chamber which plays a great part in the signal amplitude. To characterize this nebulisation setup as generally as possible, two different nebulisation chambers are successively studied, i.e. a low-volume glass cyclonic nebulisation chamber and a cylindrical nebulisation chamber.2.1.1 Influence of radiofrequency power and gas flow rate. The first experiments consisted of tuning ICPMS-HR instrumental parameters (nebulisation gas and the RF power) to obtain the best signal in terms of sensitivity. These experiments are performed on a nebuliser showing a coplanar configuration (e = 0) and a 50 μm inner-diameter and flat-end fused-silica capillary (Fig. 8). The best results in terms of signal sensitivity were obtained at 1.050 L min−1 and low RF power (750 W). At hot plasma RF power (1200 W), the signal (1 ppb, 1 μL min−1) was measured at 7000 cps (RSD 1%) with an oxide ratio, 238U16O/238U, of 0.4%. Decreasing the RF power increases the signal to a first plateau situated between 1000 and 900 W. Lowering the RF power down to cold plasma conditions (775 W) further increases the signal without stability loss (25
000 cps RSD 1.5%) but increases also the oxide ratio (238U16O/238U = 5%). This behaviour appears to be totally in contradiction with what is observed classically, that is a signal decrease in cold plasma conditions. In order to confirm these observations, the 50 μm inner-diameter capillary is replaced by a 100 μm one, keeping the nozzle configuration and gas flow rate unchanged. This replacement shows no influence on the optimum RF power. The only difference is the oxide ratio. 238U16O/238U then reaches 10% at 775 W showing the importance of the liquid linear velocity at the nebulizer nozzle exit on the liquid–gas mixing and thus on the oxide ratio. These results are actually in agreement with those reported when coupling an ICPMS with a low flow micro-cross-flow nebuliser (MCFN) sited directly on a chip.6 In the case of an on-chip cross-flow nebulizer, the optimum RF power was 925 W. The authors explained that this was due to the low liquid flow rate (5 μL min−1) hence drier plasma conditions. In our opinion, this is more likely due to the low droplet velocities produced by cross-flow also observed on the modified slurry because of a relatively large gas cross-sectional area producing a low kinetic energy gas expansion. Our explanation seems to be in contradiction with the results of Fig. 8. In the case illustrated, replacing the 50 μm inner capillary diameter by a 100 μm one did not induce any modification in the signal variation. It is probable that replacing the capillary did not change enough the liquid velocity explaining the lack of influence of the inner diameter in this range. The literature also reports several examples of microflow nebulizer studies which give good results in terms of sensitivity without needing a low RF power.11,33,46 In these cases, the inner liquid capillary diameter appears to be very narrow. To confirm our explanation, a 20 μm inner diameter capillary is introduced in the nebulizer body in a coplanar configuration. This results in a drastic signal decrease and also a diminishing of RF plasma power influence on the low signal observed. In this condition, the nebulizer sensitivity is poor but it is possible to work in hot plasma conditions without diminishing excessively the signal.
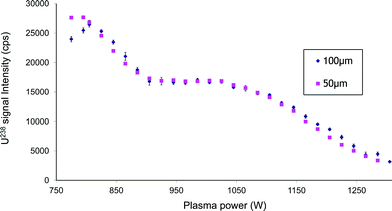 | ||
| Fig. 8 Influence of plasma power on signal intensity for two liquid capillary inner diameters. Experimental conditions: nozzle configuration: coplanar (e = 0), cyclonic chamber, QG = 1.05 L min−1, QL = 1 μL min−1, solution: U 1 ppb in HNO3 2 M. | ||
The influence of the capillary tip shape is also explored. The 50 μm flat end fused silica capillary was replaced by a tapered-end capillary of the same inner diameter. The study of the RF power influence gives results similar to those observed with a flat-end capillary with a two-plateau curve but a higher instability and a poorer sensitivity.
The variation of the nebulisation gas flow rate shows a bell-shaped curve with a maximum at 1.050 L min−1 of argon independent of the capillary inner diameter in the 20–100 μm range (flat-end capillary).
2.1.2 Nebulization chamber temperature influence. The effect of temperature was studied in the range of 10 to 75 °C. The results showed a signal increase between 10 and 30 °C, where a plateau was reached. This can be explained by the absence of solvent saturation of argon at the very low liquid flow rate of the working conditions. In other terms, this confirms the fact that there is no need to boost the evaporation process at such liquid and gas flow rate ratios.
2.1.3 Nozzle configuration (e distance) influence. This part of the study involving a cyclonic chamber is devoted to the influence of the distance e on the ICPMS signal sensitivity and stability. The ICPMS measurement being less time consuming than the primary spray characterisation, e was studied on a larger range (−0.5 mm to +1.5 mm) with increments of 0.1 mm. An example of signal variation versus distance e for an internal capillary diameter of 75 μm is shown in Fig. 9. It has first to be pointed out that, if the nozzle configuration plays a great part in the signal intensity, it has no influence on the oxide ratio or the signal stability except when the liquid capillary is deeply recessed inside the body (between −0.25 and −0.5 mm). When the capillary is deeply recessed in the nebulizer body, the instability rises up to 5% against less than 2% in the other nozzle configurations.
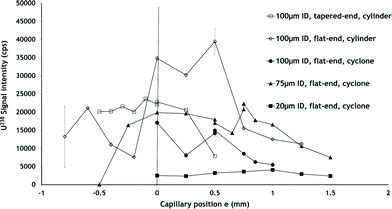 | ||
| Fig. 9 Influence of nozzle configuration on a uranium HR ICPMS signal for different liquid capillaries and nebulization chambers. Experimental conditions: QL = 1 μL min−1, solution: U 1 ppb in HNO3 2 M. | ||
Focusing on signal intensity, setting a negative e leads to a signal decrease which is amplified when the capillary is even more recessed inside the nozzle body. This is in agreement with primary nebulisation zone observations realized by shadowscopy where the presence of instable waves is visible. These analytical results are also in accordance with the primary aerosol characterization performed at e = −0.1 mm where a large droplet heterogeneity in terms of directions and velocity is observed. Pulling the capillary outside the nebulizer body in the range 0 to +1.5 mm also entails a slow decrease of the signal intensity. In the coplanar configuration the 238U signal reaches 19850 cps against 16500 cps at e = 1 mm. It is difficult to precisely correlate the sensitivity obtained on a tertiary aerosol to the primary aerosol characteristics but the signal decrease observed could be more easily understood by the PIV mappings or the shadowscopy primary nebulisation zone visualisation than by the droplet size distributions. The droplet size distribution may not be the most important parameter in the case of micro-flow aerosols.
This monotonous variation observed between e = 0 and e = 1.5 mm is broken at e = 0.75 mm by a sudden increase in the signal intensity which shows no impact on stability. The presence of this optimum e distance in terms of signal intensity has no explanation at this time. It can nevertheless be linked with the improvement observed in terms of aerosol homogeneity observed by PIV and shadowscopy in slightly protruding nozzle configuration. It would of course have been interesting to study droplet size distribution, PIV maps and shadowscopy at this specific value, instead of 0.1 mm.
2.1.4 Flat-end inner capillary diameter influence. Complementary experiments on tertiary aerosol are realized studying the influence of the capillary inner diameter on the signal with various nozzle configurations (Fig. 9). Two capillaries with 100 μm and 20 μm inner diameters are used respectively. The variation curve shows a shape similar to those obtained with the 75 μm inner diameter capillary but with lower signal intensity. The most interesting fact is probably that it is possible to define an optimal e value for each inner liquid capillary diameter. The narrower the capillary, the larger the e value should be to get the optimal ICPMS signal. This observation may then be of interest for designing very narrow bore nebulizers for microlitre liquid flow, which should be rather different from today's commercial devices. These results also confirm once again those obtained before by A. Montaser's group showing an increase in sensitivity, precision and detection limit especially at low solution flow rates when choosing the d-DIHEN with a +0.1 mm protruding nozzle configuration rather than coplanar nozzle solutions (DIHEN and LB-DIHEN).16
000 cps were measured. This value has to be compared to the signal obtained in the same conditions with the cyclone chamber (20000 cps) and to the signal classically measured (2000000 cps) on our instrument at 100 μL min−1 with a Micromist glass nebulizer (AR40-1-FM01E, QL = 100 μL min−1). Taking into account the performances of the sector-field mass spectrometer used for this study, this modified slurry nebulizer setup shows performances in terms of sensitivity which are good compared to the performances of other low liquid flow rate nebulizers reported. The signal stability is however quite poor reaching 9% (RDS) at the optimum e value. This position is an exception as the stability for e increasing from 0 and 1 mm whatever the position studied (except the optimum e) is ranging between 1.3 and 1.8%. This is a difference between the cyclonic and the cylindrical nebulisation chamber as the nozzle configuration shows no influence on the signal stability for the cyclonic chamber except at deeply recessed positions. This difference between the two chambers is very probably due to the flexible connection between the chamber and the torch injector which includes a Teflon tubing that turned out to be very difficult to use as the smallest movement could entail a signal decrease or even disappearance. This point has to be fixed in the future by the fabrication of a more robust cylindrical nebulisation chamber.
2.2.1 Nozzle configuration (e distance) and RF power influence. The study performed with the cyclone chamber is partly repeated with the cylindrical chamber. The influence of the nozzle configuration on the ICPMS signal shows exactly the same variation with the same curve break at e = 0.75 mm for a 75 μm ID flat-tip capillary. The influence of the RF plasma power is also confirmed.
2.2.2 Fused-silica capillary tip shape influence. The comparison between flat-end capillaries and tapered-end capillaries of the same internal and external diameters could not be performed with the cyclone chamber, as the signal measured with the tapered-end capillary was too low to be easily exploited. This may be due to a modification of the aerosol cone shape and droplet velocities influenced by the capillary end shape entailing in that case a chamber inner wall aerosol loss increase. The comparison performed with the cylindrical chamber first highlights that, here also, the signal is much lower with tapered-end capillaries than with flat-end ones, except with a recessed capillary configuration where the signal could surpass the flat-end capillary but nevertheless without reaching the sensitivity obtained with a protruding flat-end tubing. This comparison secondly shows a lack of an optimal e in a protruding configuration if a tapered-end capillary is used: a monotonous decrease of intensity is observed when the tapered-end capillary is pulled out of the nozzle. This comparison between tapered and flat ends displays thus the influence of the gas expansion on the signal at the nozzle exit. When looking into the recessed configuration, the presence of a slight maximum at e = −0.1 mm can be observed with the tapered-end capillary. This is in agreement with the work of Inagaki22 where a slight tapered-end capillary recess is reported to improve the analytical signal.
The last part of this comparison is dedicated to the oxide ratio with both kinds of capillary as a function of e and gas flow rate. The oxide ratio can play a great part at low liquid flow rate when a needle or a tapered-capillary is employed for liquid delivery.33 The study confirms that the use of a tapered-end capillary induces an increase of the oxide ratio if compared to a flat-end arrangement. At high gas flow rates, the oxide ratio can reach 75% with a tapered end while never exceeding 15% in any of the experimental conditions tested and in most cases it is below 1% with a flat-end capillary. It has to be added that the oxide ratio, which is of course gas flow rate dependent, is surprisingly independent of the capillary position (e) depending mostly on the capillary end shape.
Conclusion
The nebulising solution proposed here including a commercial slurry nebulizer and a fused-silica capillary appears as a well-performing low cost system able to nebulize efficiently at a low liquid flow rate (1 μL min−1) and reducing inconveniences in the case of clogging (the capillary being just pulled out from the nozzle and the incriminated part cut away).From a more theoretical point of view, the influence of operating conditions (liquid and gas flow rates, temperature) and instrumental parameters (nozzle configuration, capillary tip shape, capillary inner diameter) can be studied with a single setup. The influence of the parameters is evaluated both on primary and tertiary aerosols bringing out several practical results even if the relation between the primary aerosol characteristics and the signal measured via a tertiary aerosol is not easy to establish precisely. Most of the results obtained here appear as a confirmation of previously reported fragmentary observations from fixed nozzle configuration nebulizer studies but reconsidering them in a more global perspective.
This study highlights the importance of the nozzle configuration i.e. the capillary to nozzle distance and the inner capillary diameter. The stick-out (e) parameter is crucial for the primary spray homogeneity in terms of droplet velocity distribution. It is also of prime importance for tertiary signal intensity and stability but has no influence on the oxide ratio. The great importance of this nozzle configuration on aerosol beam shape, droplet velocity, and signal intensity but not on the droplet size distribution highlights the fact that, at least at low liquid uptake, droplet size distribution may not be the most relevant criterion for analytical studies. The authors hypothesize that this may be linked to the evaporation capacity of the nebulising gas largely exceeding the liquid uptake, creating a situation fundamentally different to a larger liquid flow rate system. This study shows the influence of the nozzle configuration also via the inner diameter of the fused-silica capillary which seems to have an effect on the optimum RF plasma power with a drastic mass signal increase in cold plasma conditions compared to hot conditions when large-bore capillaries are employed. This study also displays the interest of using of a flat-end capillary (instead of a tapered-one which is the solution most commonly employed). It also highlights the existence of an optimum nozzle configuration in terms of sensitivity and stability, dependent on the capillary inner diameter.
Abbreviations
| CE | capillary electrophoresis |
| GC | gas phase chromatography |
| DIHEN | direct injection high efficiency nebulizer |
| d-DIHEN | demountable DIHEN |
| Vulkan-Din | Vulkan direct injection nebulizer |
| PEEK | polyethyl ethylene ketone |
References
- J. Petit, V. Geertsen, C. Beaucaire and M. Stambouli, J. Chromatogr., A, 2009, 1216, 4113–4120 CrossRef CAS
.
- J. Petit, J. Aupiais, S. Topin, V. Geertsen, C. Beaucaire and M. Stambouli, Electrophoresis, 2010, 31, 355–363 CrossRef CAS
- D. Schaumloffel and A. Prange, Fresenius' J. Anal. Chem., 1999, 364, 452–456 CrossRef CAS
- A. Prange and D. Profrock, Anal. Bioanal. Chem., 2005, 383, 372–389 CrossRef CAS
- M. R. Wang, K. H. Yang, C. H. Chiu and C. J. Yang, Mod. Phys. Lett. B, 2009, 23, 365–368 CrossRef CAS
- G. Pearson and G. Greenway, J. Anal. At. Spectrom., 2007, 22, 657–662 RSC
- D. Beauchemin, Mass Spectrom. Rev., 2010, 29, 560–592 CAS
- J. L. Todoli and V. Hernandis, J. Anal. At. Spectrom., 1999, 14, 1289–1295 RSC
- J. L. Todoli and J. M. Mermet, J. Anal. At. Spectrom., 2002, 17, 345–351 RSC
- J. L. Todoli and J. M. Mermet, Spectrochim. Acta, Part B, 2006, 61, 239–283 CrossRef
- C. Rappel and D. Schaumloffel, J. Anal. At. Spectrom., 2010, 25, 1963–1968 RSC
- D. Schaumloffel, J. R. Encinar and R. Lobinski, Anal. Chem., 2003, 75, 6837–6842 CrossRef
- D. Schaumloffel, P. Giusti, J. Szpunar and R. Lobinski, Patent WO 2006/131626 A2, 2006.
- J. Zhu and D. R. Wiederin, Patent 5,597,467, 1997.
- D. Goitom and E. Bjorn, J. Anal. At. Spectrom., 2006, 21, 168–176 RSC
- C. S. Westphal, K. Kahen, W. E. Rutkowski, B. W. Acon and A. Montaser, Spectrochim. Acta, Part B, 2004, 59, 353–368 CrossRef
- D. Maldonado, J. Chirinos, Z. Benzo, E. Marcano, C. Gomez, J. Salas, M. Quintal and G. D'Suze, Microchim. Acta, 2008, 162, 93–99 CrossRef CAS
- C. S. Westphal and A. Montaser, Spectrochim. Acta, Part B, 2006, 61, 705–714 CrossRef
- B. L. Sharp, J. Anal. At. Spectrom., 1988, 3, 613–652 RSC
- S. Coggins and E. A. Baker, Ann. Appl. Biol., 1983, 102, 149 Search PubMed
- A. Gustavsson, Spectrochim. Acta, Part B, 1983, 38, 995–1003 CrossRef
- K. Inagaki, S. Fujii, A. Takatsu and K. Chiba, J. Anal. At. Spectrom., 2011, 26, 623–630 RSC
- K. Jorabchi, K. Kahen, C. Gray and A. Montaser, Anal. Chem., 2005, 77, 1253–1260 CrossRef CAS
- K. Jorabchi, R. G. Brennan, J. A. Levine and A. Montaser, J. Anal. At. Spectrom., 2006, 21, 839–846 RSC
- K. Kahen, K. Jorabchi, C. Gray and A. Montaser, Anal. Chem., 2004, 76, 7194–7201 CrossRef CAS
- J. A. McLean, M. G. Minnich, A. Montaser, J. Su and W. Lai, Anal. Chem., 2000, 72, 4796–4804 CrossRef CAS
- M. G. Minnich, J. A. McLean and A. Montaser, Spectrochim. Acta, Part B, 2001, 56, 1113–1126 CrossRef
- K. Jankowski, A. Karas, D. Pysz, A. P. Ramsza and W. Sokolowska, J. Anal. At. Spectrom., 2008, 23, 1290–1293 RSC
- J. Koch, S. Schlamp, T. Rosgen, D. Fliegel and D. Gunther, Spectrochim. Acta, Part B, 2007, 62, 20–29 CrossRef
- J. A. McLean, R. A. Huff and A. Montaser, Appl. Spectrosc., 1999, 53, 1331–1340 CrossRef CAS
- S. Murdock, K. Kahen, J. R. Chirinos, M. E. Ketterer, D. D. Hudson and A. Montaser, J. Anal. At. Spectrom., 2004, 19, 666–674 RSC
- F. Vanhaecke, M. VanHolderbeke, L. Moens and R. Dams, J. Anal. At. Spectrom., 1996, 11, 543–548 RSC
- P. Giusti, R. Lobinski, J. Szpunar and D. Schaumloffel, Anal. Chem., 2006, 78, 965–971 CrossRef CAS
- P. Giusti, Y. N. Ordonez, C. P. Lienemann, D. Schaumloffel, B. Bouyssiere and R. Lobinski, J. Anal. At. Spectrom., 2007, 22, 88–92 RSC
- A. R. Glover, S. M. Skippon and R. D. Boyle, Appl. Opt., 1995, 34, 8409–8421 CrossRef CAS
- G. Konig, K. Anders and A. Frohn, J. Aerosol Sci., 1986, 17, 157–167 CrossRef CAS
-
T. Kawaguchi, T. Kobayashi and M. Maeda, Laser Techniques for Fluid Mechanics, 2002, pp. 209–220 Search PubMed
- C. Mounaim-Rousselle and O. Pajot, Part. Part. Syst. Charact., 1999, 16, 160–168 CrossRef
-
A. Quere, P. Lemaitre, M. Brunel, E. Porcheron and G. Grehan, Meas. Sci. Technol., 2010, 21, 15306, 1–9 Search PubMed
- H. C. Vandehulst and R. T. Wang, Appl. Opt., 1991, 30, 4755–4763 CrossRef CAS
- D. Goitom and E. Bjorn, J. Anal. At. Spectrom., 2007, 22, 250–257 RSC
- B. A. Meinhard, D. K. Brown and J. E. Meinhard, Appl. Spectrosc., 1992, 46, 1134–1139 CAS
- H. Y. Liu and A. Montaser, Anal. Chem., 1994, 66, 3233–3242 CrossRef CAS
- J. W. Olesik and L. C. Bates, Spectrochim. Acta, Part B, 1995, 50, 285–303 CrossRef
- M. D. Bitron, Ind. Eng. Chem., 1955, 47, 23–28 CrossRef
- M. Grotti, F. Soggia and J. L. Todoli, Analyst, 2008, 133, 1388–1394 RSC
| This journal is © The Royal Society of Chemistry 2012 |