Determination of mass-dependent variations in nickel isotope compositions using double spiking and MC-ICPMS
Louise
Gall
*a,
Helen
Williams
ab,
Christopher
Siebert
a and
Alex
Halliday
a
aDepartment of Earth Sciences, University of Oxford, Oxford, OX1 3AN, U.K. E-mail: louise.gall@earth.ox.ac.uk; Fax: +44 (0) 1865 272 072; Tel: +44 (0) 1865 272 049
bDepartment of Earth Sciences, Durham University, Science Labs, Durham, DH1 3LE, U.K
First published on 22nd November 2011
Abstract
We present a new technique for the accurate and precise determination of mass-dependent variations in nickel isotope compositions in geological materials. Our method involves an ion-exchange procedure comprising three columns and utilising the ability of Ni to form strong complexes with both ammonia and dimethylglyoxime. The separation procedure is independent of sample pH and works even for samples with large matrix to analyte ratios. Processed Ni solutions are free of matrix elements and direct isobars of Ni, and the yield is normally 85–95%. The purified Ni solutions were analysed using a Nu Plasma, multi-collector inductively coupled plasma mass spectrometer (MC-ICPMS), where instrumental mass fractionation—together with potential isotopic fractionation during chemical separation due to incomplete yield—was corrected for by a double-spike technique, where samples were spiked prior to column chemistry. Tests performed on both mixtures of synthetic and natural terrestrial standards demonstrates that the method is accurate. Replicate measurements of USGS reference materials (peridotite PCC-1, basalt BHVO-2, and shale SCo-1) yield a long-term external reproducibility (2 s.d.) of typically ± 0.07‰, ± 0.1‰, and ± 0.14‰ for 60Ni/58Ni, 61Ni/58Ni, and 62Ni/58Ni respectively.
1 Introduction
Isotopic variations of the first row transition metals are of particular interest due to their abundance in geological samples and their utilisation in many biological processes. Nickel (Z = 28) has five stable isotopes, 58Ni, 60Ni, 61Ni, 62Ni, and 64Ni, with respective natural abundances of 68.0769%, 26.2231%, 1.1399%, 3.6345%, and 0.9256%.1 Relatively few studies have addressed mass-dependent variations in Ni isotopes, in contrast to other transition metal isotope systems, such as iron and molybdenum,2 which in part reflects the difficulty of purifying Ni from geological samples. Recent research into Ni isotope geochemistry has almost exclusively focused on extraterrestrial samples, searching for nucleosynthetic anomalies and radiogenic 60Ni—the decay product of the extinct nuclide60Fe.3–5In this study, we present a method for Ni separation from geological matrices and isotopic analysis of mass-dependent Ni isotope variations by multi-collector inductively coupled plasma mass spectrometer (MC-ICPMS), employing a Ni double spike to correct for instrumental mass bias and possible fractionation during separation. Nickel is the seventh most abundant transition metal in the Earth's crust, incorporated in both sulphide and silicate minerals and present in most geological reservoirs. Although Ni can posses a range of different oxidation states (from 0 to +IV) it is essentially only present in the +II state in natural samples. This lack of change in oxidation state with redox reactions renders Ni distinct from most other first row transition metals. Instead, Ni isotope fractionation may be caused by changes in speciation or coordination, making it an interesting addition to the already established field of non-traditional stable isotopes. Nickel also plays a key role in several enzymes important for the carbon cycle, including methane production and uptake of nitrogen during primary productivity,6 which makes Ni a necessary element for geologically interesting biological reactions.
As in other stable isotope systems, Ni isotope ratios are expressed in the delta (δ) notation as permil (‰) deviations in isotope ratios (nNi/58Ni, where n = 60, 61, or 62) relative to those of a pure Ni standard. The isotopic reference material used is a pure Ni metal from NIST (SRM 986). 58Ni is both the most abundant isotope and the isotope of lowest mass, which is why isotope ratios are expressed using 58Ni in the denominator.
 | (1) |
2 Materials and methods
2.1 Sample preparation and dissolution
All chemical work during sample preparation was performed under clean laboratory conditions at the Department of Earth Sciences in Oxford. All acids (HCl, HNO3, HF) used in the procedure were purified by in-house sub-boiling distillation. Solutions of dimethylglyoxime (DMG), ammonium citrate ((NH4)2C6H6O7) and sodium hydroxide (NaOH) were prepared from crystalline commercial reagents, ammonia solution (NH4OH), acetone and ethanol were reagent grade solutions, and dichloromethane (DCM) used for solvent extraction was of trace element grade—all from Fischer Scientific. Any water added during chemistry was 18.2 MΩ-grade taken from a Milli-Q Element water purification system.For testing and initial comparison of different separation methods we used a calibration solution made up of elemental ICP-standards (Alfa Aesar) of geologically important matrix elements (e.g.Mg, Al, Ca, Fe, Ti, Mn) and elements with single or doubly charged species with charge/mass ratios overlapping with those of the Ni-isotopes (e.g. Cd++ and Sn++), mixed in concentrations approaching the natural composition of silicate rocks. The final separation method was tested by processing a variety of geological samples of different matrices, mainly USGS reference materials.
Weighed in samples of silicate reference materials (approximately 0.1 g) were dissolved by conventional digestion methods, using concentrated HF–HNO3 mixtures, in a volume ratio of 5![[thin space (1/6-em)]](https://www.rsc.org/images/entities/char_2009.gif) :1, in pre-cleaned Savillex Teflon beakers. The samples were left on a hotplate at 130 °C overnight. The sample solution was evaporated to dryness and the residue dissolved in small amounts (0.2 ml) of concentrated HNO3 and left to evaporate. This procedure was repeated three times to completely drive off fluorides formed during the first digestion step. The last stage of digestion comprised refluxing the sample in approximately 5 ml 6 M HCl. This step was repeated twice if complete dissolution was not achieved in the first reflux cycle. During the whole digestion procedure the sample was treated several times in an ultrasonic bath for approximately 15 min at a time.
:1, in pre-cleaned Savillex Teflon beakers. The samples were left on a hotplate at 130 °C overnight. The sample solution was evaporated to dryness and the residue dissolved in small amounts (0.2 ml) of concentrated HNO3 and left to evaporate. This procedure was repeated three times to completely drive off fluorides formed during the first digestion step. The last stage of digestion comprised refluxing the sample in approximately 5 ml 6 M HCl. This step was repeated twice if complete dissolution was not achieved in the first reflux cycle. During the whole digestion procedure the sample was treated several times in an ultrasonic bath for approximately 15 min at a time.
Due to the high carbon content, USGS rock standard SCo-1 was digested in an Anton Paar Multiwave 3000 microwave. Approximately 0.1 g of sample was added to a pre-cleaned Teflon XF-100 vessel, to which were added concentrated acids as follows: 4 ml HF, 2 ml HCl, and 2 ml HNO3. The samples were digested for 1 h at 800 W, during which time the maximum pressure and temperature reached was 60 bar and 220 °C respectively. After full digestion the samples were transferred to pre-cleaned Savillex Teflon beakers and treated with multiple cycles of HNO3 and ultimately 6 M HCl, in a similar manner to other silicate samples.
2.2 Chemical separation
Quantitative separation and purification of Ni from geological matrices is particularly challenging due to the similarity in the chemical behaviour of Ni compared with a number of other elements that are abundant in geological samples, such as Na, Mg, and Ca. This difficulty is further exacerbated by the abundance of the latter elements in geological samples relative to Ni, which is most often present in trace quantities.As discussed above, previous Ni isotope studies have predominately focused on mass-independent isotope effects in iron meteorites,3,4,7,8 from which separation of Ni is straightforward. The procedure usually comprises a relatively simple anion-exchange chemistry in HCl media, and quantitative yields of Ni are not required as any isotopic fractionation during chemical processing is corrected using internal normalization to an assumed Ni isotope ratio. So far, only a few published studies7,9 have concerned analyses of mass-dependent Ni isotope variations. These studies employed a range of methods for the extraction of Ni from geological samples, which are mainly based on complexing Ni with DiMethylGlyoxime (DMG), an organic chelator highly selective for Ni under alkaline conditions. Quitte and Oberli7 proposed a solvent extraction method using DMG-in-ethanol and chloroform as the organic phase. Regelous et al.8 developed a three column set-up using a DMG-in-acetone mixture (originally based on Victor10), and Cameron et al.9 used a commercially available Nickel-Specific Resin by Eichrom Inc. (also suggested as an alternative in Quitte and Oberli7), which binds Ni to DMG in the resin polymer.
After testing the methods discussed above we found them not suitable for high precision analysis of mass-dependent Ni isotope fractionation. The DMG-in-acetone column procedure developed by Regelous et al.8 requires significant volumes of DMG per sample in order to fully separate Ni from Na, Mg and Ca, which display similar chemical behaviour to Ni. Such large quantities of DMG are potentially problematic as the Ni(DMG)2-complex must be completely broken down prior to further separation as Ni otherwise may be lost. Methods of Ni purification employing Ni-specific resin7,9 also involve large quantities of DMG, although in this case DMG is bound to the resin beads. In this technique, Ni is eluted in a mixture of DMG and resin polymer, which is very difficult to fully decompose. A further disadvantage of this method is that samples need to be adjusted to a particular pH before loading on the resin, and the success of the extraction procedure is highly dependent on sample pH.
Our method of Ni purification involves three steps of column chromatography and minimises the volumes of DMG to simplify the post-purification treatment of the sample. The first step involves separation of Ni from the s-block elements (e.g.Na, K, Mg, and Ca), and other geologically abundant cations (e.g.Al and Ti) by using a weak solution of di-ammonium citrate ((NH4)2C6H6O7) in combination with excess NH4OH. The chemical basis for this extraction method is that the excess ammonia binds to the more electronegative divalent ions present in the sample (e.g.Ni, Cu, Zn) by forming an ammonia-complex (e.g.Ni(NH3)2+4), which is strongly bound to the resin. Other elements (e.g.Mg, Al, Fe) prefer forming citrate complexes, which do not attach to the resin under these conditions and are eluted.11 The second step of our separation procedure removes remaining Mg, Ca, NH+4, Na, Al, Ti, and Cr and assures the complete removal of other remaining divalent elements. This step is adapted from Victor10 and Strewlow et al.12 and employs firstly oxalic acid-HCl solutions which separate elements with valences > + II (e.g.Fe, Al, Cr, and Ti) which elute as oxalic complexes, and subsequently HCl-acetone mixtures which elute divalent elements (e.g.Mn, Cu, Zn, Cd, Sn). Nickel is finally eluted as a Ni-DMG complex in HCl-acetone media. The final chromatography step is a miniature clean up anion-exchange column, which completely separates Fe from Ni using HCl–H2O2 mixtures. These procedures are described in detail below and summarised in Table 1.
| Col. 1(AG50W-X4) | Reagents/mixtures | volume(mL) |
|---|---|---|
| Equilibration: | 0.1 M NH4-citrate + 3 M NH4OH | 3 |
| Introduction: | Sample solution dissolved in: | |
| 2 ml 0.5 M HCl | ||
| + 0.3 ml 1M NH4-citrate | ||
| + 0.6 ml 15M NH4OH | 3 | |
| Cleaning step 1: | 0.1 M NH4-citrate + 3 M NH4OH | 1 |
| Cleaning step 2: | 0.4 M HCl | 1 |
| Elution of Ni: | 3 M HCl | 3 |
| Col . 2(AG50W-X4) | ||
| Equilibration: | 0.1 M HCl + 0.05 M oxalic acid | 1 |
| Introduction: | Sample solution dissolved in: | |
| 0.1 ml 1 M HCl | ||
| + 0.8 ml 18 MΩ H2O | ||
| + 0.1 ml 0.5 M oxalic acid | 1 | |
| Cleaning step 1: | 0.1 M HCl + 0.05 M oxalic acid | 2 |
| Cleaning step 2: | 0.5 M HCl + 95% acetone | 3 |
| Elution of Ni: | 0.5 M HCl + 95% acetone + 0.1 M DMG | 1 |
| Col . 3 ( AG1-X8 ) | ||
| Equilibration: | 6 M HCl + 0.5% H2O2 | 0.4 |
| Introduction: | Sample solution dissolved in | |
| 0.2 ml 6 M HCl + 0.5% H2O2 | 0.2 | |
| Elution of Ni: | 6 M HCl + 0.5% H2O2 | 0.2 |
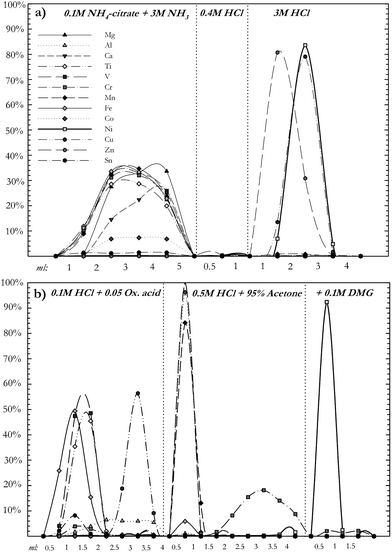 | ||
| Fig. 1 Calibration of the first two columns in the chemical separation procedure performed using column sizes and solvents as specified in Table 1. Both calibrations were performed using the same concentration of the calibration solution as described in the text. The results of the column calibration show that if a solution is passed through both columns all cations in the figure apart from Ni would be completely removed from the sample. | ||
2.3 Nickel yields and procedural blank
While this separation procedure delivers a very pure Ni fraction for isotope analysis, the final yield of Ni for samples using the full separation procedure varies depending on sample matrix. A sample with a low matrix-to-Ni ratio has a near quantitative yield (95–100%), while a sample with a high matrix-to-Ni ratio has a slightly lower yield (normally 85–95%). For example, a peridotite sample containing relatively high Ni concentrations (approximately 2000 ppm) will show close to 100% yield, but a basalt or shale sample containing only small amounts of Ni (approximately 10–30 ppm) will instead produce a yield of only 85%.To quantify the full procedural blank of the dissolution and complete chemical separation, a blank sample was processed together with every batch of geological samples. The blank ranged from 0.5 to 2.5 ng total Ni, which is negligible relative to the amounts of Ni processed for each sample (usually 5–10 μg). Both Ni yields and blank concentrations were determined by intensity measurements, relative to Ni standards of known concentrations, using MC-ICPMS.
3 Mass spectrometry
In this study we have focused on precise measurements of three stable isotope ratios: 60Ni/58Ni, 61Ni/58Ni, and 62Ni/58Ni. We do not report 64Ni/58Ni ratios due to potential interferences from 64Zn on this isotope. The Ni isotopic composition of all samples were analysed on a Nu Instruments Nu Plasma-HR, a multi-collector ICPMS, at the Department of Earth Sciences, Oxford. The instrument used for analyses is equipped with 12 Faraday collectors situated on a modified detector array to allow simultaneous measurement of all Ni isotopes of interest and monitoring of potential isobaric interferences. Table 2 shows both a normal and our modified detector array on the Nu Instruments Nu Plasma. Samples were usually run at a concentration of 100–200 ppb, introduced to the plasma via a microconcentric PFA nebulizer (ESI Scientific; 50μl min−1) coupled to a desolvator (Nu Instruments, DSN-100) in order to enhance sensitivity and minimise oxide formation. The desolvating system was washed by aspirating with 0.3 M HNO3 for 4 min between analyses. All isotopes were measured simultaneously in static collection mode. Each measurement consisted of a sequence of 40 cycles of 10 s integrations of the ion beam intensity. Electronic background noise was measured by ESA-deflection for 20 s prior to each analysis. Sample analyses were bracketed by analyses of NIST SRM 986 (pure Ni metal) at the same concentration, ±10%, as samples. Typical instrumental settings during analysis can be seen in Table 3.| 0 | — | 1 | — | 2 | 3 | 4 | 5 | 6 | 7 | 8 | IC | 9 | IC | 10 | IC | 11 |
| — | — | 62 | — | — | 61 | — | — | 60 | — | — | (59) | — | — | 58 | — | — |
| 0 | — | 1 | 2 | 3 | — | 4 | — | 5 | 6 | 7 | — | 8 | IC | 9 | 10 | 11 |
| 62 | — | — | 61 | — | — | 60 | — | — | (59) | — | — | 58 | — | — | 57 | — |
| Parameters | Setting |
|---|---|
| RF power | 1300 W |
| Acceleration voltage | 5.85 kV |
| Sampler cone | Ni, B-type, |
| (Nu Instruments) | 1.0 mm Ø |
| Skimmer cone | Ni, WA-type, |
| (Nu Instruments) | 0.7 mm Ø |
| Ar gas flow rates (l min−1): | |
| Coolant | 13 |
| Auxiliary | 0.8–1.0 |
| Nebuliser | 1.0–1.2 |
| Uptake rate (μL min−1) | 50–75 |
| Sample uptake time | 60 s |
| Background measurement time | 20 s |
| Cycle integration time | 10 s |
| No. cycles per analysis | 40 |
| Washout time | 300 s |
3.1 Correction of natural and instrumental mass fractionation
The double-spike technique is proven to be a highly robust and accurate means of correcting for instrumental mass fractionation (e.g.refs. 13–15). The double-spike method also has the advantage that, if added to the sample before chemical separation, any isotope fractionation during chemical processing is corrected for during data reduction, which is important for a sample of difficult matrix. The method can be used for any isotope system where the element has at least four naturally occurring isotopes. We here used the isotope ratios 60/58Ni, 61/58Ni, and 62/58Ni for data reduction.To theoretically evaluate the impact of different combinations of double-spike mixtures and sample/spike ratios on measurement precision, we used real Ni isotope analysis data (non-spiked), which was adapted for different spike additions and different spike–sample ratios. Our goal was to find a double-spike composition that resulted in high-precision measurements which were not highly sensitive to the spike–sample ratio. In our calculations we used the certified composition of the Ni isotope standard NIST SRM 986 as our true standard values, the Ni isotope composition of the enriched 61Ni and 62Ni spikes— metal powder provided by Oak Ridge National Laboratory, of >99% and >96% isotopic enrichment respectively— as our original spike components, and assumed that Ni follows the exponential fractionation law during instrumental fractionation. The calculations followed the data reduction procedure described in Siebert et.al.,16 and we further assumed a value of the instrumental fractionation of 2 and that the sample is a fractionated standard with a natural fractionation of 0.2. The results gave an optimal double-spike composition as a mixture of >25 %61Ni and <75% 62Ni and the optimal sample/spike ratio to be approximately 0.4 (i.e. 70% of the Ni should come from the double-spike).
In order to account for any impurities, both the reference standard and the double-spike solution were calibrated for all isotope ratios necessary for data reduction (60/58Ni, 61/58Ni, and 62/58Ni). The calibrations of both solutions were done using an external, peltier cooled, cyclonic spray chamber from Elemental Scientific (PC3–SSI). This appliance replaces the Nu Plasma's built in spray chamber and is very useful for spike calibrations as it reduces oxide formation and enhances sensitivity without creating artificial isotope fractionation as often seen in membrane desolvators. To correct for instrumental mass bias during the calibration we used external normalisation to a Cu ICP-standard solution, assuming natural abundances for the Cu isotopes (69.17% for 63Cu and 30.83% for 65Cu). Both the reference standard and the double-spike solution had matched Cu:Ni concentrations (1:2) and instrumental mass fractionation was corrected assuming the exponential fractionation law (following e.g. Marechal et al.17). As calibration of the double-spike is relative to calibration of the standard used, this correction method gives accurate results, even if the absolute isotopic composition of NIST SRM 986 is not precisely known. Five analyses of both solutions were measured in the same session and the averages of these analyses assumed as the isotope ratios of each solution relative to each other. In order to test whether our given sample/spike ratio of 0.4 is suitable, solutions of NIST SRM 986 doped with the double-spike solution in different sample/spike ratios were analysed. The results of these analyses are plotted in Fig. 2–3, which shows how most measured sample/spike ratios (0.3–2.0) give accurate results, although a low ratio (0.4–0.6) is preferred. The mathematical treatment of raw data follows Siebert et al.,16 assuming Ni follows the experimental fractionation law and calculating the isotope ratios by iteration of the instrumental and natural fractionation factors. Results normally converge after three iterations.
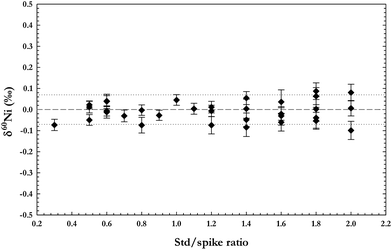 | ||
| Fig. 2 Data collected for mixtures of the Ni reference standard (NIST SRM 986) and the 61Ni-62Ni double-spike solution for a range of sample/spike ratios. Measured values for Ni solutions of all sample/spike ratios are within ± 0.07‰ of the accurate δ-value. | ||
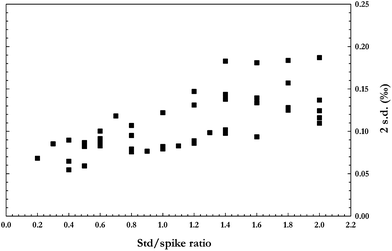 | ||
| Fig. 3 Data collected for mixtures of the Ni reference standard (NIST SRM 986) and the 61Ni-62Ni double-spike solution for a range of sample/spike ratios. The analyses show that a low sample/spike ratio provides lower errors. | ||
3.2 Isobaric interferences
When using a double-spike approach to correct for instrumental mass bias, the data reduction procedure assumes the sample to be a mass-dependently fractionated standard. This approach will therefore only work if there are no isobaric interferences present, as any interferences on the Ni isotope masses potentially could compromise the analysis, resulting in apparent mass-independent isotope fractionation.There are several possible isobaric interferences on the Ni isotope masses that need to be addressed, of which the most critical is the overlapping masses of 58Fe and 58Ni, especially since 58Ni is the denominator isotope in all ratios. Unfortunately, it is not possible to separate the mass peaks of 58Fe and 58Ni by using high-resolution settings on the mass spectrometer. The mass resolution (m/Δm) needed to efficiently separate these peaks is approximately 28,000, which is not possible to achieve with current analytical techniques. Instead, we correct for any background Fe in the desolvator, mass spectrometer, or analysis solution by measuring the 57Fe ion beam and calculating the theoretical contribution of 58Fe. For this we assumed that Fe isotopes fractionate to the same extent as Ni isotopes in the mass spectrometer and that both elements follow the exponential fractionation law. Fig. 4 shows measurements of a standard Ni solution doped with different amounts of Fe, and the analysis results both with and without the applied correction for the 58Fe contribution on 58Ni. The figure demonstrates that the Ni isotope compositions of the mixed solutions can be accurately corrected regardless of Fe concentration if using our correction protocol.
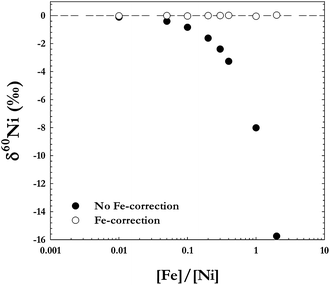 | ||
| Fig. 4 Analyses of a Ni standard solution doped with different amounts of Fe. The black circles are the measurements without correcting for the 58Fe interference on 58Ni, and the white circles are the same measurements after applying the correction. As the figure shows, any Fe present in the sample can be accurately corrected for. | ||
In addition to Fe, other potential interferences on the Ni isotope masses are double-charged ions of Cd, Sn, Te, and Xe (Table 4). Our chemical separation procedure effectively removes most of these elements from the sample, so no signals were detected when searching these mass ranges. Mass 59 was also continually monitored as the presence of a detectable 59 beam would indicate presence of 118Cd++ or 118Sn++. However, no beam above detection limits was observed on mass 59 for any samples or standards measured. Therefore double-charged ions of Cd and Sn were considered insignificant for our Ni isotope measurements.
| 58Ni | 60Ni | 61Ni | 62Ni | |
|---|---|---|---|---|
| Elemental: | 58Fe+ | |||
| Double- | 116Cd | 120Te ++ | 122Te ++ | 124Te ++ |
| charged: | 116Sn ++ | 120Sn ++ | 122Sn ++ | 124Sn ++ |
| 124Xe ++ | ||||
| Argides: | 22Ne36Ar+ | 24Mg36Ar+ | 25Mg36Ar+ | 24Mg38Ar+ |
| 22Ne38Ar+ | 20Ne40Ar+ | 21Ne40Ar+ | 26Mg36Ar+ | |
| 22Ne38Ar+ | 22Ne40Ar+ | |||
| Oxides: | 40Ar18O+ | 42Ca18O+ | 43Ca18O+ | 44Ca18O+ |
| 40Ca18O+ | 44Ca16O+ | 46Ti16O+ | ||
| 42Ca16O+ | ||||
| Hydroxides: | 40Ar17OH+ |
The most important polyatomic interference for Ni isotope measurements is 40Ar18O+, potentially present on the high mass end of 58Ni. Previous studies on Ni isotopes have used a higher resolution (m/Δm >2,500) setting to resolve this interference from 58Ni. During careful investigation of possible interferences on mass 58 at a pseudo-resolution of m/Δm ≃ 4,000, we did not find any detectable peaks that could correspond to 40Ar18O+ (or 40Ar17OH+). Because of this all our measurements were made in the low resolution mode. However, when performing an analysis while only aspirating 0.3 M HNO3 a measurable background in the range of 0.5–5mV on all Ni masses does show. This small signal was interpreted as the instrumental blank originating from the cones, as ICPMS sampler and skimmer cones typically are made of Ni. Tests using custom made in-house aluminium skimmer and sampler cones showed that Ni cones account for ∼50% of this background Ni, with the remaining background presumably originating from other stainless steel components of the mass spectrometer. As also reported by Quitte and Oberli7Al cones give lower sensitivity and poorer reproducibility which is why Ni cones were preferred here, although they do contribute towards the Ni background. The background is, however, constant and does not seem to affect the measurements as no bias was detected between analyses involving an on-peak-zero background measurement in blank acid compared to analyses where the background measurement was carried out by ESA deflection.
4 Results and discussion
4.1 Isotope fractionation associated with the analytical procedure
In order to test our chemical separation technique aliquots of spiked Ni solution (NIST SRM 986) were processed and compared to the same non-processed spiked standard reference solution. Analyses of the isotopic composition of the chemically processed standards are shown in Fig. 5. Isotopic ratios of all processed reference solutions were identical to the untreated standard within errors, demonstrating that the chemical separation does not result in any additional instrumental matrix effects, or that any such fractionation effects are corrected for by our double-spike method.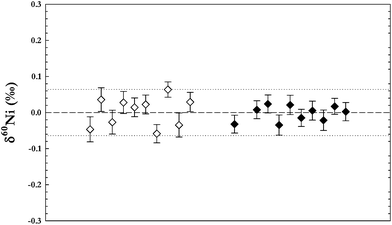 | ||
| Fig. 5 Measurements of the Ni standard NIST SRM 986 to test chemical separation procedure. Open symbols are a mixture of SRM 986 and the artificial calibration solution (plasma standards, Alfa Aesar, see text for more information) put through the separation procedure. Closed symbols are the SRM 986 on its own put through the separation procedure. Error bars are 2 s.e. of individual measurement. Dotted lines ±2 s.d. of all SRM 986 measurements. | ||
In order to more thoroughly investigate the results of our chemical separation procedure we performed matrix tests, employing mixtures of ICP-standard solutions (Alfa Aesar) of geologically abundant matrix elements—Mg, Al, Ca, Fe, Ti, V, Cr, Mn, Co, Cu, Zn, Mo, Cd, Sn, and Pb—mixed together with the spiked Ni NIST standard solution to yield element abundances in similar proportions to silicate rocks. After processing the mixed solution through our column chemistry procedure the solutions were analysed, and yielded isotopic compositions identical with the untreated NIST standard reference solution within error (Fig. 5).
4.2 Isotope fractionation associated with matrix effects
The presence of other elements may depress the ionization and throughput of Ni in the plasma and interface region of the mass spectrometer. Although our chemical protocol effectively separates Ni from matrix elements, we carried out tests to evaluate the effects of residual matrix elements in sample solutions on isotopic ratio measurements. Nickel standard solutions were doped with a chosen set of individual elements (Ca, Cr, Fe, Mg, Na, Ti, and Zn) at different element-to-Ni concentration ratios. These elements were chosen as they are either of similar mass range (Fe, Zn), difficult to completely separate from Ni by ion-exchange chromatography (Ti, Cr), or ubiquitous in geological samples (Na, Ca, Mg). The results of these tests are shown in Fig. 6 where all measurements are plotted against their concentration ratio. At low concentrations, the effect the matrix elements have on the measurement is corrected for by the double-spike technique. But careful chemical separation of Ni from matrix elements is still required for high-precision isotopic ratio determinations.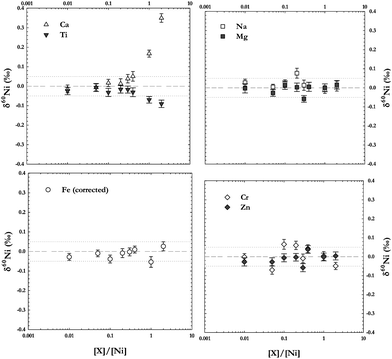 | ||
| Fig. 6 Analyses of a Ni standard solution doped with different elements in varying concentration ratios to Ni. The error bars are 2 s.e. of the individual measurement. The dotted lines show the 2 s.d. error on all (non-doped) Ni standard solution analyses during the measurement session. | ||
Some remaining matrix elements may also combine to form argide or oxide molecules in the plasma and cause interferences on the masses of interest. For example 24Mg36Ar+ interferes on 60Ni, and 44Ca16O+ and 46Ti16O+ on 62Ni (see Table 4). Therefore it is particularly important to completely separate Ni from Mg, Ti, and Ca. However, as can be seen in Fig. 6 doping a Ni solution with Mg does not seem to have any effect on either the accuracy or the precision of the measurement. On the other hand, the addition of Ca or Ti significantly offsets the measurement accuracy. This shows that argides are not formed in the plasma to the same extent as oxides. Adding Ca to the solution pushes the measurement results towards heavier delta values, while Ti in the solution has the opposite effect, producing lighter delta values than the non-doped Ni standard, even at relatively low concentrations (Fig. 6). This is because the most abundant Ca isotope (40Ca, natural abundance 96.9%) can form 40Ca18O+ which interferes with 58Ni, denominator in all isotope ratios measured, pushing the ratios higher. For Ti on the other hand only 46Ti can form an oxide possible of interfering on any of the Ni masses analysed, 46Ti16O+. This oxide would interfere with 62Ni, an isotope used in the double-spike correction, and thus interfere with the double-spike data reduction procedure.
4.3 Reproducibility and accuracy of measurements
In order to determine the long-term reproducibility of Ni isotope ratio measurements we have taken two different approaches. Instrument reproducibility was tested by measurements of a pure NiO powder (from Sigma Aldrich, 98% Ni), which had been dissolved and spiked, but not treated with our the chemical separation procedure. The NiO solution was analysed during several measurement sessions over one year, giving an overall average value of δ60Ni = −0.159 ± 0.034‰ (2 s.d., n = 310) (Fig. 7). Typically, 10 pure Ni standards were analysed per sample measurement session.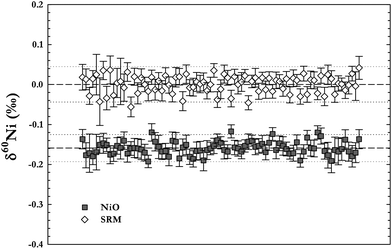 | ||
| Fig. 7 Long term instrument reproducibility as tested by measurements of a Ni-oxide solution (NiO powder, Sigma Aldrich) analysed during several measurement sessions over one year. The overall average value for the NiO solution was δ60Ni = −0.159 ± 0.034‰ (2 s.d.). Error bars in the figure are 2 s.e. of the individual measurements. | ||
For actual samples however, the long-term reproducibility is expected to be larger than the one given by the instrument as the chemical separation also may have an effect on the analytical reproducibility. This was tested by measurements of three USGS reference materials of different silicates, processed and analysed during several measurement sessions over one year. The results of these analyses are shown in Fig. 8, where the top figure shows replicate analyses of each silicate sample, and the bottom figure the mean value and 2 s.d. error of each sample respectively. By these analyses, the long-term external δ60Ni sample reproducibility for silicate samples is typically ± 0.07‰ (2 s.d.).
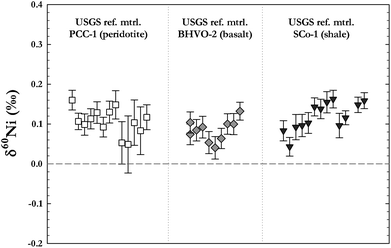 | ||
| Fig. 8 Long term external sample reproducibility as tested by measurements of three USGS reference materials of different chemical compositions (one peridotite, one basalt, and one shale standard). The silicates were fully reprocessed and analysed during several measurement sessions over one year. The figure shows replicate analyses of each silicate sample, error bars are 2 s.e. of the individual measurements. By these analyses the external δ60Ni sample reproducibility was determined to typically be ± 0.07‰ (2 s.d.) for silicate samples. | ||
Small differences were noted between samples of different analyte-to-matrix ratios, as samples with higher ratios (e.g.ferromanganese nodules and sulphides) show lower values for the long term reproducibility (as low as ± 0.05‰ for some samples). Because of this, matrix matching with available rock standards is advisable to get best results for unknown samples. Finally, Fig. 9 shows a comparison for two USGS basalts (BHVO-2 and BCR-2) with data published by Cameron et al.9 As can be seen our data for these reference materials are in good agreement with already published values.
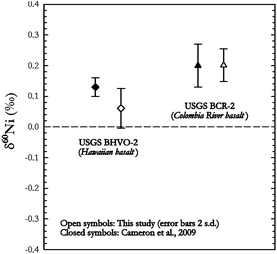 | ||
| Fig. 9 Comparison of data between this study and Cameron et al.9 showing that our data for these USGS reference materials compare very well with already published values. | ||
5 Summary
The new method presented in this paper allows for near quantitative extraction of Ni from a variety of geological sample matrices for high precision isotopic measurements. Our novel chemical separation procedure produces high yield results, our double-spike set-up provides a robust instrumental fractionation correction as well as correcting for possible isotope fractionation during the chemical separation, and our MC-ICP-MS analyses demonstrate the absence of interferences or matrix effects. Repeat analysis of USGS rocks standards and an inter-laboratory comparison confirms the excellent precision and reproducibility achieved by our analytical technique. This method will allow us to further investigate the Ni isotope variations for a variety of terrestrial samples, and possible fractionation between reservoirs.6Acknowledgements
The authors would like to thank the Oxford Isotope Group, Nick Belshaw, and Derek Preston for invaluable technical assistance and Marcel Regelous for sharing of manuscript draft and method details. We would also like to thank the two anonymous reviewers for their helpful and insightful comments. This study was funded by Petrobras, the UK Science and Technology Facilities Council (STFC), and the Natural Environments Research Council (NERC). Oxford Isotope laboratories were funded by Petrobras, STFC and ERC grants to Prof. A.N. HallidayReferences
- J. Gramlish, L. Machlan, I. Barnes and P. Paulsen, J. Res. of the Natl. Inst. of Stand. and Tech., 1989, 94, 347–356 Search PubMed.
- C. Johnson, B. Beard and F. Albarède, Geochemistry of non-traditional stable isotopes, Reviews in Mineralogy & Geochemistry, Mineralogical Society of America, 2004, vol. 55 Search PubMed.
- G. Quitte, M. Meier, C. Latkoczy, A. Halliday and D. Günther, Earth Planet. Sci. Lett., 2006, 242, 16–25 CrossRef CAS.
- D. Cook, M. Wadhwa, P. Janney, N. Dauphas, R. Clayton and A. Davis, Anal. Chem., 2006, 78, 8477–8484 CrossRef CAS.
- J. Chen, D. Papanastassiou and G. Wasserburg, Geochim. Cosmochim. Acta, 2009, 73, 1461–1471 CrossRef CAS.
- S. Ragsdale, J. Inorg. Biochem., 2007, 101, 1657–1666 CrossRef CAS.
- G. Quitte and F. Oberli, J. Anal. At. Spectrom., 2006, 21, 1249–1255 RSC.
- M. Regelous, T. Elliott and C. Coath, Earth Planet. Sci. Lett., 2008, 272, 330–338 CrossRef CAS.
- V. Cameron, D. Vance, C. Archer and C. House, Proc. Natl. Acad. Sci. U. S. A., 2009, 106, 10944–10948 CrossRef CAS.
- A. Victor, Anal. Chim. Acta, 1986, 183, 155–161 CrossRef CAS.
- F. Strelow, Anal. Chim. Acta, 1990, 233, 129–134 CrossRef CAS.
- F. Strelow, C. Weinert and C. Eloff, Anal. Chem., 1972, 44, 2352 CrossRef CAS.
- S. Galer, Chem. Geol., 1999, 157, 255–274 CrossRef CAS.
- C. Johnson and B. Beard, Int. J. Mass Spectrom., 1999, 193, 87–99 CrossRef CAS.
- M. Dodson, Geochim. Cosmochim. Acta, 1970, 34, 1241–1244 CrossRef CAS.
- C. Siebert, T. Nägler and J. Kramers, Geochem., Geophys., Geosyst., 2001, 2 CrossRef CAS.
- C. Maréchal, P. Télouk and F. Albarède, Chem. Geol., 1999, 156, 251–273 CrossRef.
| This journal is © The Royal Society of Chemistry 2012 |