DOI:
10.1039/C1RA00466B
(Paper)
RSC Adv., 2012,
2, 992-998
Highly anisotropic titanates from electrospun TiO2–SiO2 composite nanofibers and rice grain-shaped nanostructures†
Received
16th July 2011
, Accepted 9th October 2011
First published on 2nd December 2011
Abstract
We report a low temperature alkali-mediated conversion of nanofiber-and rice grain-shaped TiO2–SiO2 composites into highly anisotropic fiber (decorated with thorn-like features on surfaces)/sponge-shaped titanates of the formula Na2−xHxTi2O4(OH)2. The titanates were thoroughly characterized by spectroscopy and microscopy. Control experiments with the respective TiO2 analogues revealed that the unique open and highly porous morphologies were the result of structural rearrangement of TiO2 coupled with the in situleaching of SiO2 from the composites by the alkali. Effect of concentration of the alkali and the reaction temperature on the morphology of the titanates was also probed. Evolution of the unique morphologies from the respective starting materials was studied by scanning electron microscopy analyses of the systematically withdrawn samples during the course of the reaction. The materials utilized in dye-sensitized solar cells showed excellent photovoltaic parameters amongst the category of titanates.
Introduction
After the pioneering work by Kasuga et al., the alkali-mediated conversion of spherical P-25 TiO2 particles into rod/wire-shaped titanates has become an extensively investigated reaction1 owing to potential uses of the materials in catalysis,2hydrogen storage,3lithium ion batteries,4 solar cells,5 ion exchange6 and remediation of radioactive contaminants.7 The layered titanates having open and porous morphology incorporate several advantageous physico-chemical characteristics. Though the exact mechanistic features of the conversion are still in doubt, it is widely believed that the alkali-mediated conversion proceeds by a number of steps8–10 involving: a) the alkali attack on the TiO2 breaks the longer Ti–O–Ti bonds (the TiO2 consists of distorted TiO6 octahedra with two Ti–O bonds being longer (0.1980 nm) and the remaining four shorter (0.1934 nm)) resulting in Ti–O–Na bonds; b) partial/complete hydrolysis of the Ti–O–Na bonds with water/HCl results in Ti–O–H bonds, c) the Ti–O–H bond formation is accompanied by the creation of linear fragments which upon rearrangement to form sheets/ribbons of edge sharing octahedra with Na+ and OH− intercalated between the sheets and d) the sheets self-assemble/fold to create tubular nanostructures. It was established that the morphology of the final titanates depends on the chemical nature of the initial TiO2 (anatase/rutile), concentration and nature of the alkali employed and the reaction temperature.8–10 Several investigations have been conducted to establish the structure and composition of the final titanates and several compositions have been assigned such as NaxH2−xTi2O4(OH)2,10a trititanates H2Ti3O7,11,12H2Ti3O7.nH2O,13 NaxH2−xTi3O7,6a,14tetratitanate (H2Ti4O9·H2O)15 and lepidocrocite titanate (HxTi2−x/4-□x/4O4).9c,16 A bititanate structure, H2Ti2O5·H2O has also been recently reported, though it was found to be scientifically incorrect.17 Most of the studies in this direction have been related to the conversion of spherical P-25 TiO2 (of 25–30 nm size) into titanate nanotubes/wires under hydrothermal conditions.1–17 The present paper unravels interesting anisotropic morphologies of the titanates from electrospun TiO2–SiO2 composite nanomaterials by selective dissolution of SiO2 and the in situ structural rearrangement of TiO2 by the action of alkali. We have found that fiber-shaped TiO2–SiO2 composites upon NaOH treatment gave thorn-like features on porous fiber surfaces whereas rice grain-shaped TiO2–SiO2 composites gave sponge-shaped titanates. It has thus became clear that the final morphology of the titanates is dependent on the morphology of the starting materials as well. The present paper explores the structural transformations leading to the anisotropic titanates in detail.
Experimental details
a) Fabrication of rice grain-shaped TiO2–SiO2 composites
Rice grain-shaped TiO2–SiO2 composites were prepared by the electrospinning technique by slightly modifying the previously reported procedure on rice grain-shaped TiO218 as described below. Nearly 2.4 g of polyvinyl acetate (PVAc, Mw = 500![[thin space (1/6-em)]](https://www.rsc.org/images/entities/char_2009.gif) 000, Sigma Aldrich, USA) was added to 20 mL of N,N-dimethyl acetamide (DMAc, 99.8%, GC grade, Aldrich, Germany) under stirring. This was followed by the addition of 4 mL of acetic acid (99.7%, LABSCAN Analytical Sciences, Thailand), 1.75 mL of titanium(IV) isopropoxide (TiP, 97%, Aldrich, Germany) and 0.25 mL tetraethoxysilane (TES, 99% GC grade, Sigma-Aldrich, Germany). The mixture was stirred well for 12 h to attain homogeneity and sufficient viscosity for smooth electrospinning. The electrospinning was done under the optimized conditions of 30 kV with a flow rate of 1 mL h−1 using a commercial machine, NANON (MECC, Japan). The distance between the needle tip (27G ½) and the collector (which is a rotating drum wrapped with an aluminium foil) was ∼10 cm. The humidity level inside the electrospinning chamber was between 50 to 60%. The as-spun fibers were removed from the collector in the form of a freestanding sheet and were sintered at 500 °C for 1 h for removal of the polymer and crystallizing the TiO2–SiO2 composite. The concentration of SiO2 was varied by preparing two more solutions with different compositions of the precursors ((i.e. (1.5 mL TiO2 precursor + 0.5 mL SiO2 precursor) and (1 mL TiO2 precursor + 1 mL SiO2 precursor, respectively). However, it was found that when the concentration of the SiO2 precursor becomes high in the electrospinning mixture (such as 1 mL and 0.5 mL), it was difficult to sustain the continuous nanofiber/rice grain-shaped morphologies (Supporting Information 1, SI-1)†. The as-spun fibers (TiO2–SiO2–PVAc) and the rice grain-shaped composites (TiO2–SiO2) were characterized by spectroscopy and microscopy.
000, Sigma Aldrich, USA) was added to 20 mL of N,N-dimethyl acetamide (DMAc, 99.8%, GC grade, Aldrich, Germany) under stirring. This was followed by the addition of 4 mL of acetic acid (99.7%, LABSCAN Analytical Sciences, Thailand), 1.75 mL of titanium(IV) isopropoxide (TiP, 97%, Aldrich, Germany) and 0.25 mL tetraethoxysilane (TES, 99% GC grade, Sigma-Aldrich, Germany). The mixture was stirred well for 12 h to attain homogeneity and sufficient viscosity for smooth electrospinning. The electrospinning was done under the optimized conditions of 30 kV with a flow rate of 1 mL h−1 using a commercial machine, NANON (MECC, Japan). The distance between the needle tip (27G ½) and the collector (which is a rotating drum wrapped with an aluminium foil) was ∼10 cm. The humidity level inside the electrospinning chamber was between 50 to 60%. The as-spun fibers were removed from the collector in the form of a freestanding sheet and were sintered at 500 °C for 1 h for removal of the polymer and crystallizing the TiO2–SiO2 composite. The concentration of SiO2 was varied by preparing two more solutions with different compositions of the precursors ((i.e. (1.5 mL TiO2 precursor + 0.5 mL SiO2 precursor) and (1 mL TiO2 precursor + 1 mL SiO2 precursor, respectively). However, it was found that when the concentration of the SiO2 precursor becomes high in the electrospinning mixture (such as 1 mL and 0.5 mL), it was difficult to sustain the continuous nanofiber/rice grain-shaped morphologies (Supporting Information 1, SI-1)†. The as-spun fibers (TiO2–SiO2–PVAc) and the rice grain-shaped composites (TiO2–SiO2) were characterized by spectroscopy and microscopy.
b) Fabrication of TiO2–SiO2 composite nanofibers
The TiO2–SiO2 nanofibers were prepared by similar routes as described above, except that the PVAc polymer was replaced with polyvinylpyrrolidone19 (PVP, Mw = 1.30 × 10⁶, mp > 300 °C, Aldrich, Steinhseim, Germany). In a typical procedure, 0.6 g of PVP was dissolved in 14 mL of ethanol (absolute, Fischer scientific, Leicestershire, UK). This was followed by the addition of 4 mL acetic acid (99.7%) and a mixture of 1.75 mL TiP and 0.25 mL TES, respectively. The mixture was stirred for about 12 h for homogeneity and subjected to electrospinning as described in the experimental section a. Electrospinning was also done with varying concentrations of the SiO2 precursor. The as-spun (TiO2–SiO2–PVP) and sintered (TiO2–SiO2) nanofibers were characterized by spectroscopy and microscopy.
c) Fabrication of anisotropic titanate nanostructures from TiO2–SiO2 composites
About 500 mg of the TiO2–SiO2 composites (nanofibers/the rice grain-shaped, separately) was treated with 100 mL of 5 M NaOH solution (without stirring) in glass bottles in a hot-air oven at 80 °C for 24 h. The treated material was washed several times with deionized water and finally with ethanol (absolute). This was then dried in an oven at 80 °C. The material thus obtained was analyzed by spectroscopy and microscopy. Experiments have also been conducted with 10 M NaOH to check whether the morphologies remained the same.
d) Fabrication of dye-sensitized solar cells
DSCs were fabricated out of the sponge- and fiber-shaped titanates by screen printing technique. The thickness of the electrodes was ∼11 μm (which found to be the ideal thickness for DSCs). Briefly, 100 mg each of the respective titanates was mixed with 100 μL of polyester (synthesized by the polycondensation of ethylene glycol and citric acid in presence of Ti4+ ions at 90–100 °C)20 and sonicated for about 12 h for obtaining a paste of right rheology necessary for doctor-blading. The paste was screen printed to get an overall thickness of ∼15 μm on clean fluorine-doped tin oxide (FTO, Solaronix, Switzerland, sheet resistance ∼10 Ω/□) plates and subsequently left for relaxation in vacuum. The FTO plates were sintered in air at 450 °C for 1 h to get porous films ((the thickness of the electrodes reduced to ∼11 μm (this was found to be the optimum thickness) upon sintering due to the evaporation of polyester from the mixture)) and subsequently soaked in 0.5 mM N3 dye solution (in 1![[thin space (1/6-em)]](https://www.rsc.org/images/entities/char_2009.gif) :
:![[thin space (1/6-em)]](https://www.rsc.org/images/entities/char_2009.gif) 1 acetonitrile-tert-butyl alcohol mixture) for 24 h for saturate chemisorption of the sensitizer (the active area of the electrode was 0.28 cm2). The TiO2–N3 electrodes were subsequently washed with absolute ethanol for removing the un-anchored dyes. The vacuum-dried photoelectrodes were sandwiched against a Pt counter electrode in presence of a parafilm spacer and I3/I− electrolyte to assemble typical DSCs.
1 acetonitrile-tert-butyl alcohol mixture) for 24 h for saturate chemisorption of the sensitizer (the active area of the electrode was 0.28 cm2). The TiO2–N3 electrodes were subsequently washed with absolute ethanol for removing the un-anchored dyes. The vacuum-dried photoelectrodes were sandwiched against a Pt counter electrode in presence of a parafilm spacer and I3/I− electrolyte to assemble typical DSCs.
e) Characterization
The as-spun fibers, sintered TiO2–SiO2 composites and the nanofiber- and sponge-shaped titanates were characterized by spectroscopy and microscopy. Scanning electron microscopy (SEM) was done using a Quanta 200 FEG System (FEI Company, USA) operated at 10 kV and JEOL JSM-6701F operated at 30 kV, respectively. A thin coating of Pt was given to the samples for enhancing the conductivity. High-resolution transmission electron microscopy (HRTEM) was performed using a JEOL 3010 operated at 300 kV. The samples dispersed in methanol were casted on carbon-coated Cu grids and dried under vacuum for the TEM measurements. Brunauer-Emmett-Teller (BET) surface area measurements were done using a NOVA 4200E Surface Area and Pore Size Analyzer (Quantachrome, USA). The samples were dried under flowing N2 at 350 °C overnight prior to BET measurements under standard protocols at 77 K. Powder XRD was done using a Bruker-AXS D8 ADVANCE spectrometer. Photocurrent measurements were done under 1 Sun illumination using an XES-151 S solar simulator (San-Ei, Japan) under AM1.5 G condition and an Autolab PGSTAT30 (Eco Chemie B.V., The Netherlands), respectively, with automatic data acquisition. X-ray photoelectron spectroscopy XPS) was performed using the Thermo Scientific Theta Probe XPS (calibrated). Monochromatic Al Kα X-ray (hν = 1486.6 eV) was employed for analysis with an incident angle of 30° with respect to surface normal. Photoelectrons were collected at a take-off angle of 50° with respect to surface normal. The analysis area was approximately 400 μm in diameter while the maximum analysis depth lied in the range of 4–10 nm. Survey and high-resolution spectra were acquired for surface composition analysis and for chemical state identification, respectively. Charge compensation was performed by means of low energy electron flooding and further correction was made based on the adventitious C1s at 285.0 eV using the manufacturer's standard software.
Results and discussion
a) Morphology of the as-spun nanofibers and sintered nanostructures
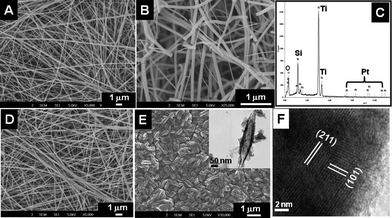
Fig. 1 shows the morphology of the as-spun nanofibers from TiO2–SiO2–PVP (Fig. 1A) and TiO2–SiO2–PVAc (Fig. 1D) systems. The fibers were smooth and continuous with an average diameter of 100 nm. Upon sintering, the former gave rise to both continuous and short fibers (Fig. 1B). The origin of the short fibers in the system could be because of the presence of the SiO2 precursor in the electrospinning mixture as spinning TiO2 alone always gave continuous nanofibers even after sintering (SI-2†).19 Energy dispersive X-ray spectrum (EDS) of the sintered nanomaterials (Fig. 1C) revealed their elemental composition (Ti, Si and O). The presence of Pt is because of the sputtering process. Fig. 1E shows the rice grain morphology of the TiO2–SiO2 composite obtained from the TiO2–SiO2–PVAc material after sintering. The average length and breadth of the nanostructures were ∼550 nm and ∼120 nm, respectively. TEM image of a single rice-like particle is shown in the inset of Fig. 1E. Fig. 1F gives its lattice-resolved image showing the prominent (101) and (211) lattice planes of TiO2.
 |
| | Fig. 1
SEM images of the as-spun TiO2–SiO2–PVP fibers (A), TiO2–SiO2–PVAc fibers (D) and their respective sintered TiO2–SiO2 nanostructures (B and E, respectively). Figure C is the EDS spectrum of the sintered material showing the elemental composition. Inset of E shows the TEM image of a single rice grain-shaped TiO2–SiO2 composite and F shows a lattice-resolved image of the same. | |
b) Morphology of the titanates
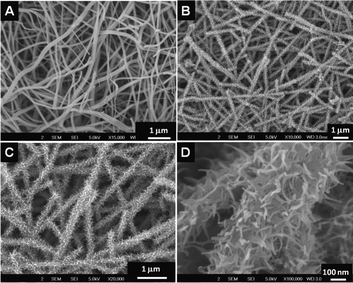
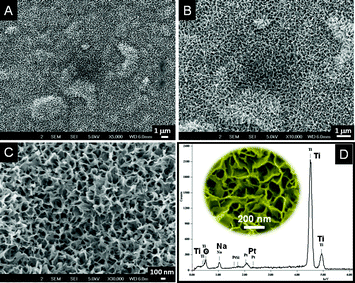
SEM images of the titanates obtained by the reaction of alkali on TiO2–SiO2 composite nanofibers is shown in Fig. 2. The smooth surface of the nanofibers (Fig. 2A) got decorated with thorn-like features (Fig. 2B and C) as a result of the action of the alkali, however, the overall nanofiber morphology was well-preserved. The high-resolution image given in Fig. 2D revealed that the thorn-like features are in fact small ribbon-shaped structures randomly originating from the nanofiber backbone. The average length and breadth of the curly ribbon-like features were ∼100 nm and ∼15–20 nm, respectively. The nanofiber backbone itself became porous due to the action of the alkali. However, when the rice-shaped TiO2–SiO2 composite was treated with alkali, an entirely different morphology has been obtained. The rice-like structures were lost completely resulting in sponge-shaped nanostructures. Fig. 3 shows the SEM images of the morphologies in different resolutions (Fig. 3A–C). A zoomed view of Fig. 3C is shown in the inset of Fig. 3D. EDS spectrum (Fig. 3D) of the material showed the elemental composition after NaOH treatment. Note the near absence of Si and the presence of Na in the sponge-shaped nanostructures. This implies that the Si could be completely leached using concentrated alkali at slightly elevated temperatures.
 |
| | Fig. 2
SEM image of the TiO2–SiO2 nanofibers (A) obtained from the TiO2–SiO2–PVP system. B, C and D show the SEM images of the titanates in varying resolutions. | |
 |
| | Fig. 3
SEM images of the sponge-shaped titanates in various resolutions (A–C). An expanded view of C is given in the inset of D. D shows the SAED pattern of the NaOH treated sample showing the absence of Si and the presence of Na. | |
We have investigated whether the unique morphologies are specific to the concentration of NaOH (i.e. 5M). Therefore, experiments have been conducted with 10M NaOH under identical conditions. The SEM images of the nanostructures obtained in the case of nanofibrous and rice grain-shaped TiO2–SiO2 composites are shown in Fig. 4. As could be seen, the morphologies remained nearly unchanged (Fig. 4A and B). This implies that the effect of structural rearrangement of TiO2 and the in situleaching of SiO2 were complete even with 5M NaOH itself. Flower-shaped structures have been spotted in some isolated regions of the sample and a closer examination of them showed an intrinsic sponge-shaped morphology (Fig. 4C).
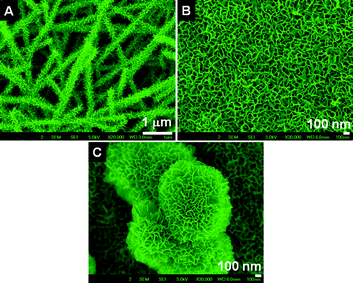 |
| | Fig. 4 SEM images of the titanates obtained by treatment with 10 M NaOH solution (A for the fiber- and B for the sponge-shaped titanate, respectively). C shows flower shaped structure with an intrinsic sponge morphology. | |
c) Morphology of the nanostructures from control experiments
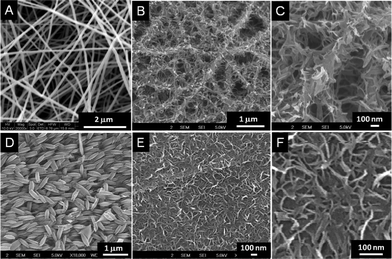
As NaOH is known to effect the formation of layered titanates from TiO2, it is natural to ask whether the present morphologies are the result of a) the action of concentrated NaOH on TiO2 or b) selective leaching of SiO2 from the TiO2 matrix or c) the combined action of both. Therefore controlled experiments have been performed with electrospun TiO2 nanofibers (Fig. 5A) and rice grain-shaped TiO2 (Fig. 5D) nanostructures with NaOH under similar conditions as before. The SEM images of the resultant nanostructures are shown in Fig. 5 (B and C and E and F). The overall nanofiber morphology was still retained (Fig. 5B), but leafy structures decorate the fiber backbone (Fig. 5C). The TiO2 rice grains on the other hand gave short sheet-like nanostructures (Fig. 5E and F). Thus it can be concluded that the unique morphology of the titanates observed in the present case was because of the combined effect of the structural rearrangement of the TiO2 and the leaching of SiO2 from the composite nanostructures upon NaOH treatment.
 |
| | Fig. 5
SEM images of the nanostructures obtained from control experiments. A represents the TiO2 nanofiber and B & C the titanates obtained from A in low and high resolutions. D, E and F, respectively, represent the rice grain-shaped TiO2 and the titanates in different resolutions. | |
d) Structure of the titanates
The fiber- and sponge-shaped titanates were characterized by TEM (Fig. 6). A large area image of the fiber titanate is shown in Fig. 6A and a resolved image in Fig. 6B. Ribbon/thorn-shaped nanostructures originating from the porous fiber backbone are clearly seen in Fig. 6B. Fig. 6C shows a high-resolution image of the thorn-like nanostructure showing its layered nature. The inset shows a selected area electron diffraction (SAED) pattern showing the less crystalline nature of the material. The spacing between individual layers was estimated to be ∼0.8 nm, consistent with literature observations.4b,9c,10a,17,21Fig. 6D and E show the low- and high-resolution TEM images of the sponge-shaped titanate (the sponge morphology was lost upon sonication for casting onto the TEM grid). The layered sheet-like nanostructures constituting the titanates is evident from Fig. 6E (marked with dotted red circles). Fig. 6F shows the SAED pattern showing the polycrystalline nature of the material.
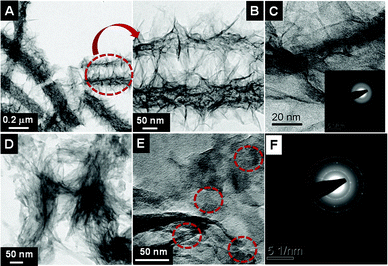 |
| | Fig. 6 A& B show low- and high-magnification TEM images of the fiber titanate. C shows the lattice resolved image depicting the layered structure of the titanate and its inset gives an SAED pattern. D, E and F represent the respective images from sponge-shaped titanate showing its layered nature and polycrystallinity. | |
X-ray photoelectron spectroscopy (XPS) was performed to get more insights on the chemical nature of the TiO2–SiO2 composites and the titanates. A representative survey spectrum of the TiO2–SiO2 composites is given in Fig. 7A showing the elemental composition (assigned in the spectrum itself) and the high-resolution peaks of the elements in Fig. 7(B–D). The low intensity of the SiO2 could be due to its low concentration and low sensitivity compared to that of TiO2. The binding energies of Ti 2p3/2 and Ti 2p1/2 (Fig. 7B) were centered at 459.4 eV and 465.16 eV, respectively, corresponding to a spin–orbit coupling of 5.76 eV. The O1s peak could be deconvoluted into 3 peaks at 530.7, 531.5 and 532.8 eV, respectively, corresponding to Ti–O–Ti, Si–O–Si, is and Si–O–Ti bonds. It could thus be inferred that SiO2 has been embedded into the TiO2 matrix through Ti–O–Si bonds.22 The XPS of the nanofiber titanate is shown in Fig. 8. Fig. 8A, B, C and D, respectively, show the survey spectrum and the high-resolution peaks of the elements. Note the absence of Si (due to its leaching by NaOH) in the survey spectrum. The binding energies of Ti 2p3/2 and Ti 2p1/2 (Fig. 8B) were centered at 458.6 eV and 465.3 eV, respectively. This implies that the Ti in the titanates is in a different chemical environment than that in TiO2. The O1s peak (Fig. 8C) showed only one peak maximum corresponding to Ti–O–Ti bonds (at 530.2 eV). Fig. 8D shows the Na 1s peak at 1071 eV. The presence of Na in the sample implies the formation of Ti–O–Na bonds due to the action of NaOH on TiO2. Powder X-ray diffraction spectra were taken to understand the crystal structure of the titanates. Traces a and b in Fig. 9A show the XRD of the nanofiber- and sponge-shaped titanates, respectively. A comparison of the powder XRD data reveals same crystal structure for both the titanates. Major peaks are assigned in the spectra itself.10 The peak at 2θ = 9.8 is not shown as it is not well-defined. A combination of EDS, XPS and XRD establish the structure of the titanates to be Na2-xHxTi2O4(OH)2, where x depends on the pH of the washing solution (pH = 6–7 in the present case). However, upon sintering at temperatures greater than 450 °C, the titanates get transformed to Na2Ti2O4(OH)2 (Fig. 9B). The major peaks are assigned in the spectrum itself. A detailed analysis of the crystal structure of the material is not attempted here as it is documented elsewhere.10 The acid (HCl) washed material could be completely converted into anatase TiO2 by sintering at high temperatures (however at the expense of surface area).
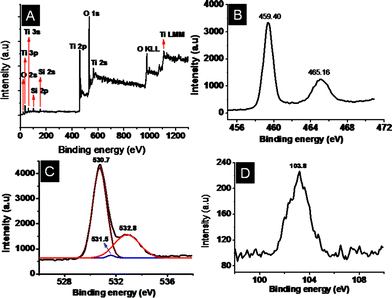 |
| | Fig. 7 Representative XPS spectra of the TiO2–SiO2 composites. A shows the survey spectrum and B, C and D, respectively, show the high- resolution spectra of the Ti, O and Si. | |
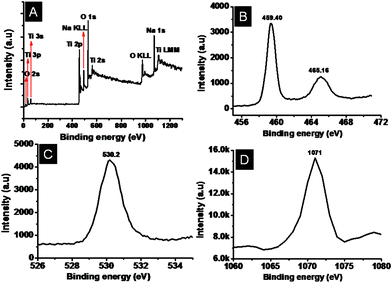 |
| | Fig. 8 Representative XPS survey spectrum of the titanate (A) and the high-resolution peaks of Ti, O and Na (B, C and D respectively). | |
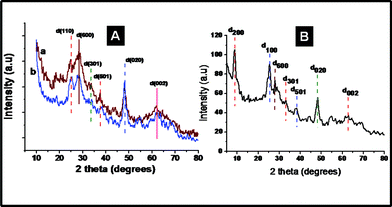 |
| | Fig. 9 A comparison of the XRD spectra of nanofiber- and sponge-shaped titanates (A). B shows the XRD spectrum of the sample sintered at 450 °C. | |
e) BET surface area of the titanates
We have estimated the surface areas of the starting materials and the titanates due to their open and porous morphology. The BET measurements showed a surface area of 32 m2 g−1 for the TiO2–SiO2 composite nanofibers and 36 m2 g−1 for the respective rice grain-shaped composites. The respective values for the NaOH treated samples (the titanates) were ∼208 m2 g−1 for the nanofiber titanate and ∼220 m2 g−1 for the sponge-shaped titanate. The enormous increase in surface area could be attributed to the unique porous morphology of the titanates. An analysis of pore size distribution in the case of the nanofiber titanates showed three different pores of radii 2.97 Å, 6.04 Å and 7.9 Å, respectively. The sponge-shaped titanate on the other hand showed only two different pores of radii 2.98 Å and 7.0 Å, respectively. The pore volume in the respective cases were 0.606 cc/g and 0.681 cc/g, respectively.
f) Effect of temperature
We have investigated the effect of temperature on the morphology of the titanates. Therefore, experiments have been performed at 110 °C for 24 h in a furnace. Experiments have also been preformed in an oil bath under the same temperature range and duration. The SEM images of the resultant nanostructures obtained from nanofiber and rice grain-shaped TiO2 are shown in Fig. 10 (A and B). As could be seen, the fiber-thorn and sponge-shaped morphology are retained. However, at still higher temperatures (150 °C in an oil bath) and reaction duration (72 h), the anisotropic nanostructures breakdown into spherical titanate nanoparticles (SI-3)†.
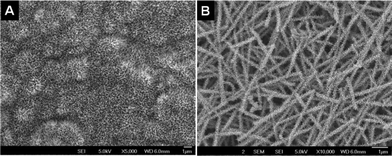 |
| | Fig. 10 A and B, respectively, denote the SEM images of the titanates obtained by NaOH treatment at 110 °C. | |
g) Morphology evolution
With the aim of getting a few systematic images to unravel the morphology evolution of the nanostructures, we have recorded SEM images of the materials during the course of the chemical transformation in a time-dependent manner. Samples were collected at time intervals of 0, 3, 6 and 12 h of the chemical reaction and SEM images were recorded. A series of the SEM images obtained from fiber- and rice grain-shaped
TiO2–SiO2 composites are shown in Fig. 11. The top panel (images A–D) shows evolution of the thorn-like features from the fibers in a time-dependent manner. The smooth surface of the fibers (A) gets transformed and decorated on surfaces with corrugated sheet-like structures (B) after 3 h of reaction with NaOH. After 6 h, the sheet-like structures further develop and define without disturbing the overall fiber morphology (C). The sheet-like structures grow into short ribbons which self-assemble on the porous fiber backbone (in 12 h) resulting in thorn-like features (D). The rice grain-like nanostructures (image E in the bottom panel) on similar chemical treatment (for 3 h) leads to complete loss of the morphology resulting in sheet-like structures (F) which further grow and self-assemble to form sponge-shaped nanostructures (G and H).
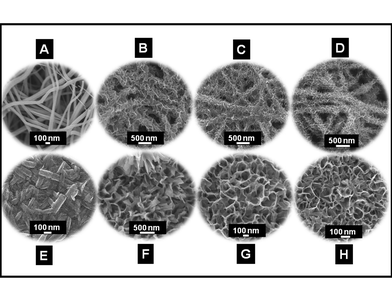 |
| | Fig. 11 Top panel: SEM images showing the evolution of the titanate morphology (B–D) from TiO2–SiO2 fibers (A). Bottom panel: SEM images showing the evolution of the sponge-shaped morphology (F–H) from rice grain-shaped TiO2–SiO2 composites (E). | |
h) Applications in dye-sensitized solar cells
Due to the open and porous morphology and hence the extremely high surface areas, the layered titanates were investigated for their use in dye-sensitized solar cells (DSCs) in the presence of I3/I− electrolyte and Pt counter electrode. Thickness of the TiO2 layer was ∼11 μm and the active area of the electrode was ∼0.28 cm2. The current density (Jsc) vs. voltage (V) plots of the nanofiber and sponge-shaped titanates are shown by traces a and b in Fig. 12. The best DSC performance was shown by the sponge-shaped titanate (trace b) which showed the photovoltaic (PV) parameters of a current density (Jsc) of 9.85 mA cm−2, an open-circuit voltage (Voc) of 0.723 V, a fill factor (FF) of 65.3% and an overall conversion efficiency (η) of 4.65%. The respective parameters of the nanofiber-based titanate was 9.09 mA cm−2, 0.72 V, 66.1% and 4.32%. The enhanced conversion efficiency in the case of the sponge-shaped titanate could be because of its high surface area (228 m2 g−1vs. 208 m2 g−1) and crystallinity (see the SAED pattern) as this will help in more dye-absorption and enhanced charge transport and hence the high Jsc. The other photovoltaic parameters were nearly the same for both the titanates. It is also interesting to note that the PV parameters observed for the titanates were nearly the same as that from their corresponding starting materials (fiber/rice grain-shaped anatase TiO2). Thus, the benefit of high surface areas of the titanates was slightly compromised by its lower crystallinity and hydroxyl density which forces the PV parameters to be nearly comparable. Still the PV parameters shown by the titanates were remarkable (note that the present photovoltaic parameters were without the use of a hole-blocking layer or TiCl4 treatments) and the direct use of the titanates in DSCs is still not there in literature.
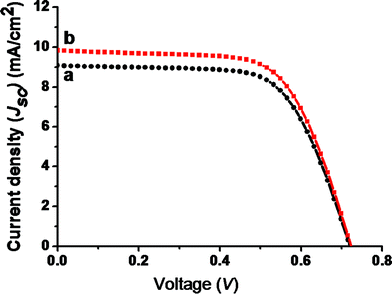 |
| | Fig. 12 A comparison of the photovoltaic performance of fiber- and sponge-shaped titanates (traces a and b, respectively). | |
A comparison of the DSC performance of the present titanates with literature attempts in similar direction is summarized below. Ohsaki et al.5a utilized the TiO2 nanotubes obtained from P-25viaNaOH treatment (followed by sintering above 650 °C) for DSCs and obtained a current density of 7.5 mA cm−2 and an efficiency (η) of 4.1% for a cell of 0.25 cm2 area. However, upon Li ion incorporation (by treating the titanates with a 50 mM Li salt solution), the efficiency has been increased to 6.4%. Kim et al.23 used electrophoretic deposition of titanates for the preparation of DSC photoanodes and reported an η of 6.72%. However, upon doctor blading, the efficiency was only 0.65%. The reason for the large difference in efficiency has been attributed to the non-conversion of titanates into titania and the presence of Na and other polymeric impurities by the latter methodology. Enache-Pommer et al.5b also used a similar methodology of converting the titanates into TiO2 by high temperature annealing for DSCs and reported lower photovoltaic parameters of a Jsc of 4.21 mA cm−2, a Voc of 0.59 V, a FF of 0.60 and an η of 1.5%. Hsiao et al.24 also obtained high purity anatase nanotubes from titanates through high temperature sintering and reported a high efficiency of 8.9%. It must be noted that while all the above reports involved conversion of titanates into anatase TiO2 through high temperature sintering and their subsequent utilization in DSCs, the present DSC results were directly from the titanates (after sintering at 450 °C, the materials were still titanates) and therefore an apt comparison of their photovoltaic performance may not be appropriate.
Conclusion
Layered titanates with two different morphologies were fabricated from electrospun nanofiber and rice grain-shaped TiO2–SiO2 composites by the action of conc. NaOH. While the former gave a titanate where ribbon shaped randomly oriented nanostructures originate from either side of the porous nanofiber backbone, the latter gave a sponge-shaped titanate. The structural rearrangement of TiO2 coupled with the in situleaching of SiO2 is believed to the reason behind the formation of the highly anisotropic morphologies. Effect of alkali concentration and reaction temperature were also probed in addition to evolution of the unusual morphologies. The materials were found to be useful for applications in dye-sensitized solar cells.
Acknowledgements
National Research Foundation, and M3TC (Economic Development Board), respectively, Singapore are thanked for financial assistance (grant numbers: NRF2007EWT-CERP01-0531, NRF-CRP4-2008-03, and R-261-501-018-414 respectively).
References
-
(a) T. Kasuga, M. Hiramatsu, A. Hoson, T. Sekino and K. Niihara, Langmuir, 1998, 14, 3160 CrossRef CAS;
(b) T. Kasuga, M. Hiramatsu, A. Hoson, T. Sekino and K. Niihara, Adv. Mater., 1999, 11, 1307 CrossRef CAS.
- S. Chatterjee, K. Bhattacharyya, P. Ayyub and A. K. Tyagi, J. Phys. Chem. C, 2010, 114, 9424 CAS.
- S. H. Lim, J. Luo, Z. Zhong, W. Ji and J. Lin, Inorg. Chem., 2005, 44, 4124 CrossRef CAS.
-
(a) Q. Wang, Z. H. Wen and J. H. Li, Inorg. Chem., 2006, 45, 6944 CrossRef CAS;
(b) H. Zhang, G. R. Li, L. P. An, T. K. Yan, X. P. Gao and H. Y. Zhu, J. Phys. Chem. C, 2007, 111, 6143 CrossRef CAS.
-
(a) Y. Ohsaki, N. Masaki, T. Kitamura, Y. Wada, T. Okamoto, T. Sekino, K. Niiharab and S. Yanagida, Phys. Chem. Chem. Phys., 2005, 7, 4157 RSC;
(b) E. Enache-Pommer, J. E. Boercker and E. S. Aydil, Appl. Phys. Lett., 2007, 91, 123116 CrossRef.
-
(a) X. Sun and Y. Li, Chem.–Eur. J., 2003, 9, 2229 CrossRef CAS;
(b) D. V. Bavykin and F. C. Walsh, J. Phys. Chem. C, 2007, 111, 14644 CrossRef CAS.
- D. J. Yang, Z. F. Zheng, H. Y. Zhu, H. W. Liu and X. P. Gao, Adv. Mater., 2008, 20, 2777 CrossRef CAS.
-
(a) T. P. Feist and P. K. Davies, J. Solid State Chem., 1992, 101, 275 CrossRef CAS;
(b) H. Y. Zhu, Y. Lan, X. P. Gao, S. P. Ringer, Z. F. Zheng, D. Y. Song and J. C. Zhao, J. Am. Chem. Soc., 2005, 127, 6730 CrossRef CAS.
-
(a) K. Kiatkittipong, C. Ye, J. Scott and R. Amal, Cryst. Growth Des., 2010, 10, 3618 CrossRef CAS;
(b) J. Huang, Y. Cao, Q. Huang, H. He, Y. Liu, W. Guo and M. Hong, Cryst. Growth Des., 2009, 9, 3632 CrossRef CAS;
(c) R. Ma, Y. Bando and T. Sasaki, Chem. Phys. Lett., 2003, 380, 577 CrossRef CAS.
-
(a) J. Yang, Z. Jin, X. Wang, W. Li, J. Zhang, S. Zhang, X. Guo and Z. Zhang, Dalton Trans., 2003, 3898 RSC;
(b) D. V. Bavykin, J. M. Friedrich and F. C. Walsh, Adv. Mater., 2006, 18, 2807 CrossRef CAS.
-
(a) Z. -Y. Yuan and B.-L. Su, Colloids Surf., A, 2004, 241, 173 CrossRef CAS;
(b) A. Thorne, A. Kruth, D. Tunstall, J. T. S. Irvine and W. Zhou, J. Phys. Chem. B, 2005, 109, 5439 CrossRef CAS;
(c) G. H. Du, Q. Chen, R. C. Che, Z. Y. Yuan and L.-M. Peng, Appl. Phys. Lett., 2001, 79, 3702 CrossRef CAS.
-
(a) Q. Chen, W. Zhou, G. Du and L.-M. Peng, Adv. Mater., 2002, 14, 1208 CrossRef CAS;
(b) Q. Chen, G. Du, S. Zhang and L.-M. Peng, Acta Crystallogr., Sect. B: Struct. Sci., 2002, 58, 587 CrossRef CAS.
- Y. Suzuki and S. Yoshikawa, J. Mater. Res., 2004, 19, 982 CrossRef CAS.
-
(a) D. V. Bavykin, V. N. Parmon, A. A. Lapkin and F. C. Walsh, J. Mater. Chem., 2004, 14, 3370 RSC;
(b) R. Yoshida, Y. Suzuki and S. Yoshikawa, Mater. Chem. Phys., 2005, 91, 409 CrossRef CAS.
-
(a) A. Nakahira, W. Kato, M. Tamai, T. Isshiki and K. Nishio, J. Mater. Sci., 2004, 39, 4239 CrossRef CAS;
(b) Y. Ma, Y. Lin, X. Xiao, X. Zhou and X. Li, Mater. Res. Bull., 2006, 41, 237 CrossRef CAS.
- R. Ma, K. Fukuda, T. Sazaki, M. Osada and Y. Bando, J. Phys. Chem. B, 2005, 109, 6210 CrossRef CAS.
- C.-C. Tsai and H. Teng, Chem. Mater., 2006, 18, 367 CrossRef CAS.
-
(a) A. S. Nair, Y. Shengyuan, Z. Peining and S. Ramakrishna, Chem. Commun., 2010, 46, 7421 RSC;
(b) Z. Peining, A. S. Nair, Y. Shengyuan and S. Ramakrishna, Mater. Res. Bull., 2011, 46, 588 CrossRef.
- A. Kumar, R. Jose, K. Fujihara, J. Wang and S. Ramakrishna, Chem. Mater., 2007, 19, 6536 CrossRef CAS.
-
(a) A. S. Nair, R. Jose, Y. Shengyuan and S. Ramakrishna, J. Colloid Interface Sci., 2011, 353, 39 CrossRef CAS;
(b) Y. Shengyuan, Z. Peining, A. S. Nair and S. Ramakrishna, J. Mater. Chem., 2011, 21, 6541–6548 RSC.
- E. Morgado Jr, M. A. S. de Abreu, G. T. Moure, B. A. Marinkovic, P. M. Jardim and A. S. Araujo, Chem. Mater., 2007, 19, 665 CrossRef.
- C. Su, K.-F. Lin, Y.-H. Lin and B.-H. You, J. Porous Mater., 2006, 13, 251 CrossRef CAS.
- G.-S. Kim, H.-K. Seo, V. P. Godble, Y.-S. Kim, O.-B. Yang and H.-S. Shin, Electrochem. Commun., 2006, 8, 961 CrossRef CAS.
- P.-T. Hsiao, K.-P. Wang, C.-W. Cheng and H. Teng, J. Photochem. Photobiol., A, 2007, 188, 19 CrossRef CAS.
|
| This journal is © The Royal Society of Chemistry 2012 |
Click here to see how this site uses Cookies. View our privacy policy here. ![[thin space (1/6-em)]](https://www.rsc.org/images/entities/char_2009.gif) 000, Sigma Aldrich, USA) was added to 20 mL of N,N-dimethyl acetamide (DMAc, 99.8%, GC grade, Aldrich, Germany) under stirring. This was followed by the addition of 4 mL of acetic acid (99.7%, LABSCAN Analytical Sciences, Thailand), 1.75 mL of titanium(IV) isopropoxide (TiP, 97%, Aldrich, Germany) and 0.25 mL tetraethoxysilane (TES, 99% GC grade, Sigma-Aldrich, Germany). The mixture was stirred well for 12 h to attain homogeneity and sufficient viscosity for smooth electrospinning. The electrospinning was done under the optimized conditions of 30 kV with a flow rate of 1 mL h−1 using a commercial machine, NANON (MECC, Japan). The distance between the needle tip (27G ½) and the collector (which is a rotating drum wrapped with an aluminium foil) was ∼10 cm. The humidity level inside the electrospinning chamber was between 50 to 60%. The as-spun fibers were removed from the collector in the form of a freestanding sheet and were sintered at 500 °C for 1 h for removal of the polymer and crystallizing the TiO2–SiO2 composite. The concentration of SiO2 was varied by preparing two more solutions with different compositions of the precursors ((i.e. (1.5 mL TiO2 precursor + 0.5 mL SiO2 precursor) and (1 mL TiO2 precursor + 1 mL SiO2 precursor, respectively). However, it was found that when the concentration of the SiO2 precursor becomes high in the electrospinning mixture (such as 1 mL and 0.5 mL), it was difficult to sustain the continuous nanofiber/rice grain-shaped morphologies (Supporting Information 1, SI-1)†. The as-spun fibers (TiO2–SiO2–PVAc) and the rice grain-shaped composites (TiO2–SiO2) were characterized by spectroscopy and microscopy.
000, Sigma Aldrich, USA) was added to 20 mL of N,N-dimethyl acetamide (DMAc, 99.8%, GC grade, Aldrich, Germany) under stirring. This was followed by the addition of 4 mL of acetic acid (99.7%, LABSCAN Analytical Sciences, Thailand), 1.75 mL of titanium(IV) isopropoxide (TiP, 97%, Aldrich, Germany) and 0.25 mL tetraethoxysilane (TES, 99% GC grade, Sigma-Aldrich, Germany). The mixture was stirred well for 12 h to attain homogeneity and sufficient viscosity for smooth electrospinning. The electrospinning was done under the optimized conditions of 30 kV with a flow rate of 1 mL h−1 using a commercial machine, NANON (MECC, Japan). The distance between the needle tip (27G ½) and the collector (which is a rotating drum wrapped with an aluminium foil) was ∼10 cm. The humidity level inside the electrospinning chamber was between 50 to 60%. The as-spun fibers were removed from the collector in the form of a freestanding sheet and were sintered at 500 °C for 1 h for removal of the polymer and crystallizing the TiO2–SiO2 composite. The concentration of SiO2 was varied by preparing two more solutions with different compositions of the precursors ((i.e. (1.5 mL TiO2 precursor + 0.5 mL SiO2 precursor) and (1 mL TiO2 precursor + 1 mL SiO2 precursor, respectively). However, it was found that when the concentration of the SiO2 precursor becomes high in the electrospinning mixture (such as 1 mL and 0.5 mL), it was difficult to sustain the continuous nanofiber/rice grain-shaped morphologies (Supporting Information 1, SI-1)†. The as-spun fibers (TiO2–SiO2–PVAc) and the rice grain-shaped composites (TiO2–SiO2) were characterized by spectroscopy and microscopy.
![[thin space (1/6-em)]](https://www.rsc.org/images/entities/char_2009.gif) :
:![[thin space (1/6-em)]](https://www.rsc.org/images/entities/char_2009.gif) 1 acetonitrile-tert-butyl alcohol mixture) for 24 h for saturate chemisorption of the sensitizer (the active area of the electrode was 0.28 cm2). The TiO2–N3 electrodes were subsequently washed with absolute ethanol for removing the un-anchored dyes. The vacuum-dried photoelectrodes were sandwiched against a Pt counter electrode in presence of a parafilm spacer and I3/I− electrolyte to assemble typical DSCs.
1 acetonitrile-tert-butyl alcohol mixture) for 24 h for saturate chemisorption of the sensitizer (the active area of the electrode was 0.28 cm2). The TiO2–N3 electrodes were subsequently washed with absolute ethanol for removing the un-anchored dyes. The vacuum-dried photoelectrodes were sandwiched against a Pt counter electrode in presence of a parafilm spacer and I3/I− electrolyte to assemble typical DSCs.


