Pore length control of mesoporous Co3O4 and its influence on the capacity of porous electrodes for lithium-ion batteries†
Zhenzhen
Lin
a,
Wenbo
Yue
*a,
Dazhen
Huang
a,
Jiyun
Hu
a,
Xiaoying
Zhang
a,
Zhong-Yong
Yuan
b and
Xiaojing
Yang
*a
aCollege of Chemistry, Beijing Normal University, Beijing, 100875, P. R. China. E-mail: wbyue@bnu.edu.cn; yang.xiaojing@bnu.edu.cn; Fax: +86 10 58802075; Tel: +86 10 58804229
bCollege of Chemistry, Nankai University, Tianjin, 300071, P. R. China
First published on 22nd December 2011
Abstract
Porous electrodes commonly exhibit much higher charge–discharge capacities than normal electrodes due to their large surface areas. Some factors such as pore size (pore diameter) and wall thickness also influence the electrochemical behavior of porous electrodes in lithium-ion batteries (e.g. the rate of Li-ion intercalation). Here we investigated how the pore length influenced the charge–discharge capacities by using mesoporous Co3O4 with various particle sizes synthesised via controlling the particle size of SBA-15 templates. The capacity and rate capability of porous Co3O4 were increased with reduction in particle size.
Introduction
Since the mesoporous materials of the M41S1 family were synthesised by using surfactants, many mesoporous silicas (e.g. SBA-15),2 metal oxides (e.g.ZrO2, TiO2)3 and metal oxide films (e.g.TiO2, SnO2)4 have been developed by employing the similar soft template synthesis methods. However, mesoporous metal oxides (MPMO) obtained via this way were almost amorphous because they were synthesised at low temperatures to avoid destruction of surfactant templates. Subsequently, crystalline MPMOs were successfully prepared by using mesoporous silicas as templates.5 MPMOs with high crystallinity exhibited better physicochemical properties in catalysis, electrochemistry and gas sensing than bulk metal oxides.6 In particular, mesoporous crystalline Co3O4,7Cr2O3,8MnO29 and TiO210 exhibited superior electrochemical performance as an electrode in lithium ion batteries.Cobalt oxides (Co3O4) have been reported to be of high capacity for lithium ion batteries (LIBs).11 Fabrication of materials in the nanoscale (e.g.nanotube or nanowire)12 can further improve the electrochemical properties compared to their bulk counterpart. For instance, Co3O4 nanotubes show excellent rate capability and high capacity after a number of cycles.12 Mesoporous Co3O4 with large surface area and uniform pores also exhibited higher capacity compared to nano- or microparticulates.7 Many factors can influence the capacity and rate of intercalation and hence the power of the battery, including transport of the Li+ within the electrolyte inside pores, transport of Li+ across the electrode/electrolyte interface and diffusion of Li+ within the electrode, etc. Compared with bulk materials, mesoporous particles with large surface areas could accommodate more Li ion, leading to a high charge–discharge capacity.7–9 Recently, Ren et al. prepared ordered mesoporous MnO2 with various pore sizes and wall thickness via controlling the pore size of the KIT-6 template, which was aged in solution at different temperatures, and found that the rate capability increased with decreasing pore wall thickness and increasing pore size.13 Obviously, larger pore size permitted more facile Li+ transport in the electrolyte within the pores. The “pore size” mentioned in previous reports in research of mesoporous materials is “pore diameter”, namely the diameter in the pores; nonetheless Li+ transport in the electrolyte is not only controlled by the diameter of the pores, but also limited by the length of the pores, namely the “pore length” or “particle size”. However, the particle size control of MPMOs and influence of pore length on the capacity of porous electrodes for lithium ion batteries have not been reported so far.
Recently, particle size control of the mesoporous silica template SBA-15 was reported,14 making it possible to control the particle size of MPMOs. Herein, mesoporous crystalline Co3O4 with various particle sizes were synthesised via controlling the particle size of the SBA-15 templates and their charge–discharge characteristics were investigated. It is indicated that the particle size (pore length) of porous electrodes rather than the surface area influenced their electrochemical behavior.
Experimental
The normal SBA-15 was synthesised according to the published literature2 and denoted as SBA-15-N. The SBA-15 with small particle size was synthesised by reducing the concentrations of P123 and TEOS to 1/2, 1/4 in the solution and shortening the aging time to 24 h. These SBA-15 templates obtained were denoted as SBA-15-S2 and SBA-15-S1, respectively. Mesoporous Co3O4 was fabricated by introducing 1.5 mmol of cobalt nitrate into 0.15 g of SBA-15, allowing it to decompose and crystallize into Co3O4 at 400 °C for 5 h. The silica templates were removed in 2 M NaOH solution at 80 °C for 2 h. A series of mesoporous Co3O4 synthesised by using SBA-15-N, -S2 and -S1 were denoted as Co3O4-N, -S2 and -S1, respectively. Bulk Co3O4 was also prepared without using SBA-15 for a comparative experiment.XRD experiments were carried out on an X'Pert PRO MPD diffractometer with Cu-Kα radiation. N2 adsorption–desorption isotherms were recorded on a Quantachrome NOVA 2000e sorption analyzer at liquid nitrogen temperature (77 K). The samples were degassed at 150 °C overnight prior to the measurement. Further structural investigation was performed using transmission electron microscopy (TEM) and high-resolution TEM (HRTEM) on a JEOL JEM-2011 electron microscope operated at 200 kV.
For electrochemical characterisation, the composite electrodes were fabricated by mixing the active materials, acetylene black and polyvinylidene difluoride (PVDF) dissolved in N-methyl-2-pyrrolidine (NMP) in a weight ratio of 70![[thin space (1/6-em)]](https://www.rsc.org/images/entities/char_2009.gif) :
:![[thin space (1/6-em)]](https://www.rsc.org/images/entities/char_2009.gif) 15
15![[thin space (1/6-em)]](https://www.rsc.org/images/entities/char_2009.gif) :
:![[thin space (1/6-em)]](https://www.rsc.org/images/entities/char_2009.gif) 15. The mixed slurry was pressed onto a copper foil and dried at 110 °C in vacuum for 24 h. Cell assembly was carried out in an Ar-filled glove box. The electrolyte was 1 M solution of LiPF6 in EC
15. The mixed slurry was pressed onto a copper foil and dried at 110 °C in vacuum for 24 h. Cell assembly was carried out in an Ar-filled glove box. The electrolyte was 1 M solution of LiPF6 in EC![[thin space (1/6-em)]](https://www.rsc.org/images/entities/char_2009.gif) :
:![[thin space (1/6-em)]](https://www.rsc.org/images/entities/char_2009.gif) DEC
DEC![[thin space (1/6-em)]](https://www.rsc.org/images/entities/char_2009.gif) :
:![[thin space (1/6-em)]](https://www.rsc.org/images/entities/char_2009.gif) DMC with volume ratio 1
DMC with volume ratio 1![[thin space (1/6-em)]](https://www.rsc.org/images/entities/char_2009.gif) :
:![[thin space (1/6-em)]](https://www.rsc.org/images/entities/char_2009.gif) 1
1![[thin space (1/6-em)]](https://www.rsc.org/images/entities/char_2009.gif) :
:![[thin space (1/6-em)]](https://www.rsc.org/images/entities/char_2009.gif) 1. Electrochemical performances were measured with a CR2032-type coin cell with lithium metal as the negative electrode. The galvanostatic charge–discharge performance was measured with a LAND test system at room temperature, and the voltage range was from 0.01 to 3.0 V (versusLi/Li+), with a constant current of 0.5–5 C (1 C = 111 mA h g−1).
1. Electrochemical performances were measured with a CR2032-type coin cell with lithium metal as the negative electrode. The galvanostatic charge–discharge performance was measured with a LAND test system at room temperature, and the voltage range was from 0.01 to 3.0 V (versusLi/Li+), with a constant current of 0.5–5 C (1 C = 111 mA h g−1).
Results and discussion
The structural characterisation of the mesoporous silica templates and corresponding porous Co3O4 was performed by using XRD in a small-angle region. Three characteristic diffraction peaks appeared distinctly in Fig. 1A(a) and 1B(a), indicating that SBA-15-N and Co3O4-N contain long-range structural order. In other words, these porous materials should be large particles containing many ordered channel pores. These peaks can be indexed as the (100), (110) and (200) reflections of an SBA-15 like mesostructure, which is hexagonal, space groupp6mm. The intensity of these diffraction peaks decreased relatively in Fig. 1A(b,c), indicating that the structural ordering of these porous materials reduced, which may result from reducing their particle size. Fig. 1B(b,c) shows the XRD patterns of Co3O4-S2 and -S1 and only two weak peaks can be detected, implying that these porous Co3O4 are small-sized particles and may contain few channel pores. These porous Co3O4 specimens were also performed by using XRD in a wide-angle region and the peaks of XRD patterns (e.g. the inset of Fig. 1B) are indexed to the cubic Co3O4 structure (space groupFd![[3 with combining macron]](https://www.rsc.org/images/entities/char_0033_0304.gif) m).
m).
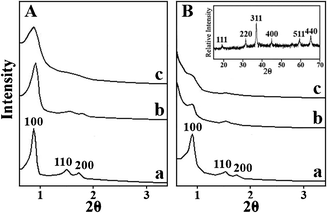 | ||
| Fig. 1 SXRD patterns of A, (a) SBA-15-N; (b) SBA-15-S2; (c) SBA-15-S1 and B, porous (a) Co3O4-N; (b) Co3O4-S2; (c) Co3O4-S1. The inset of (B) is the XRD pattern of Co3O4-S2. | ||
The structural characterisation of mesoporous Co3O4 was also performed by using TEM. Fig. 2(a–c) shows TEM images of Co3O4-S1, Co3O4-S2 and Co3O4-N, respectively. It is obvious that these particles are mesoporous materials, consisting of nanorods in a hexagonal arrangement. Moreover, the average particle size was reduced from Co3O4-N to Co3O4-S1. According to the HRTEM image and the SAED pattern (Fig. 2d), these porous particles are monocrystalline and the mesostructure was not influenced by reducing their particle size. Some nanoparticle aggregates and bulk were also observed as indicated by white arrows in Fig. 2a, which were possibly formed on the top of channel pores or outside of SBA-15-S1 pores. It implies that fabrication of mesoporous particles becomes more difficult with reducing particle size of the template to some extent.
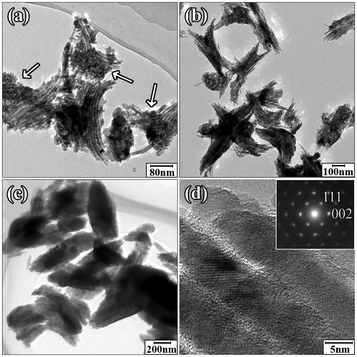 | ||
| Fig. 2 TEM images of (a) Co3O4-N, (b) Co3O4-S2, (c) Co3O4-S1 and HRTEM image of (d) Co3O4-S2. The inset in (d) is a SAED pattern from Co3O4-S2. | ||
The porosities of mesoporous Co3O4 specimens were examined by N2adsorption/desorption. The isotherms of Co3O4-N, Co3O4-S2 and Co3O4-S1 in Fig. 3A(a–c) show type IV curves with a hysteresis loop, indicating that all Co3O4 specimens are mesoporous particles. Fig. 3B shows the pore size distributions of these porous specimens with the peak position at 4.4–4.6 nm. The larger pore of ∼6.5 nm in Co3O4-S1 may be attributed to the space between nonporous Co3O4 nanoparticles. The BET surface areas, pore sizes (determined by the BJH method) and pore volumes of these porous Co3O4 specimens are displayed in Table 1. It is indicated that the pore sizes and pore volumes did not changed dramatically. However, the surface area decreased from Co3O4-N to Co3O4-S1. In theory, the specific surface area of a porous particle should increase when its particle size decreases. However, according to the previous report,14 the specific surface area of the porous silica template decreased with particle size reduction, which may result from a lower yield of porous silica. Therefore, a lower yield of corresponding porous Co3O4 led to significant reduction in surface area. Consequently, the specific surface area of porous Co3O4 decreased with particle size reduction.
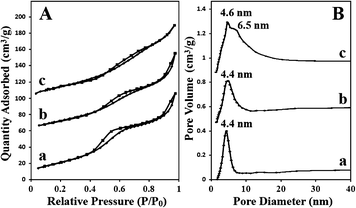 | ||
| Fig. 3 A, N2 adsorption/desorption isotherms measured at 77 K from (a) Co3O4-N; (b) Co3O4-S2; (c) Co3O4-S1 and B, the corresponding pore size distributions. | ||
| Sample | D (nm) | V (cm3 g−1) | S (m2 g−1) |
|---|---|---|---|
| Co3O4-S1 | 4.6 | 0.12 | 67.1 |
| Co3O4-S2 | 4.4 | 0.14 | 73.0 |
| Co3O4-N | 4.4 | 0.18 | 96.3 |
The battery capacities of mesoporous Co3O4 with various particle sizes were examined to explore the influence of pore length on its electrochemical behavior. According to the TEM images and BET data, the pore size (pore diameter) and wall thickness of these porous Co3O4 were estimated to be ca. 4.4–4.6 nm and ca. 7.2–7.5 nm, respectively. Because the values are close to each other, the influence of pore size/wall thickness on the electrochemical behavior13 would be negligible. The particle sizes of Co3O4-S1, Co3O4-S2 and Co3O4-N obtained from more than 100 randomly selected particles were collected by TEM observation and are shown in Fig. 4. Here the particle size mentioned is the pore length, namely the length from the top of one channel pore to another top. Co3O4-S1 particles have the narrowest particle size distribution range of 100 nm up to 600 nm in comparison with Co3O4-S2 (100–900 nm) and Co3O4-N (200–1100 nm) particles. The average particle sizes of Co3O4-S1, Co3O4-S2 and Co3O4-N are measured, respectively, to be ca. 200, 300 and 400 nm, which is consistent with the results of SXRD patterns (Fig. 1B).
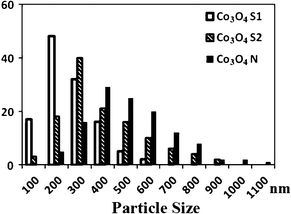 | ||
| Fig. 4 Particle size distribution of Co3O4-S1, Co3O4-S2 and Co3O4-N specimens, respectively. | ||
Fig. 5A shows the first cycle charge–discharge voltage profiles for Co3O4-S1, Co3O4-S2, Co3O4-N and bulk Co3O4. The curves from these porous Co3O4 are similar to previous reports,7,11 indicating the same electrochemical pathway. The first discharge capacity of Co3O4-S1, Co3O4-S2, Co3O4-N and bulk Co3O4 is 1121.8, 1143.5, 1028.9 and 970.7 mA h g−1, respectively. Obviously, porous Co3O4 exhibited relatively higher discharge capacities than bulk Co3O4 due to their large surface areas.11 However, Co3O4-S1 and Co3O4-S2 samples with lower surface areas exhibited higher discharge capacities than Co3O4-N, indicating that, to porous anodes, the particle size (pore length) rather than the surface area influenced the battery capacities. Moreover, Fig. 5B shows the rate capabilities for different mesoporous Co3O4 specimens. Although the first discharge capacities of mesoporous Co3O4 decreased with increasing the current density due to the low electronic conductivity of Co3O4, porous Co3O4 with small particle sizes still exhibited higher capacities than those with large particle sizes. The first cycle capacity retention ratio of 78–79% for small porous particles is higher than that of 72% for large porous particles when the current density is increased from 0.5 C to 5 C. The 2nd–5th cycle charge–discharge curves and the Coulombic efficiencies for these porous Co3O4 are shown in Fig. S1 (ESI†). The Coulombic efficiencies of 73–75% in the first cycles are lower compared to those of over 80% in the 2nd–5th cycles because Co3O4 is a conversion electrode and a large irreversible loss in the first cycle is inevitable. Additionally, the cycling performance of Co3O4 materials is not good because isolated grains were formed after several cycles, leading to severe electrical isolation and hence capacity fade.7 However, Fig. S2 (ESI†) shows that porous Co3O4 with small particle sizes still exhibited a much better cycling performance than those with large particle sizes.
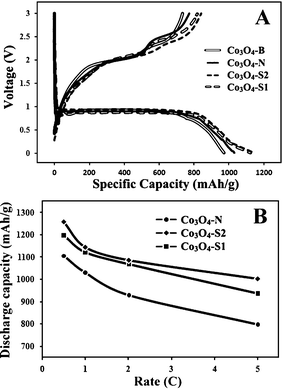 | ||
| Fig. 5 A, the first cycle charge–discharge curves for Co3O4-S1, Co3O4-S2, Co3O4-N and Co3O4-B (Bulk Co3O4) at 1 C in the voltage range 0.01–3.0 V and B, the first discharge capacities for different mesoporous Co3O4 as a function of rate. | ||
A possible explanation is that the electrolyte usually migrated into the pores of porous particles by capillary action. Therefore, the electrolyte may not fill up the pores of large porous Co3O4 particles, which lead to fewer amounts of Co3O4 involved in either the intercalation reaction or the conversion reaction (Scheme 1). Reducing the pore length of porous Co3O4 may increase the percentage of Li+ intercalated Co3O4 and conversion of Co3O4, leading to enhancement of charge–discharge capacity and rate capability. On the other hand, the short pore length of porous Co3O4 leading to a short Li-ion diffusion path in the pores, also influences its lithium storage, kinetically. In other words, although the surface area of porous MPMOs with large particle size is larger due to the higher yield, the amount of Li+ intercalated Co3O4 and conversion of Co3O4 is lower, leading to the decrease in the capacity and the rate capability. Additionally, the Co3O4-S1 exhibited a slightly lower capacity and rate capability than Co3O4-S2, which may be attributed to the lower yield of porous Co3O4 (Fig. 2a).
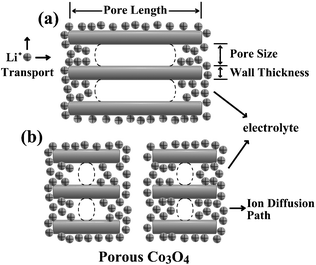 | ||
| Scheme 1 Schematic diagram depicting the Li+ migration and intercalation/conversion in porous Co3O4 with (a) large particle size and (b) small particle size. | ||
Conclusions
A series of porous Co3O4 with various particle sizes were synthesised via controlling the particle size of SBA-15 templates. Porous Co3O4 with small particle sizes exhibited higher charge–discharge capacity and rate capability in lithium-ion batteries than those with large particle sizes. This can be explained as that small porous particles allow the electrolyte to fill up the pores, increasing the percentage of Li+ intercalated Co3O4 and conversion of Co3O4. Additionally, the short pore length of porous Co3O4 leads to a short Li-ion diffusion path in the pores. Therefore, the electrochemical behavior of porous electrodes in lithium-ion batteries may be further improved by control of their particle size.Acknowledgements
This work was supported by the Fundamental Research Funds for the Central Universities and National Natural Science Foundation of China 50872012 and 21101014.References
- J. S. Beck, J. C. Vartuli, W. J. Roth, M. E. Leonowicz, C. T. Kresge, K. D. Schmitt, C. T.-W. Chu, D. H. Olson, E. W. Sheppard, S. B. McCullen, J. B. Higgins and J. L. Schlenker, J. Am. Chem. Soc., 1992, 114, 10834 CrossRef CAS.
- D. Y. Zhao, J. L. Feng, Q. S. Huo, N. Melosh, G. H. Fredrickson, B. F. Chmelka and G. D. Stucky, Science, 1998, 279, 548 CrossRef CAS.
- (a) P. D. Yang, D. Y. Zhao, D. I. Margolese, B. F. Chmelka and G. D. Stucky, Nature, 1998, 396, 152 CrossRef CAS; (b) P. D. Yang, D. Y. Zhao, D. I. Margolese, B. F. Chmelka and G. D. Stucky, Chem. Mater., 1999, 11, 2813 CrossRef CAS.
- (a) E. L. Crepaldi, G. J. A. A. Soler-Illia, D. Grosso, F. Cagnol, F. Ribot and C. Sanchez, J. Am. Chem. Soc., 2003, 125, 9770 CrossRef CAS; (b) T. Brezesinski, A. Fischer, K. Iimura, C. Sanchez, D. Grosso, M. Antonietti and B. M. Smarsly, Adv. Funct. Mater., 2006, 16, 1433 CrossRef CAS.
- (a) B. Z. Tian, X. Y. Liu, H. F. Yang, S. H. Xie, C. Z. Yu, B. Tu and D. Y. Zhao, Adv. Mater., 2003, 15, 1370 CrossRef CAS; (b) W. B. Yue and W. Z. Zhou, J. Mater. Chem., 2007, 17, 4947 RSC.
- (a) W. H. Shen, X. P. Dong, Y. F. Zhu, H. R. Chen and J. L. Shi, Microporous Mesoporous Mater., 2005, 85, 157 CrossRef CAS; (b) Y. G. Wang and Y. Y. Xia, Electrochim. Acta, 2006, 51, 3223 CrossRef CAS; (c) T. Waitz, T. Wagner, T. Sauerwald, C.-D. Kohl and M. Tiemann, Adv. Funct. Mater., 2009, 19, 653 CrossRef CAS.
- K. M. Shaju, F. Jiao, A. Debart and P. G. Bruce, Phys. Chem. Chem. Phys., 2007, 9, 1837 RSC.
- L. Dupont, S. Laruelle, S. Grugeon, C. Dickinson, W. Z. Zhou and J.-M. Tarascon, J. Power Sources, 2008, 175, 502 CrossRef CAS.
- (a) J. Y. Luo, J. J. Zhang and Y. Y. Xia, Chem. Mater., 2006, 18, 5618 CrossRef CAS; (b) F. Jiao and P. G. Bruce, Adv. Mater., 2007, 19, 657 CrossRef CAS.
- (a) W. B. Yue, X. X. Xu, J. T. S. Irvine, P. S. Attidekou, C. Liu, H. Y. He, D. Y. Zhao and W. Z. Zhou, Chem. Mater., 2009, 21, 2540 CrossRef CAS; (b) W. B. Yue, C. Randorn, P. S. Attidekou, J. T. S. Irvine and W. Z. Zhou, Adv. Funct. Mater., 2009, 19, 2826 CrossRef CAS.
- (a) X. Wang, L. J. Yu, X.-L. Wu, F. L. Yuan, Y.-G. Guo, Y. Ma and J. N. Yao, J. Phys. Chem. C, 2009, 113, 15553 CrossRef CAS; (b) B. Guo, C. S. Li and Z.-Y. Yuan, J. Phys. Chem. C, 2010, 114, 12805 CrossRef CAS.
- (a) X. W. Lou, D. Deng, J. Y. Lee, J. Feng and L. A. Archer, Adv. Mater., 2008, 20, 258 CrossRef CAS; (b) G. S. Wang, Y. Deng and L. Guo, Chem.–Eur. J., 2010, 16, 10220 CrossRef CAS.
- Y. Ren, A. R. Armstrong, F. Jiao and P. G. Bruce, J. Am. Chem. Soc., 2010, 132, 996 CrossRef CAS.
- X. L. Ji, K. T. Lee, M. Monjauze and L. F. Nazar, Chem. Commun., 2008, 4288 RSC.
Footnote |
| † Electronic supplementary information (ESI) available: 2nd–5th cycle charge–discharge curves, Coulombic efficiency and cycling performance. See DOI: 10.1039/c1ra00503k |
| This journal is © The Royal Society of Chemistry 2012 |
