Graphene oxide gives rise to unique and intriguing voltammetry†
Dale A. C.
Brownson
a,
Alexandre C.
Lacombe
a,
Maria
Gómez-Mingot
b and
Craig E.
Banks
*a
aFaculty of Science and Engineering, School of Science and the Environment, Division of Chemistry and Environmental Science, Manchester Metropolitan University, Chester Street, Manchester, M1 5GD, Lancs, UK. E-mail: c.banks@mmu.ac.uk; Fax: +44 (0) 1612476831; Tel: +44 (0) 1612471196
bPhysical Chemistry Department and Institute of Electrochemistry, University of Alicante, 03690, San Vicente del Raspeig, Alicante, Spain
First published on 16th November 2011
Abstract
Graphene oxide is explored as a potential electrode material and shown for the first time to exhibit unique voltammetric profiles towards select redox probes. This unique voltammetry provides a route for characterising graphene oxide, providing a simple methodology for the determination of the complete chemical or electrochemical reduction of graphene oxide to graphene prior to its application in a plethora of areas.
Introduction
Graphene oxide (GO), while not a new material,1,2 has been reported to be beneficial in a number of technological areas within electrochemistry, such as in the fabrication of microbial fuel cells,3 supercapacitors,4vanadium redox flow batteries,5 and as the foundation in a tyrosinase biosensor.6 Additionally GO has been employed in the monitoring of nucleic acids,7 sensing of adenine and guanine,8 and decoration with platinum to simultaneously characterise ascorbic acid, dopamine and uric acid levels.9 There is a vast array of literature where GO is electrochemically10 or chemically11 reduced to graphene prior to its implementation into a cornucopia of potential applications.12 It is apparent from the literature that the basic voltammetric understanding of GO before and after being reduced to graphene is clearly lacking, where researchers fail to perform diligent control experiments, such as the electrochemical probing of the supporting (underlying) electrode substrate before modification and following reduction to graphene.Consequently, in this paper we explore GO as an electrode material and investigate commonly encountered redox probes which can provide information on the electronic properties of this intriguing material. We report for the first time that unique voltammetry can be observed at GO, which subsequently can be utilised to characterise the presence or absence of GO and thus validate the completion of a successful reduction from GO to ‘true’ graphene as commonly employed throughout the literature.
Experimental section
All chemicals (analytical grade or higher) were used as received from Sigma-Aldrich without any further purification. All solutions were prepared with deionised water of resistivity not less than 18.2 MΩ cm and were vigorously degassed with high purity, oxygen free nitrogen prior to electrochemical measurements.Voltammetric measurements were performed using a PalmSens handheld potentiostat. All measurements were conducted using a three electrode system. The edge plane pyrolytic graphite (EPPG) working electrode (Le Carbone, Ltd. Sussex, U.K) was machined into a 4.9 mm diameter, with the disc face parallel to the edge plane as required from a slab of highly ordered pyrolytic graphite (HOPG) (highest grade available: SPI-1, equivalent to Union Carbide's ZYA grade, with a lateral grain size, La of 1–10 μm and 0.4 ± 0.1° mosaic spread); alternatively, the basal plane pyrolytic graphite (BPPG) working electrode (4.9 mm diameter, Le Carbone, Ltd. Sussex, U.K) was machined as above however with the disc face parallel to the basal plane as required. A platinum wire and a saturated calomel electrode (SCE) were used as counter and reference electrodes respectively.
Commercially available GO was purchased from ‘Graphene Supermarket’ (Reading, MA, USA)13 and consists of ‘single layered graphene oxide dispersed in water’ at a concentration of 275 mg L−1. The GO was synthesised using a modified Hummers oxidation method, that has been reported and characterised previously,2,14 and has an average flake size of between 0.5 and 5.0 micrometres and a thickness of 1 atomic layer with at least 80% of the sample being single layer GO.13 A typical SEM image of the GO supplied by the manufacturer is presented in Fig. 1. XPS analysis was performed on the sample: de-convolution of the XPS spectra reveals 59% (284.6 eV) to correspond to graphitic groups, with 29% (286.8 eV) characteristic of C–O bonds and 11.5% (288.2 eV) corresponding to C![[double bond, length as m-dash]](https://www.rsc.org/images/entities/char_e001.gif) O bonds, which is in excellent agreement with previous literature reports regarding GO.15,16
O bonds, which is in excellent agreement with previous literature reports regarding GO.15,16
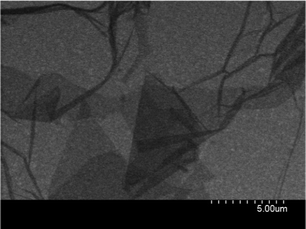 | ||
| Fig. 1 A typical SEM image of the commercially available graphene oxide, as provided by the manufacturer.13 | ||
Once received from the supplier, aliquots of the GO were carefully pipetted onto the electrode surface using a micro-pipette and dried under heat (50 °C) before being allowed to cool to room temperature, following which the electrode could either be further modified or was ready to use.
Results and discussion
We first consider the voltammetric response of GO using the ferro-/ferri- cyanide redox probe in 1 M potassium chloride. Fig. 2 depicts a typical voltammetric profile obtained at a BPPG electrode following modification with 13.75 μg of GO, which exhibits a well defined pair of redox peaks with a peak-to-peak separation of ca. 90 mV (at 100 mVs−1), where in comparison to widely reported literature values for an unmodified BPPG electrode (ca. 240 at 100 mVs−1)17,18 an improvement in the electrochemical reversibility of the redox probe at GO is evident over that of the underlying electrode. A scan rate study was performed where the voltammetric peak height (IP) was monitored as a function of scan rate (ν) with a plot of peak height versus square-root of the scan rate revealing a linear response (IP (A) = 3.16 × 10⁻⁵ A/(Vs−1)0.5 + 1.32 × 10⁻⁶ A; R2 = 0.99) indicating a diffusional process; furthermore, as is expected for the case of the semi-infinite diffusion model as governed by the Randles–Ševćik equation, analysis of log IPversus log ν revealed a gradient of 0.41, indicating the absence of thin-layer effects.19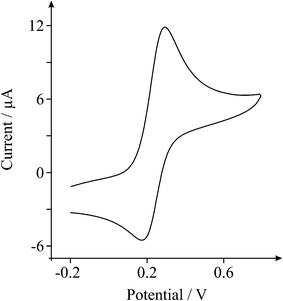 | ||
| Fig. 2 A typical cyclic voltammetric profile recorded towards 1 mM potassium ferrocyanide (II) in 1 M KCl, obtained using a BPPG electrode after modification with 13.75 μg of GO. Scan rate: 100 mVs−1 (vs.SCE). | ||
The ferro-/ferri- cyanide redox probe is known to be complex on carbon surfaces, influenced by specific surface sites, and is consequently termed as an ‘inner-sphere’ redox probe;20,21 thus the voltammetric response observed at GO in Fig. 2 can likely be attributed to both electronic factors and specific surface interactions, which are not easily de-convoluted. Interestingly there is a clear lack of literature reports regarding the utilisation of GO towards this redox probe. We thus turn to exploring the voltammetric characteristics of GO towards ‘outer-sphere’ redox probes which do not have any surface sensitivity.20
The voltammetric response of GO in 1 mM hexaammine-ruthenium(III) chloride/1 M potassium chloride was next sought. Fig. 3 depicts typically observed voltammetric profiles where upon increasing the amount of immobilised GO, a unique voltammetric response is observed. Note that such a response, to the best of our knowledge, has never been reported before on graphitic surfaces and consequently derives entirely from the introduction of the GO.
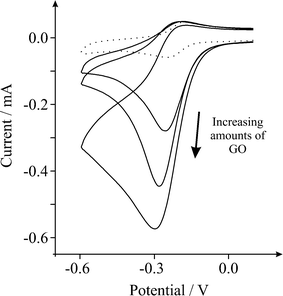 | ||
| Fig. 3 Cyclic voltammetric profiles recorded towards 1 mM hexaammine-ruthenium(III) chloride in 1 M KCl, obtained using an EPPG electrode (dotted line) after modification with increasing depositions of 1.38, 2.75 and 8.25 μg GO (solid lines). Scan rate: 100 mVs−1 (vs.SCE). | ||
To further explore this unique response, the ‘outer-sphere’ redox probe, potassium hexachloroiridate (III) in 1 M potassium chloride—which has been shown to exhibit reversible voltammetric responses on graphitic surfaces,21 is next explored. The voltammetric response observed using GO is presented in Fig. 4 which again yields unique voltammetry. To our knowledge, surprisingly, both of these redox probes have not been previously explored utilising GO.
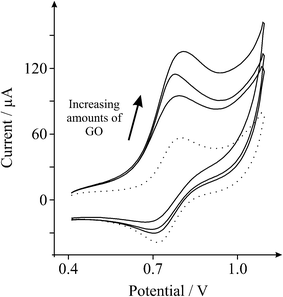 | ||
| Fig. 4 Cyclic voltammetric profiles recorded towards 1 mM potassium hexachloroiridate (III) in 1 M KCl, obtained using an EPPG electrode (dotted line) after modification with increasing depositions of 1.38, 2.75 and 5.50 μg GO (solid lines). Scan rate: 100 mVs−1 (vs.SCE). | ||
The observed voltammetric profiles presented in Fig. 3 and 4 appear characteristic of a catalytic process, the EC’ reaction, where a first ‘electron transfer process’ (E process), as described generally as:
| A + e− ⇌ B | (E Step) |
 | (C Step) |
It is evident from Fig. 3 and 4, as the amount of graphene oxide is increased, the observed cyclic voltammetric profile is perturbed such that in Fig. 3 the reduction peak increases with a decrease in the magnitude of the oxidation peak, which is characteristic of the above EC’ reaction where B (the electro-generated product, reduced hexaammine-ruthenium(III) chloride) is consumed and regenerates A (hexaammine-ruthenium(III) chloride). The voltammetric response arises as the amount of C is increased (the oxygenated species in this case). The effect of the voltammetric scan rate is shown in Fig. 5, where upon applying faster scan rates a respective increase in the magnitude of the back (oxidation) peak is evident, as well as a reduction in the forward (reduction) peak since the reversible A/B process is unperturbed by the catalytic chemical C step; where at higher scan rates the rate of reaction of the reversible E step is prevalent over that of the rate of reaction, k, of the C step which resultantly partakes to a lesser extent and thus there is a reduction in the observed unique feature (EC’ reaction). Such a response highly suggests that as the GO coverage is increased, which has a large proportion of oxygenated species, the amount of oxygenated species catalyse the chemical reaction of transforming the electrochemically generated species B back into A, hence a catalytic-type voltammetric signal is observed.
 | ||
| Fig. 5 Cyclic voltammetric profiles recorded towards 1 mM hexaammine-ruthenium(III) chloride in 1 M KCl, obtained using an EPPG electrode (dotted line) after modification with 1.4 μg (dashed line) and 5.5 μg graphene oxide (solid line). Scan rates: 5 (A), 100 (B) and 1000 (C) mVs−1 (vs.SCE). | ||
Further insights can be gained through consecutive scan analysis of the GO modified electrode, where as evident in Fig. 6 the second-cycle voltammetric scan exhibits a clear reduction in the magnitude of the unique feature (i.e. the reduction peak exhibits a significantly decreased IP in this case), such that it is evident that the oxygenated species are ‘exhausted’ in the first reductive cycle. Interestingly, when scanning the potential anodically to induce the re-introduction of surface oxygenated species, an approach commonly employed in the literature,22–24 it is evident that this ‘anodic activation’ regenerates the surface oxygenated species, where the magnitude of the reduction peak at further cycles is thus returned to that of the first initial cycle at the GO modified electrode. This response is self-sustaining upon successive scans where the unique voltammetric profile remains stable owing to the anodic activation and thus re-introduction of surface oxygenated species between each successive scan; this key experimental observation confounds our theory as described above, viz the EC’ reaction, that the oxygenated species give rise to this unique and exiting voltammetry.
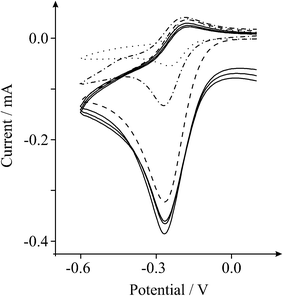 | ||
| Fig. 6 Cyclic voltammetric profiles recorded towards 1 mM hexaammine-ruthenium(III) chloride in 1 M KCl, obtained using an unmodified EPPG electrode (dotted line) and an EPPG electrode following modification with 2.75 μg GO (first-cycle: dashed line / second-cycle: dot-dashed line). Solid lines represent further consecutive cycles (third–fifth) at the GO modified EPPG electrode following anodic activationvia scanning the potential up to +1.6 V. Scan rate: 100 mVs−1 (vs.SCE). | ||
Note that such responses at GO have never been observed before in the literature, and this work highlights that the large proportion of oxygenated species present on GO could be beneficially utilised in electrochemistry where oxygenated electro-catalytic reactions are employed. Note that since the electrochemical response of graphene towards such redox probes does not exhibit this unique behaviour,17 these observations can be utilised to test for the presence of ‘true’ graphene and for the completion of a successful reduction of GO to graphene. Furthermore, note the difference in voltammetric characteristics of the explored redox probes, where a catalytic response of greater intensity is evident for the hexaammine-ruthenium(III) chloride over that of the hexachloroiridate (III) complex, which likely arises due to differing structures of the transition complexes where the two reactions are chemically distinct.
We note that a similar response has been reported for the utilisation of nanodiamond towards the IrCl6 redox probe where the mechanism inferred surface states;25 while the mechanism in our case for GO is not completely determined, this may also be a potential possibility. However, we benevolently note that Kovach et al.26 found nearly identical voltammetric responses at a heavily electrochemically oxidised carbon-fibre electrode towards the Ru(NH3)6 redox probe, which was attributed to the large degree of oxygenated species. Hence, this adds weight to our inference that the reaction mechanism at GO is due to surface oxygenated species.
Conclusions
We have demonstrated for the first time that unique and intriguing voltammetry can be observed at GO modified electrodes. We have highlighted the fascinating nature of this remarkable material and shown that GO can be utilised beneficially where oxygenated electro-catalytic reactions are employed. Note that these voltammetric responses could be used by researchers to confirm that GO has been reduced to graphene, via chemical or electrochemical means, owing to the contrasting behaviours of these materials; work on this is currently underway.References
- B. C. Brodie, Proc. R. Soc. London, Ser., 1859, 10, 249 Search PubMed.
- W. S. Hummers and R. E. Offeman, J. Am. Chem. Soc., 1958, 80, 1339 CrossRef CAS.
- Y.-X. Huang, X.-W. Liu, J.-F. Xie, G.-P. Sheng, G.-Y. Wang, Y.-Y. Zhang, A.-W. Xu and H.-Q. Yu, Chem. Commun., 2011, 47, 5795 RSC.
- S. H. Aboutalebi, A. T. Chidembo, M. Salari, K. Konstantinov, D. Wexler, H. K. Liu and S. X. Dou, Energy Environ. Sci., 2011, 4, 1855 CAS.
- P. X. Han, H. B. Wang, Z. H. Liu, X. A. Chen, W. Ma, J. H. Yao, Y. W. Zhu and G. L. Cui, Carbon, 2011, 49, 693 CrossRef CAS.
- W. Song, D.-W. Li, Y.-T. Li, Y. Li and Y.-T. Long, Biosens. Bioelectron., 2011, 26, 3181 CrossRef CAS.
- M. Muti, S. Sharma, A. Erdem and P. Papakonstantinou, Electroanalysis, 2011, 23, 272 CrossRef CAS.
- Y. Fan, K.-J. Huang, D.-J. Niu, C.-P. Yang and Q.-S. Jing, Electrochim. Acta, 2011, 56, 4685 CrossRef CAS.
- C.-L. Sun, H.-H. Lee, J.-M. Yang and C.-C. Wu, Biosens. Bioelectron., 2011, 26, 3450 CrossRef CAS.
- M. Zhou, Y. Wang, Y. Zhai, J. Zhai, W. Ren, F. Wang and S. Dong, Chem.–Eur. J., 2009, 15, 6116 CrossRef CAS.
- D. Li, M. B. Müller, S. Gilje, R. B. Kaner and G. G. Wallace, Nat. Nanotechnol., 2008, 3, 101 CrossRef CAS.
- J. Wang, S. Yang, D. Guo, P. Yu, D. Li, J. Ye and L. Mao, Electrochem. Commun., 2009, 11, 1892 CrossRef CAS.
- http://www.graphene-supermarket.com .
- D. R. Dreyer, S. Park, C. W. Bielawski and R. S. Ruoff, Chem. Soc. Rev., 2010, 39, 228 RSC.
- J.-L. Chang, K.-H. Chang, C.-C. Hu, W.-L. Cheng and J.-M. Zen, Electrochem. Commun., 2010, 12, 596 CrossRef CAS.
- T. Szabó, O. Berkesi, P. Forgó, K. Josepovits, Y. Sanakis, D. Petridis and I. Dekany, Chem. Mater., 2006, 18, 2740 CrossRef.
- D. A. C. Brownson, L. J. Munro, D. K. Kampouris and C. E. Banks, RSC Adv., 2011, 1, 978 RSC.
- D. K. Kampouris and C. E. Banks, Chem. Commun., 2010, 46, 8986 RSC.
- P. M. Hallam and C. E. Banks, Electrochem. Commun., 2011, 13, 8 CrossRef CAS.
- R. L. McCreery, Chem. Rev., 2008, 108, 2646 CrossRef CAS.
- X. Ji, C. E. Banks, A. Crossley and R. G. Compton, ChemPhysChem, 2006, 7, 1337 CrossRef CAS.
- F. G. Gonon, C. M. Fombarlet, M. J. Buda and J. F. Pujol, Anal. Chem., 1981, 53, 1386 CrossRef CAS.
- J.-X. Feng, M. Brazell, K. Renner, R. Kasser and R. N. Adams, Anal. Chem., 1987, 59, 1863 CrossRef CAS.
- J. Wang and P. Tuzhi, Anal. Chem., 1986, 58, 1787 CrossRef CAS.
- K. B. Holt, D. J. Caruana and E. J. Millan-Barrios, J. Am. Chem. Soc., 2009, 131, 11272 CrossRef CAS.
- P. M. Kovach, M. R. Deakin and R. M. Wightman, J. Phys. Chem., 1986, 90, 4612 CrossRef CAS.
Footnote |
| † Electronic Supplementary Information (ESI) available. See DOI: 10.1039/c1ra00743b/ |
| This journal is © The Royal Society of Chemistry 2012 |
