A mechanistic study on the electrocatalysis of the Pu(IV)/Pu(III) redox reaction at a platinum electrode modified with single-walled carbon nanotubes (SWCNTs) and polyaniline (PANI)†
Ruma
Gupta
,
Saurav K.
Guin
and
Suresh K.
Aggarwal
*
Fuel Chemistry Division, Bhabha Atomic Research Centre, Mumbai 400 085, India. E-mail: skaggr2002@rediffmail.com; Fax: +91 22 2550 5151; Tel: +91 22 2559 3740
First published on 5th January 2012
Abstract
The electrochemistry of the Pu(IV)/Pu(III) couple in 1 M sulphuric acid solution was studied on bare and modified platinum electrodes by cyclic voltammetry and electrochemical impedance spectroscopy. The platinum electrode was separately modified with single-walled carbon nanotubes (SWCNT-Pt) and polyaniline (PANI-Pt). The modified electrodes were characterized by scanning electron microscopy (SEM) and energy dispersive X-ray fluorescence (EDXRF). Electrocatalysis of the Pu(IV)/Pu(III) redox reaction was observed on both SWCNT-Pt and PANI-Pt. However, PANI-Pt showed better catalytic action for the electron transfer reaction of the Pu(IV)/Pu(III) couple. The Pu(IV)/Pu(III) couple showed quasi-reversible electron transfer behavior on a bare platinum electrode because of the PtO layer formation by the Pu(IV) solution at the electrode–electrolyte interface. In SWCNT-Pt, the direct interaction between Pu(IV) and platinum was blocked by SWCNTs and it diminished the oxide layer formation at the interface. The lower charge transfer resistance at SWCNT-Pt also promoted the rate of electron transfer reaction of the Pu(IV)/Pu(III) couple. Electrocatalysis of the Pu(IV)/Pu(III) couple on PANI-Pt was attributed to the cumulative effect of the Donnan interaction between the PANI and Pu(IV) anionic complex, specific adsorption of Pu(IV) on the reactive centres, low charge transfer resistance across the electrode–electrolyte interface and a catalytic chemical reaction coupled with the electron transfer reaction. To the best of our knowledge, this paper presents the first evidence of the electrocatalysis of actinides on SWCNT and PANI modified electrodes along with the detailed investigations of their electrocatalysis mechanisms.
1. Introduction
Electrochemical studies on actinides in aqueous solution are challenging as well as interesting because of their complexity and analytical importance. Plutonium (Pu) is one of the actinide elements used as a nuclear fuel in power reactors. It can exist in different oxidation states ranging from III to VII in the aqueous solutions. A simple, fast, accurate and precise determination of Pu is desirable for the purpose of quality assurance of nuclear fuels and for the accounting of nuclear materials. The coulometric technique on the platinum electrode with the reversible Pu(IV)/Pu(III) couple in mineral acids is most frequently followed for the accurate determination of Pu.1–12 1–3 M sulphuric acid (H2SO4), depending on the amount of Pu, gives satisfactory results by coulometry. However, the fouling of platinum electrodes is encountered very often because of its passivation by an oxide layer or due to the adsorption of some organic molecules present in the analyte solution.1,8,13–15 This has motivated electrochemists to develop an alternative working electrode which can give a better performance than the platinum electrode. In this context, glassy carbon or graphite is used as a suitable alternative to the platinum electrode. However, the difficulties experienced in the machining of large cylindrical shaped electrodes (suitable for coulometric analysis) from these materials limits their application in coulometric titration. Therefore, we focused on the development of a platinum based modified electrode that would be easy to prepare and at the same time would provide better analytical performance than the bare platinum electrode.Carbon nanotubes are interesting modifiers that offer unique mechanical and electrical properties combined with good chemical stability. Single-walled carbon nanotubes (SWCNTs) are well defined systems in terms of their electronic properties. The SWCNTs coated platinum electrode may have the potential to improve the electroanalytical behaviour of the Pu(IV)/Pu(III) couple by virtue of its higher surface to volume ratio and unique electronic property.
Polyaniline (PANI) is a conducting polymer which is compatible with aqueous mineral acid solutions, easy to synthesise and shows good electrical conductivity and environmental stability. It showed the ability to catalyze the electron transfer reactions of certain metal ions.16 Our previous experiences in the electrocatalytic behavior of PANI on Fe(III)/Fe(II) redox reaction and the effect of ionic speciation in the electrocatalysis mechanism motivated us to investigate the electroanalytical performance of PANI on the Pu(IV)/Pu(III) couple.16 There were two motivating aspects, firstly the redox potentials of Fe(III)/Fe(II) and Pu(IV)/Pu(III) couples are close by in 1 M H2SO4 and secondly, the existence of Pu(IV) as an anionic complex in 1 M H2SO4.
In this work, we report the investigations carried out on the chemistry of the Pu(IV)/Pu(III) redox reaction on platinum electrode modified with SWCNTs and PANI, independently. A detailed investigation was also carried out to understand the electrocatalytic mechanism of the Pu(IV)/Pu(III) couple at the modified electrodes. To the best of our knowledge, this is the first evidence of the electrocatalysis of actinides on SWCNT and PANI modified electrodes along with the detailed investigations of their electrocatalysis mechanisms. Electrochemistry was used here as a probing tool to investigate the electron transfer behaviour at the ion-substrate interface. Not only that, a detailed analytical investigation was also carried out to comprehend the difference of catalytic action provided by SWCNTs and PANI for the same [Pu(IV)/Pu(III)] redox couple. The content of this paper might be useful for general readers to comprehend the catalytic action of SWCNTs and PANI in any system.
2. Experimental
2.1. Chemicals and materials
All the chemicals like aniline, nafion (sulfonated tetrafluoroethylene based fluoropolymer-copolymer) and sulphuric acid (H2SO4) were of G. R. (Guaranteed Reagent) grade and used as received. Functionalized (with carboxylic acid group) and non-functionalized single walled carbon nanotubes (SWCNTs) of purity greater than 98% were used as received. The length and the diameter of the both types of SWCNTs were in the range of 0.7–2 nm and 3–8 μm, respectively. All the solutions were prepared in Millipore Milli-Q water (∼18 MΩ cm).2.2. Preparation of Pu(IV) solution in 1 M H2SO4
The working reference, potassium plutonium sulphate dihydrate (K4Pu(SO4)4·2H2O) was prepared in our laboratory as described elsewhere.17 In brief, crystals of (K4Pu(SO4)4·2H2O) were first prepared by the slow evaporation of 1 M H2SO4 containing K2SO4 and Pu(SO4)2 in a 2![[thin space (1/6-em)]](https://www.rsc.org/images/entities/char_2009.gif) :
:![[thin space (1/6-em)]](https://www.rsc.org/images/entities/char_2009.gif) 1 molar ratio. Then the crystals were washed several times with absolute alcohol and dried in a current of air. The anhydrous K4Pu(SO4)4 was prepared by heating the hydrated crystals at 340 °C for about three hours until constant weight. A known amount of the anhydrous standard K4Pu(SO4)4 was quantitatively dissolved in 15 mL of 3M HNO3 and the dissolved solution was fumed with 1 M H2SO4 to convert it into sulfate form. The residue was again treated with 1 M H2SO4 and evaporated to dryness. This particular step was repeated several times to ensure the complete removal of nitrate. Finally, 25 mM Pu(IV) in 1 M H2SO4 was prepared by quantitatively diluting the residue with 1M H2SO4.
1 molar ratio. Then the crystals were washed several times with absolute alcohol and dried in a current of air. The anhydrous K4Pu(SO4)4 was prepared by heating the hydrated crystals at 340 °C for about three hours until constant weight. A known amount of the anhydrous standard K4Pu(SO4)4 was quantitatively dissolved in 15 mL of 3M HNO3 and the dissolved solution was fumed with 1 M H2SO4 to convert it into sulfate form. The residue was again treated with 1 M H2SO4 and evaporated to dryness. This particular step was repeated several times to ensure the complete removal of nitrate. Finally, 25 mM Pu(IV) in 1 M H2SO4 was prepared by quantitatively diluting the residue with 1M H2SO4.
2.3. Electrochemical measurements
Electrochemical polymerization of aniline, cyclic voltammetry and differential pulse voltammetry were performed using a CHI 440A Electrochemical Workstation with a three electrode voltammetric cell having platinum disk working electrode (area, A = 0.031 cm2), platinum wire counter electrode and an Ag/AgCl reference electrode. All the potentials are quoted with respect to the Ag/AgCl (3 M KCl) reference electrode. All the experiments were carried out at room temperature (25 ± 1 °C). All solutions were deoxygenated using high purity nitrogen prior to electrochemical experiments. Each measurement was repeated thrice and the average numerical value of each parameter is quoted for discussion (relative error < ± 0.1%).Electrochemical impedance spectroscopy (EIS) was performed using Autolab PGSTAT20 with FRA2 (Eco-Chimie) software. Impedance was recorded at open circuit potentials with single sine excitation signal of 0.005 V for the frequency range 106 Hz–10−2 Hz. Impedance spectra were fitted to electrical equivalent circuits (EEC) and the fits had χ2 ≤ 10−2. Errors of all the calculated parameters were within 5% of the reported values.
2.4. Morphological and elemental characterization of the modified electrodes
The morphology of PANI-Pt and SWCNT-Pt was recorded by Seron Incorporation AIS 2100 scanning electron microscope. An EDXRF spectrum was recorded by Jordan Valley EX-3600-TEC spectrometer having Rh target and Ge secondary target operated at 40 kV and 500 μA.2.5. Preparation of SWCNTs modified platinum electrode (SWCNT-Pt)
The stable colloidal dispersions of both the functionalized and non-functionalized SWCNTs were separately prepared by sonicating ∼1 mg of SWCNTs for one hour in a 1![[thin space (1/6-em)]](https://www.rsc.org/images/entities/char_2009.gif) :
:![[thin space (1/6-em)]](https://www.rsc.org/images/entities/char_2009.gif) 4 mixture of nafion and water. The SWCNT-Pt electrode was prepared by dropping a known volume (1–20 μL) of the SWCNT suspension on the platinum electrode followed by drying. The preparation condition was optimized by studying the cyclic voltammograms of 25 mM Pu(IV) in 1M H2SO4 at a scan rate of 20 mV s−1 recorded on each modified electrode (Fig. S1, ESI†). The redox peak currents of the Pu(IV)/Pu(III) couple increased by increasing the volume of the SWCNT suspension on the platinum electrode, but a maximum peak current was observed for 20 μL of SWCNT suspension. Some of the suspension dropped out from the electrode surface for suspension volumes higher than 20 μL. Therefore, the platinum electrode was modified with 20 μL of SWCNT suspension for all further experiments.
4 mixture of nafion and water. The SWCNT-Pt electrode was prepared by dropping a known volume (1–20 μL) of the SWCNT suspension on the platinum electrode followed by drying. The preparation condition was optimized by studying the cyclic voltammograms of 25 mM Pu(IV) in 1M H2SO4 at a scan rate of 20 mV s−1 recorded on each modified electrode (Fig. S1, ESI†). The redox peak currents of the Pu(IV)/Pu(III) couple increased by increasing the volume of the SWCNT suspension on the platinum electrode, but a maximum peak current was observed for 20 μL of SWCNT suspension. Some of the suspension dropped out from the electrode surface for suspension volumes higher than 20 μL. Therefore, the platinum electrode was modified with 20 μL of SWCNT suspension for all further experiments.
2.6. Prepartion of polyaniline (PANI) modified platinum electrode (PANI-Pt)
The PANI film was electrodeposited potentiodynamically on a platinum electrode from a 0.1 M aniline solution in 0.5 M H2SO4 at a scan rate of 100 mV s−1 by repeating the potential scan for 12 cycles between −0.2 V and 1.3 V as published elsewhere.16 However, the characteristic redox peaks of the Pu(IV)/Pu(III) couple were completely masked by the background signal of modified electrode. This was attributed to the strong interference of the electroactive degradation products viz.quinones and hydroquinones of the PANI film in the voltammogram. The signature of the Pu(IV)/Pu(III) redox reaction could not be recovered in spite of restricting the potential scan to three cycles. Therefore, a two step growth strategy was followed for depositing the PANI film on the platinum electrode from the 0.1 M aniline solution in 0.5 M H2SO4. In the first step, the potential of the platinum electrode was scanned between −0.2 V and 1.3 V at a scanning rate of 100 mV s−1 (Fig. S2, ESI†). This step was found to be sufficient to oxidize aniline monomers and produce some oligomers which could grow autocatalytically during the second step, where the switching potential was restricted up to 0.8 V for multiple cycles (Fig. S2, ESI†). This strategy reduced the fragmentation of PANI and hence the redox peaks of the Pu(IV)/Pu(III) couple appeared prominently on PANI-Pt. The number of potential cycles in the second step was also optimized for PANI-Pt by monitoring the redox peaks of the 25 mM Pu(IV)/Pu(III) couple in 1M H2SO4. The cathodic and anodic peak currents increased exponentially by increasing the number of potential cycles up to 100 (Fig. S3, ESI†) and the peak-to-peak potential separation (ΔEp) simultaneously reduced drastically. However, the fragmentation of the PANI matrix also increased when the number of the potential cycles was increased. This introduced two additional peaks of the electroactive fragments (most probably quinone and hydroquinone) in the vicinity of the redox peaks of the Pu(IV)/Pu(III) couple (Fig. S4, ESI†).16,18 The best results were obtained with eleven potential cycles in the second step of PANI deposition. Therefore, for all the subsequent studies, PANI-Pt was prepared from 0.1 M aniline solution in 0.5 M H2SO4 by scanning the potential of the platinum electrode between −0.2 V to 1.3 V and −0.2 V to 0.8 V for the first cycle and consecutive eleven cycles, respectively, at a scan rate of 100 mV s−1.3. Results and discussion
3.1. Electrochemistry of Pu(IV)/Pu(III) in 1 M H2SO4 on a platinum disk electrode
Fig. 1 shows the cyclic voltammogram of 25 mM Pu(IV) in 1M H2SO4 on a platinum electrode at the scan rate of 20 mV s−1. The cathodic peak (1) at 0.321 V and the anodic peak (1′) at 0.587 V correspond to the reduction of Pu(IV) to Pu(III) and vice versa, respectively. The peak-to-peak potential separation (ΔEp) of 266 mV was attributed to the quasi-reversible electron transfer reaction of the Pu(IV)/Pu(III) couple in 1 M H2SO4 on platinum electrode. The cyclic voltammograms of the same redox reaction were studied by varying the scan rate (ν) in the range of 10–500 mV s−1.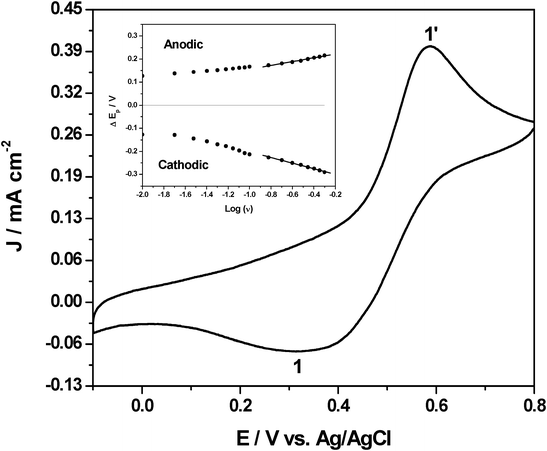 | ||
| Fig. 1 Cyclic voltammogram of 25 mM Pu(IV) in 1 M H2SO4 on platinum electrode at the scan rate of 20 mV s−1. Inset shows the variation of the cathodic and anodic peak potentials (ΔEp) with respect to E0′ as a function of scan rate. | ||
The redox species can interact with the electrode surface by either pure diffusion or pure adsorption or a mixed adsorption–diffusion controlled process. The dominating process can be diagnosed by observing the slope of the straight line of log│Ip│ versus log (ν) plot. Theoretically, slopes of 0.5 and 1 should be observed for pure diffusional and adsorbed species, respectively. However, a slope lying between 0.5 and 1 represents the mixed adsorption–diffusion controlled process, where the value indicates the level of contribution from the two components.19,20 In practical cases, the slope values lying between 0.20–0.60 and 0.75–1.10 are considered pure diffusion and pure adsorption controlled processes, respectively.21,22 The slope lying between 0.60–0.75 is considered a mixed adsorption–diffusion controlled process.21,22 The plots of log│Ip│ versus log (ν) for both the cathodic and anodic peaks yield straight lines of gradients 0.33 (R2 = 0.994) and 0.35 (R2 = 0.987), respectively. This clearly suggests that the electrochemical reaction of Pu(IV)/Pu(III) couple onto platinum electrode in 1 M H2SO4 solution is governed by the diffusion process.
It was also noted that the cathodic (Epc) and anodic (Epa) peak potentials shifted towards the more negative and positive directions, respectively, with increasing scan rate (Inset of Fig. 1). The ΔEp also increased with scan rate and showed linear dependence at higher scan rates (150–500 mV s−1). The linear part of the plot obeys the Laviron equation:23
 | (1) |
 | (2) |
where, E0′ = (Epa + Epc)/2 at very slow scan rate (5 mV s−1), α is the cathodic electron transfer coefficient, n is the number of electrons transferred, R is the molar gas costant (8.314 J mol−1K−1), F is the Faraday constant (96495 C mol−1), T is the temperature (298 K) and ks (cm s−1) is the apparent heterogeneous rate constant of electron transfer. Therefore, the slopes of the cathodic and anodic linear segments are −2.303RT/(αnF) and 2.303RT/{(1–α)nF}, respectively. The values of α and n calculated from the two slopes are ca. 0.39 and 1.18. The apparent heterogeneous rate constant (ks) of Pu(IV)/Pu(III) reduction was calculated as 1.06 × 10⁻¹ cm s−1. These suggest that the redox reaction of the Pu(IV)/Pu(III) couple in 1 M H2SO4 solution is a quasi-reversible one-electron transfer process.24 The diffusion coefficient of 25 mM Pu(IV) in 1 M H2SO4 solution was calculated as 3.4 × 10⁻⁸ cm2s−1 using the following equation:25
 | (3) |
In 1 M H2SO4, Pu(IV) predominantly exists as a quadra sulphate complex (QSC) ions [Pu(SO4)4(H2O)4]-4.4,26 Therefore the diffusion coefficient of heavier QSC ions (about 700 amu) is pretty small. The overall observations suggest that the diffusing QSC ions are reduced at the platinum electrode in 1M H2SO4 through quasi-reversible (α = 0.39) single electron transfer process. At this point, it is important to note that the Pu(IV)/Pu(III) couple is expected to exhibit reversible electron transfer process because it does not involve any plutonium–oxygen bond formation or cleavage reaction. However, the results are contrary to the expectations. A close look into the electrode–electrolyte interface will reveal a direct contact between the QSC ions in 1 M H2SO4 and the polycrystalline platinum electrode. A strong physisorption of water molecules occurred on platinum in the potential range 0.27–0.85 V vs.NHE due to the electrostatic interaction between the partially positively charged platinum surface and partially negatively charged oxygen atom of the water molecules.27 In higher potential range (0.85 V < E < 1.15 V vs.NHE), a half monolayer of chemisorbed oxygen builds up on the platinum surface. Platinum(II) oxide (PtO) is formed due to the mutual charge transfer between platinum to chemisorbed oxygen at potential greater than 1.15 V vs.NHE.27 Bi–sulphate ions (HSO4−) are mostly desorbed at the onset of the surface oxide formation and therefore do not influence the oxide growth on the platinum surface.28 On other hand, the formal potential of the Pu(IV)/Pu(III) couple in 1 M H2SO4 is ∼0.76 V vs.NHE. Therefore, Pu(IV) and Pt form a galvanic cell [Pt,PtO/Pu(IV),Pu(III)] where Pu(IV) is reduced to Pu(III) at the cost of oxidizing the surface platinum atoms to PtO at the interface of the QSC ions and the polycrystalline platinum.28 This oxide layer affects the thermodynamics of the electrochemical reaction, changes the electronic properties of the platinum surface, imposes a barrier to charge transfer reaction across the surface oxide film and blocks the active sites on the metal surface. Therefore, the electrochemical reaction of the Pu(IV)/Pu(III) couple on a platinum electrode in 1 M sulphuric acid solutions exhibits a quasi-reversible electron transfer process.
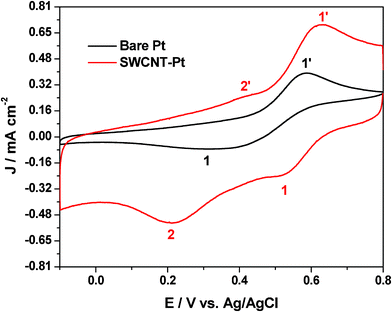 | ||
| Fig. 2 Cyclic voltammogram of 25 mM Pu(IV) in 1 M H2SO4 solution on Pt and SWCNT-Pt electrodes at the scan rate of 20 mV s−1. | ||
The enhancement of the redox peak current along with the significant enhancement in the electrochemical reversibility suggests electrocatalytic action of the SWCNT-Pt for the Pu(IV)/Pu(III) redox reaction. Fig. 3 shows a comparison of (A) cathodic and (B) anodic peak currents of the Pu(IV)/Pu(III) redox reaction between Pt and SWCNT-Pt electrodes in the scan rate range of 10–100 mV s−1. The catalytic action of the modified electrode was quantified with the parameter named as catalytic efficiency (γ) which was defined as:
 | (4) |
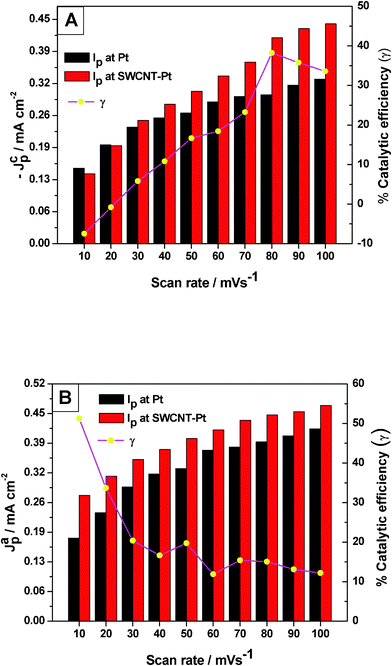 | ||
| Fig. 3 The (A) cathodic and (B) anodic peak currents of the Pu(IV)/Pu(III) redox reaction on Pt and SWCNT-Pt electrodes in the scan rate range of 10–100 mV s−1. The % catalytic efficiency of the modified electrode as a function of scan rate is shown in the respective plots. | ||
where, IpM and IpPt are the peak currents at the modified electrode and at the bare Pt, respectively. It can be observed from Fig. 3 that the catalytic efficiency of SWCNT-Pt for the cathodic reaction increased with the increasing scan rate, whereas the reverse phenomenon was observed for the anodic reaction. This could be due to the electrostatic interaction between the functionalized SWCNT and plutonium ionic species in the electrolyte medium. The pKa of the carboxylic acid functionalized SWCNTs is ∼4.5, as determined by the force titration method.31,32 Thus the carboxylic group will be protonated in 2 M [H+] and an additional proton may be attached with the electronegative oxygen atom of the carbonyl group (such as (HO)(C)C![[double bond, length as m-dash]](https://www.rsc.org/images/entities/char_e001.gif) Oδ−⋯H+) resulting in a positively polarized SWCNT surface.33 On the other hand, Pu(IV) forms an anionic QSC complex in 1 M H2SO4. However, no anionic complex of Pu(III) is known to exist below 16 M H2SO4.34 The slopes of log│Ip│ versus log (ν) plots for both the cathodic and the anodic peaks were observed as 0.50 (R2 = 0.991) and 0.23 (R2 = 0.989), respectively, in the scan rate range of 10–200 mV s−1. This clearly indicates that the electrochemical reaction of the Pu(IV)/Pu(III) couple in 1 M H2SO4 onto SWCNT-Pt is also governed by the diffusion controlled process.
Oδ−⋯H+) resulting in a positively polarized SWCNT surface.33 On the other hand, Pu(IV) forms an anionic QSC complex in 1 M H2SO4. However, no anionic complex of Pu(III) is known to exist below 16 M H2SO4.34 The slopes of log│Ip│ versus log (ν) plots for both the cathodic and the anodic peaks were observed as 0.50 (R2 = 0.991) and 0.23 (R2 = 0.989), respectively, in the scan rate range of 10–200 mV s−1. This clearly indicates that the electrochemical reaction of the Pu(IV)/Pu(III) couple in 1 M H2SO4 onto SWCNT-Pt is also governed by the diffusion controlled process.
Fig. 4 shows the SEM image of SWCNT-Pt. It shows a rougher surface of SWCNT-Pt compared to Pt. Thus it may appear that this rougher SWCNT-Pt surface played a major role in the calculated current efficiency values. In reality, the roughness of SWCNT-Pt is caused by the presence of two components viz. the SWCNTs (conductive) and nafion (insulating) matrix. Thus, the catalytic efficiency in current mainly originated from the conductive area provided by the SWCNTs. Here, nafion was used only as dispersing medium for the SWCNTs.
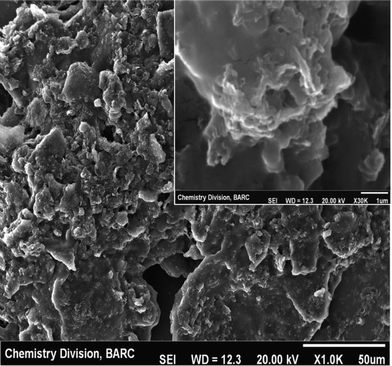 | ||
| Fig. 4 SEM image of SWCNT-Pt. Inset shows the higher magnification image. | ||
The charge transfer coefficient (α) and the heterogeneous rate constant (ks) of Pu(IV) reduction on SWCNT-Pt in 1 M H2SO4 were calculated as 0.63 and 4.75 × 10⁻¹ cm s−1, respectively. This suggests that the modification of platinum surface with SWCNT catalyzed the Pu(IV)/Pu(III) redox reaction. We can look into the SEM image of SWCNT-Pt as shown in Fig. 4 to understand the role of surface modification on the electrochemical behaviour of Pu(IV)/Pu(III) couple. The platinum surface almost gets covered by the SWCNTs dispersed in the nafion matrix. Hence the direct contact between the electrolyte solution and the platinum surface is restricted and as a result, the spontaneous galvanic reaction between platinum and Pu(IV) is sufficiently suppressed. Therefore the quasi-reversible redox reaction of the Pu(IV)/Pu(III) couple on Pt transformed to a more reversible redox reaction on SWCNT-Pt.
The cyclic voltammograms of 25 mM Pu(IV) in 1 M H2SO4 solution on (a) functionalized and (b) non-functionalized SWCNT-Pt electrodes at the scan rate of 20 mV s−1 are shown in Fig. S7, ESI†. The reduction peak of Pu(IV) became more prominent on the functionalized SWCNT-Pt, but the functionalization also introduced a higher capacitive current in the voltammogram. But for these, no significant difference was observed between the two voltammograms obtained on the functionalized and non-functionalized SWCNT-Pt.
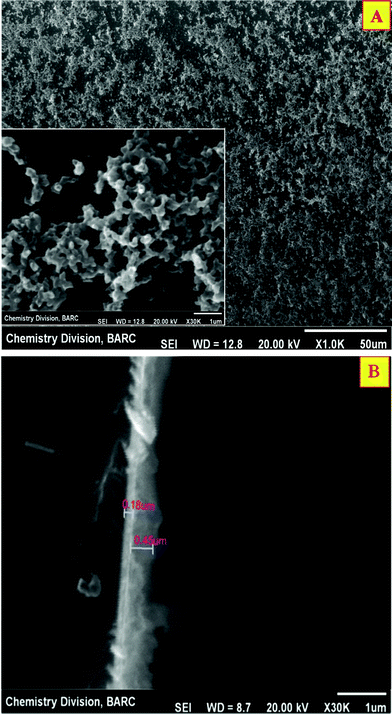 | ||
| Fig. 5 SEM images of the (A) top (inset shows the higher magnification image) and (B) cross-sectional views of PANI/Pt. | ||
The cyclic voltammogram of 25 mM Pu(IV) in 1 M H2SO4 solution on PANI-Pt electrode at the scan rate of 20 mV s−1 is shown in Fig. 6. The cyclic voltammogram of Pu(IV) recorded on Pt (which is already presented in Fig.1) was overlaid in the same scale in Fig. 6 for comparison. The cathodic peak (1) at 0.460 V and the anodic peak (1′) at 0.540 V observed on PANI-Pt corresponds to the reduction of Pu(IV) to Pu(III) and vice versa, respectively. The peak-to-peak potential separation (ΔEp) is 80 mV, which is the lowest among the ΔEp values observed on bare Pt (266 mV) and on SWCNT-Pt (108 mV). This confirms that the redox reaction of Pu(IV)/Pu(III) couple became more reversible on PANI-Pt compared to SWCNT-Pt and bare Pt. One pair of additional peaks (3/3′) at 0.032 V and 0.197 V, respectively, appeared in the voltammogram because of the redox transition between the fully reduced leucoemeraldine base (LB) and emeraldine salt (ES) forms of the PANI.
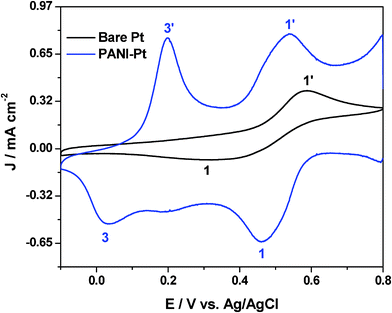 | ||
| Fig. 6 Cyclic voltammogram of 25 mM Pu(IV) in 1 M H2SO4 solution on Pt and PANI-Pt electrodes at the scan rate of 20 mV s−1. | ||
Fig. 7 shows the cyclic voltammogram of the Pu(IV)/Pu(III) redox reaction at different scan rates (ν) in the range of 20–500 mV s−1. The shape of the cyclic voltammograms changed progressively with increasing the scan rate. The cathodic and anodic peaks of ES/LB couple of PANI shifted towards the more positive potentials with increasing scan rate. This suggests that the insulating fraction of the PANI matrix increased progressively with the increasing scan rate. On the other hand, the cathodic peak of Pu(IV)/Pu(III) couple continuously shifted towards more negative potential with increasing scan rate, but the anodic peak initially shifted towards more positive potential until it reached a scan rate of 40 mV s−1 and afterwards, it started shifting towards the cathodic direction. Finally, the anodic peaks of the Pu(IV)/Pu(III) and ES/LB couples got merged at scan rates higher than 300 mV s−1.
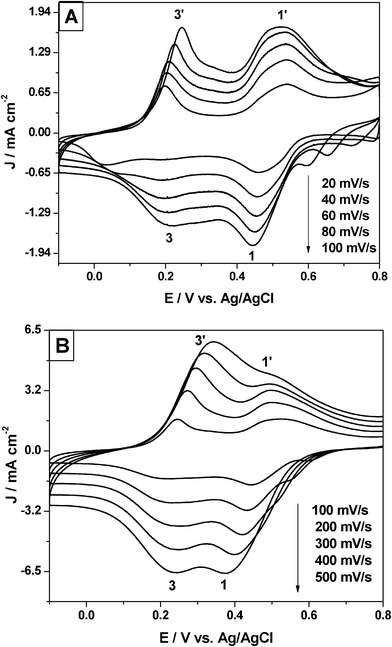 | ||
| Fig. 7 Cyclic voltammogram of 25 mM Pu(IV) in 1 M H2SO4 solution on PANI-Pt electrodes. Scan rate range: (A) 20–100 mV s−1 and (B) 100–500 mV s−1. | ||
Fig. 8 shows a comparison of (A) cathodic and (B) anodic peak currents of the Pu(IV)/Pu(III) redox reaction between Pt and PANI-Pt electrodes in the scan rate range of 10–100 mV s−1. The catalytic efficiency (γ) of the cathodic reaction increased from ∼150% at 10 mV s−1 to ∼528% at 100 mV s−1. However, the catalytic efficiency of the anodic reaction remained almost constant between ∼100% and 145% with increasing scan rates in the range of 10–100 mV s−1. The decrease of the ratio ipa/ipc with increasing scan rates (Fig. 8C) and the increase of the cathodic current function (–ipc/ν0.5) when increasing the square root of the scan rates (in V s−1) (Fig. 8D) suggests that the redox reaction of Pu(IV)/Pu(III) on PANI-Pt follows an Electrochemical–Chemical (EC) mechanism which consists of an electron transfer reaction followed by a chemical reaction. The slopes of log│Ip│¦ versus log (ν) plots for both the cathodic and the anodic peaks were observed as 0.69 (R2 = 0.986) and 0.43 (R2 = 0.990), respectively, in the scan rate range of 10–200 mV s−1 This clearly illustrates that the cathodic reaction of the Pu(IV)/Pu(III) couple in 1 M H2SO4 onto PANI-Pt is governed by a mixed adsorption–diffusion controlled process. However, the reverse reaction (i.e., the oxidation of Pu(III)) is still governed by the diffusion controlled process. The charge transfer coefficient (α) and the heterogeneous rate constant (ks) of Pu(IV) reduction in 1 M H2SO4 on PANI-Pt were calculated as 0.77 and 9.70 × 10⁻¹ cm s−1, respectively.
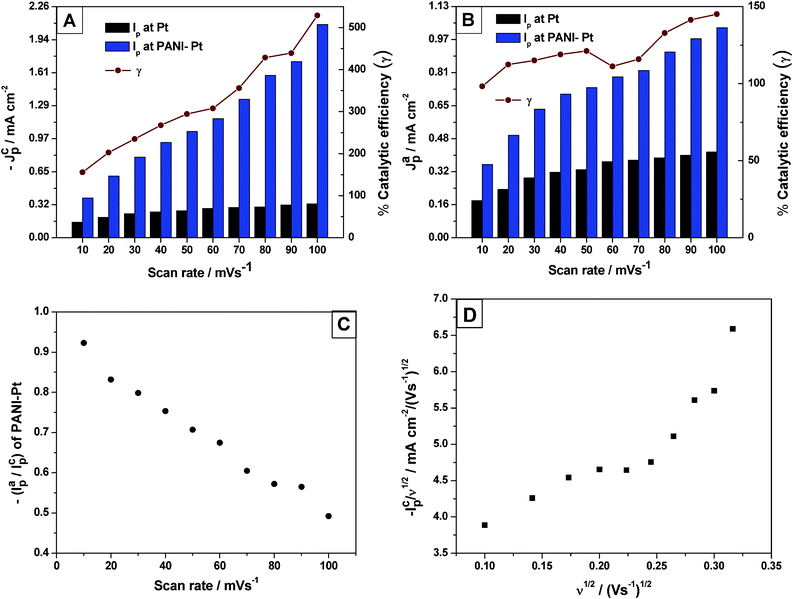 | ||
| Fig. 8 The (A) cathodic and (B) anodic peak currents of the Pu(IV)/Pu(III) redox reaction on Pt and PANI-Pt electrodes in the scan rate range of 10–100 mV s−1. The % catalytic efficiency of the modified electrode as a function of the scan rate is shown in the respective plots; (C) ipa/ipc of the Pu(IV)/Pu(III) couple on PANI-Pt as a function of the scan rates in the range of 10–100 mV s−1; (D) The plot of cathodic current function (–ipc/ν0.5) with respect to the square root of the scan rates (in V s−1) in the range of 10–100 mV s−1. | ||
The results cumulatively illustrate the electrocatalysis of the Pu(IV)/Pu(III) redox reaction on PANI-Pt. The anionic QSC complex is attracted by the positively charged PANI matrix16 (as ∼50% of ES is protonated at the nitrogen centres in 1 M H2SO4) and finally gets adsorbed at the Lewis basic nitrogen centres. Hence the transition state energy level is reorganized and finally the electron transfer coefficient is increased. Therefore, the reversibility of the Pu(IV)/Pu(III) redox reaction is significantly increased on PANI-Pt. However, this adsorption was completely absent during the oxidation of Pu(III) due to the lack of Donnan interaction between PANI and the Pu(III)-species.
The cyclic voltammogram shown in Fig. 6 reveals that ES has stronger oxidizing ability than Pu(IV) in 1 M H2SO4. Therefore, at the beginning of the potential scan (0.8 V ≤ E ≤ ∼0.65 V), QSC is adsorbed at the interface and then PANI (ES) only serves as an ordinary conducting polymer. At ∼0.65 V, reduction of Pu(IV) to Pu(III) sets in by obeying the Nernst equation. As soon as Pu(III) appears at the PANI(ES)-electrolyte, a chemical reaction between Pu(III) and PANI(ES) is coupled with the electron transfer reaction. This chemical reaction regenerates Pu(IV) at the PANI-electrolyte interface. Therefore, the cathodic peak current was higher than the anodic peak current (notably, the cathodic peak current of the Pu(IV)/Pu(III) redox reaction in 1 M H2SO4 on a bare platinum electrode was observed as smaller than the anodic peak current). Here PANI acts as an electron mediator in the catalysis of Pu(IV)/Pu(III) redox reaction on PANI-Pt as shown in the following equations :
| Pu(IV) = Pu(III) + e− | (5) |
| Pu(III) + PANI(ES) = Pu(IV) + PANI(LB) | (6) |
It is well known that the flux of the analyte ions increases with the increasing scan rate. Hence the cathodic peak current of the Pu(IV)/Pu(III) redox reaction increased with the increasing scan rate because of the catalytic regeneration of Pu(IV) at the electrode–electrolyte interface by the coupled chemical reaction. However, the coupled chemical reaction increases the fully reduced LB form (which is insulating in nature) in the PANI matrix. This induces the redox peaks of ES/LB couple to shift towards more positive potentials with the increasing scan rates.
The electrocatalytic action of PANI-Pt on the Pu(IV)/Pu(III) redox reaction is promising for electroanalytical applications. However, the stability of the PANI-Pt electrode in Pu(IV) solution was poor for a prolonged electrochemical application. Fig. S8, ESI,† shows the cyclic voltammograms of Pu(IV)/Pu(III) in 1 M H2SO4 on PANI-Pt for a number of continuous potential scans at a rate of 20 mV s−1. The peaks of the Pu(IV)/Pu(III) redox couple were completely deformed after ∼50 cycle. This was attributed to radiation damage of the soft organic PANI-matrix during prolonged exposure to the radioactive solution. Further studies are necessary to meet this goal. The shelf life was not studied because fresh modification is recommended prior to each analysis.
 | (7) |
![(A) Nyquist plots of Pt, SWCNT-Pt and PANI-Pt electrodes in 25 mM K3[Fe(CN)6]/K4[Fe(CN)6] + 0.1 M KCl at the open circuit potential (OCP) with an amplitude of 5 mV in the frequency range 106 Hz–10−2 Hz. Inset shows the zoomed image of the same in the higher frequency region. (B) The best fitted EEC of the impedance spectra.](/image/article/2012/RA/c1ra01010g/c1ra01010g-f9.gif) | ||
| Fig. 9 (A) Nyquist plots of Pt, SWCNT-Pt and PANI-Pt electrodes in 25 mM K3[Fe(CN)6]/K4[Fe(CN)6] + 0.1 M KCl at the open circuit potential (OCP) with an amplitude of 5 mV in the frequency range 106 Hz–10−2 Hz. Inset shows the zoomed image of the same in the higher frequency region. (B) The best fitted EEC of the impedance spectra. | ||
where, Y0 is the CPE constant, ω is the angular frequency in radians/s, j ( = √−1) is an imaginary number and ϕ is the CPE exponent. Depending on the value of ϕ (0 ≤ ϕ ≤1), the CPE is considered to be a pure resistor (ϕ = 0) or a pure capacitor (ϕ = 1) or Warburg impedance (ϕ = 0.5). The values of the fitted parameters for the three electrodes are presented in Table 1. It can be seen that the charge transfer resistance (Rct) of PANI-Pt is 9.5 Ω, which is much smaller than those of the SWCNT-Pt (21.4 Ω) and bare platinum electrode (24.1 Ω). The charge transfer resistance of an electrode is inversely proportional to the rate of electron transfer across the electrode–electrolyte interface. The impedance data i.e. RCtPANI-Pt ≤ RCtSWCNT-Pt ≤ RCtPt support the trend of the heterogeneous rate constants calculated from the cyclic voltammetry experiments i.e. ksPANI-Pt ≥ ksSWCNT-Pt ≥ ksPt. This is the signature of the best electrocatalytic behavior of PANI-Pt among the three electrode surfaces for the Pu(IV)/Pu(III) redox reaction.
4. Conclusion
In this paper, the modified platinum electrodesviz. SWCNT-Pt and PANI-Pt were prepared by optimized procedures and showed good electrocatalytic properties for the Pu(IV)/Pu(III) redox reaction in 1 M H2SO4. The electrocatalysis of Pu(IV)/Pu(III) couple on SWCNT-Pt is driven by the increase in the rate constant of the electron transfer reaction at the SWCNT-Pt electrode compared to the bare platinum electrode. PANI-Pt showed the best electrocatalytical performance among the three electrodesviz.PANI-Pt, SWCNT-Pt and bare Pt because of the cumulative effect of the Donnan interaction between PANI and Pu(IV)-QSC, specific adsorption of the analyte on the electron transfer centre, higher electron transfer rate constant and catalytic chemical reaction coupled with the electron transfer reaction. This report not only provides a new opportunity to improve the quality of Pu analysis and shorten the analytical time for the electroanalysis of actinides and other elements; but also reveals the chemistry of plutonium with the modifiers (such as PANI and SWCNTs) and its impact on the analytical response of the plutonium.Acknowledgements
The authors wish to thank Mr. Jitendra Nuwad and Dr. C. G. S. Pillai of Chemistry Division, BARC, for carrying out the SEM experiments. The authors acknowledge Ms. Sangita D. Lenka, Fuel Chemistry Division, BARC, for performing the EDXRF experiment. Ms. Ruma Gupta thanks Dr. (Smt.) J.V. Kamat for her valuable guidance and alertness during the handling of radioactive substance. Authors wish to thank Dr. Shilpa Sawant, Chemistry Division, BARC, for providing Autolab20 instrument for the EIS experiment. Authors acknowledge Dr. H.S. Sharma, Ex-employee, BARC, for valuable discussions during the initial stages of planning of the work.References
- B. G. Harvey, H. G. Heal, A. G. Maddock and E. L. Rowley, J. Chem. Soc.II, 1947, 1010–1021 CAS.
- H. S. Sharma, N. B. Khedekar, S. G. Marathe and H. C. Jain, Nucl. Technol., 1990, 89, 399–405 CAS.
- I. S. Sklyaranko, V. M. Mikhailov and T. M. Chubukova, J. Anal. chem., 1972, 10, 1991–2003 Search PubMed.
- H. S. Sharma, V. Jisha, D. M. Naronha, M .K. Sharma and S. K. Aggarwal, Report No. E/012, Bhabha Atomic Research Centre, 2007 Search PubMed.
- G. C. Goode, J. Herrington and G. Hall, Anal. Chim. Acta, 1964, 30, 109–113 CrossRef CAS.
- R. M. Peekema and F. A. Scott, AEC research and development report, 1958, HW-, p. 58491 Search PubMed.
- W. D. Shults, AEC research and development report, 1960, p. ORNL-2921 Search PubMed.
- G. Phillips and G. W. C. Milner, SAC Conference, 1965, 240–253 CAS.
- M. K. Holland and J. V. Cordaro, J. Radioanal. Nucl. Chem., 2009, 282, 555–563 CrossRef CAS.
- W. N. Carson, J. W. Vanderwater and H. S. Gile, Anal. Chem., 1957, 29, 1417–1422 CrossRef CAS.
- W. D. Shults, Talanta, 1963, 10, 833–849 CrossRef.
- J. W. A. Tushigham, IAEA Symposium on International Safeguards, IAEA-SM-351 168, 13-17 October, 1997, Vienna, Austria Search PubMed.
- F. Kodera, Y. Kuwahara, A. Nakazawa and M. Umeda, J. Power Sources, 2007, 172, 698–703 CrossRef CAS.
- D. C. Johnson and S. Bruckenstein, Anal. Chem., 1971, 43, 1313–1316 CrossRef CAS.
- M. W. Breiter, J. Electroanal. Chem., 1964, 8, 230–236 CrossRef CAS.
- S. K. Guin, R. Chandra and S. K. Aggarwal, Electrochim. Acta, 2010, 55, 8402–8409 CrossRef CAS.
- K. D. Singh Mudher and K. Krishnan, J. Alloys Compd., 2000, 313, 65–68 CrossRef.
- G. A. Planes, J. L. Rodriguez, M. C. Miras, G. Garcia, E. Pastor and C. A. Barbreo, Phys. Chem. Chem. Phys., 2010, 12, 10584–10593 RSC.
- C. Batchelor-McAuley, L. M. Goncalves, L. Xiong, A. A. Barros and R. G. Compton, Chem. Commun., 2010, 46, 9037–9039 RSC.
- E. Laviron, J. Electroanal. Chem., 1980, 112, 11–23 CrossRef CAS.
- G. Gopu, P. Manisankar, B. Muralidharan and C. Vedhi, Int. J. Electrochem., 2011 DOI:10.4061/2011/269452.
- F. S. M. Hassan, M. A. Ghandour, A. E. Mohamed and A. F. Al-Hossainy, Arabian J. Chem., 2008, 1, 67–78 CAS.
- E. Laviron, J. Electroanal. Chem., 1979, 101, 19–28 CrossRef CAS.
- D. K. Gosser, Jr., Cyclic Voltammetry: Simulation and Analysis of Reaction Mechanisms; 1993, Wiley-VCH, Inc.: New York Search PubMed.
- A. J. Bard and L. R. Faulkner, Electrochemical methods: fundamentals and applications, 2006, Wiley-India Ed. Search PubMed.
- L. V. Lipis, B. G. Pozharskii and V. V. Fomin, Zhurnal Strukturnoi Khimii, 1959, 1, 417–424 Search PubMed.
- G. Jerkiewicz, G. Vatankhah, J. Lessard, M. P. Soriaga and Y. Park, Electrochim Acta, 2004, 49, 1451–1459 CAS.
- D. G. Peters and W. D. Shults, J. Electroanal. Chem., 1964, 8, 200–229 CrossRef CAS.
- M. Pumera and H. Iwai, Chem.–Asian J., 2009, 4, 554–560 CrossRef CAS.
- M. Pumera and H. Iwai, J. Phys. Chem. C, 2009, 113, 4401–4405 CAS.
- D. V. Vezenov, A. Noy, L. F. Rozsnyai and C. M. Lieber, J. Am. Chem. Soc., 1997, 119, 2006–1015 CrossRef.
- S. S. Wong, E. Joselevvich, A. T. Woolley, C. L. Cheung and C. M. Lieber, Nature, 1998, 394, 52–55 CrossRef CAS.
- R. Stewart and K. Vates, J. Am. Chem. Soc., 1960, 82, 4059–4061 CrossRef CAS.
- O. J. Wick, Plutonium Handbook : A Guide to the Technology, Vol. 1, Gordon and Breach, Science Publishers, 1967, London Search PubMed.
Footnote |
| † Electronic supplementary information (ESI) available: It consists of the figures of the optimization experiments for the modified electrodes; characterization of SWCNTs and the stability of PANI-Pt in Pu(IV) solution. See DOI: 10.1039/c1ra01010g |
| This journal is © The Royal Society of Chemistry 2012 |
