Fabrication of CuInS2–TiO2 composite fibers by using electrospinning coupled with solvothermal method
Huimin
Cao
,
Yihua
Zhu
*,
Xiaoling
Yang
and
Chunzhong
Li
Key Laboratory for Ultrafine Materials of Ministry of Education, School of Materials Science and Engineering, East China University of Science and Technology, Shanghai, 200237, China. E-mail: yhzhu@ecust.edu.cn; Fax: +86 21 6425 0624; Tel: +86 21 6425 2022
First published on 2nd March 2012
Abstract
The electrospinning method combined with a solvothermal technique is employed to prepare TiO2 fibers wrapped with zincblende CuInS2. The as prepared composite fibers showed a great absorption in the whole visible region, and the photocurrent responses of the composite fibers under visible light illumination were greatly enhanced.
Due to its favorable band-edge positions, strong optical absorption, superior chemical stability, photocorrosion resistance and low cost, TiO2 exerts a peculiar fascination on many researchers who are engaged in photovoltaic, photocatalyst and fuel cell research.1 The one-dimensional nanostructure of TiO2 has distinct electronic, optical and chemical properties, which lead to the improvement of strategies to optimize the photocatalytic activity.2 1D coaxial hetero-nanostructures, with adjustable compositions and interfaces, could yield a significantly improved performance due to the interactions that occur between the different chemical species in the core and shell.3 Xia's group prepared rutile TiO2 fibers with V2O5 nanorods grown on the surface via electrospinning and calcination.4 ZnO–TiO2 hierarchical structures, which process a great potential for applications in photovoltaic devices, were synthesized by the combination of electrospinning and a hydrothermal method.5 However, the utilization of solar energy by TiO2 is substantially limited by its large band gap energy and fast electron–hole recombination due to a high density of trap states.6 An enormous amount of research has been focused on enhancing the absorption of band gap metal oxides. For instance, sensitization with small band gap semiconductors is a versatile approach which has been shown to improve the conversion efficiency of metal oxide photoelectrodes by modifying their optical absorption coefficient and wavelength.7 The electrospinning method coupled with a chemical reaction has been applied to fabricate a TiO2–CdS composite fiber, which absorbs both in the UV and visible regions.8 Tremendous improvements in the efficiency of photoelectrochemical solar cells can also be obtained via incorporating inorganic semiconductor quantum dots (QDs), such as CdSe and CdS, into the TiO2 nanotube array.9 However, the intrinsic toxicity of elemental Cd is an apparent environmental concern, thus less expensive nontoxic materials are required.10
CuInS2 (CIS) compounds, containing neither Class A nor Class B elements, are effective light-absorbing materials in thin-film solar cells. CIS and some other I–III–VI bulk crystals are direct band gap semiconductors, with a band gap of 1.45 eV for CIS, which have advantageous properties for solar applications.11 CIS nanoparticles can be wrapped uniformly throughout the inner and outer walls of a TiO2-nanotube by using the square wave pulsed-electrodeposition approach.12 Cu–In–S nanocrystals were mainly limited to the chalcopyrite structure, until Yang's group reported CIS nanocrystals with the zincblende structure synthesized by a hot injection method.13 Then, zincblende CIS QDs with a size of 2–4 nm were prepared by a solvothermal strategy, which is more convenient.14
Electrospinning is a straightforward, cost-effective method to produce novel fibers with large continuous surface areas, which are good substrate materials for the further growth of nanoparticles as secondary structures.15 Herein, we present a two-step route to prepare CIS–TiO2 composite fibers by a combination of electrospinning and a solvothermal method. First, electrospinning was employed to fabricate TiO2 fibers, which served as the core structure for the growth of secondary CIS structures. The fabrication of TiO2 fibers was based on a previously reported method, with some modification.16 Then, CuCl2 (0.05 mmol) and InCl3·4H2O (0.05 mmol) were dissolved in 17 mL ethanol under stirring for 5 min at room temperature, resulting in a blue solution. 4-Bromothiophenol (0.6 mmol) was added into the blue solution and stirred for 10 min, leading to the formation of a yellow solution. Na2S·9H2O (0.2 mmol) in 7 mL ethanol and as prepared TiO2 fibers were added to the solution and stirred for another 10 min, when the mixture turned into a brown-coloured suspension. Finally, the brown solution was transferred into a Teflon-lined stainless steel autoclave and maintained at 200 °C for 16 h. After the autoclave cooled to room temperature naturally, the product was collected by centrifugation, washed several times with absolute ethanol and dried at 60 °C overnight, then we obtained CIS–TiO2 60% mass ratio (CIS![[thin space (1/6-em)]](https://www.rsc.org/images/entities/char_2009.gif) :TiO2 = 0.6:1.0).14 The concentration of added TiO2 fibers can be varied, thus CIS–TiO2 30% mass ratio (CIS:TiO2 = 0.3:1.0) and CIS–TiO2 120% mass ratio (CIS:TiO2 = 1.2:1.0) can be prepared.
:TiO2 = 0.6:1.0).14 The concentration of added TiO2 fibers can be varied, thus CIS–TiO2 30% mass ratio (CIS:TiO2 = 0.3:1.0) and CIS–TiO2 120% mass ratio (CIS:TiO2 = 1.2:1.0) can be prepared.
X-Ray diffraction (XRD) was used to identify the crystalline phase of the CIS–TiO2 composite fibers with different CIS:TiO2 mass ratios. As shown in Fig. 1, the XRD results of CIS are in agreement with the literature, which confirms the formation of the zincblende crystal structure.13 The XRD patterns of the CIS–TiO2 composites show that the peaks at 2θ values of 25.36, 37.9, 48.32, 55.44 and 62.8° correspond to the anatase phase of TiO2 (JCPDS 21–1272), whereas the peaks at 2θ values of 27.92, 31.92, 46.38, 47.88, 53.94, 55.14, and 58.24° correspond to the zincblende phase of CIS. It is obvious that increasing the CIS:TiO2 mass ratio results in CIS–TiO2 composites fibers with similar diffraction patterns, and an increasing intensity of CIS diffraction peaks. The peak at the 2θ value of 25.36° for CIS–TiO2 120% is sharper than the other two, which indicates the formation of bigger CIS particles at higher concentrations of CIS precursors.17 The peak at the 2θ value of 34.12° should ascribe to the by-product, InS structure (JCPDS 36–0643). Since InS is a semiconductor, which can also serve as a photocatalyst or buffer layer for CIS solar cells, it won't have a negative effect on the performance of the composite fibers.18
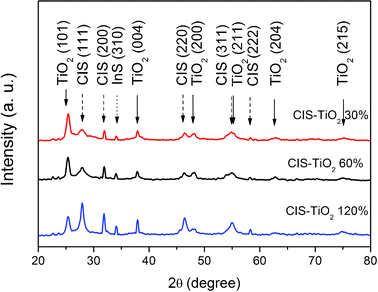 | ||
| Fig. 1 XRD patterns of the CIS–TiO2 composite fibers. | ||
Electrochemical impedance spectroscopy (EIS), a powerful tool, was employed to investigate the electron transfer properties at the surface of the electrode. The Nyquist plot of impedance spectra includes a semicircle portion at higher frequencies, which corresponds to the electron limited process, and a linear portion at lower frequencies, which corresponds to the diffusion process.19 The electron transfer resistance (RCT) is equal to the diameter of the semicircle, which controls the electron-transfer kinetics of the redox probe at the electrode interface. In order to prepare the electrode for EIS measurements, the CIS–TiO2 composite fibers were dispersed in ethanol by sonication for 15 min to achieve a uniform suspension. Then 50 μL of the mixture was dropped onto the surface of a glass–carbon electrode. The electrode was dried under ambient conditions. Fig. 2 indicates that after being wrapped with CIS, the RCT of CIS–TiO2 composite fibers decreased sharply compared with the RCT of pure TiO2 fibers. This improved interface conductivity should be attributed to the addition of CIS nanoparticles, hence the electron transfer can be promoted by the formation of two semiconductor systems.20 As shown in Fig. 2, the RCT of CIS–TiO2 fibers decreased when the mass ratio of CIS:TiO2 increased from 30% to 60%. However, the RCT increased markedly after the mass ratio increased to 120%. This phenomenon should be ascribed to the formation of bigger CIS particles and also the increased CIS particle density when the concentration of the CIS precursor is too high.
![Nyquist plots of EIS for CIS–TiO2 composite fibers and pure TiO2 fibers in 5.0 mM [Fe(CN)6]3-/4- with 0.1 M KCl at 0.2 V.](/image/article/2012/RA/c2ra00003b/c2ra00003b-f2.gif) | ||
| Fig. 2 Nyquist plots of EIS for CIS–TiO2 composite fibers and pure TiO2 fibers in 5.0 mM [Fe(CN)6]3-/4- with 0.1 M KCl at 0.2 V. | ||
The origin of the photocurrent generation was probed by recording the photocurrent responses of several on–off cycles under visible light illumination (λ > 400 nm). Fig. 3 shows the current response obtained from a voltammetric cell, containing a CIS–TiO2 composite fiber modified indium tin oxide (ITO) electrode serving as a working electrode, whereas Ag–AgCl (3 M KCl) and platinum wire served as the reference and counter electrode, respectively. It is interesting to note that the CIS–TiO2 60% composite fibers exhibited the highest photocurrent generation of 4 μA cm−2, which is much larger than CIS–TiO2 30% (0.107 μA cm−2) and CIS–TiO2 120% (0.143 μA cm−2) composite fibers. This means that the photoelectrochemical performances of CIS–TiO2 composite fibers relate to both the size and also the concentration of CIS particles. Fig. 4 depicts the Diffuse Reflectance Ultraviolet and Visible (DRUV-Vis) spectra of CIS–TiO2 composite fibers and pure TiO2 fibers. As we can see, the introduction of CIS greatly enhanced the absorption of the composite fibers in the whole visible region, thus improving the photocurrent responses under visible light illumination.
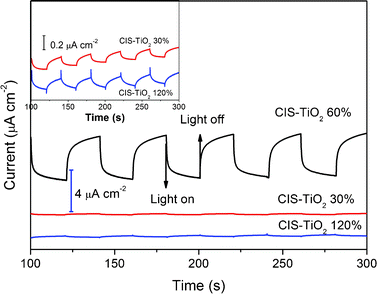 | ||
| Fig. 3 Photocurrent responses of CIS–TiO2/ITO electrodes under visible light irradiation (λ > 400 nm) in 0.1 M Na2S and 0.02 M Na2SO3 aqueous solutions at a bias potential of 0.2 V. | ||
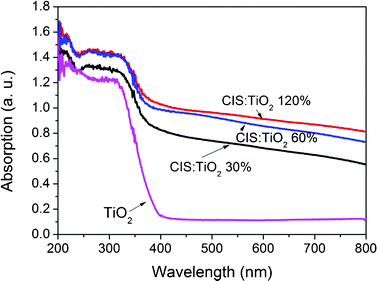 | ||
| Fig. 4 DRUV-Vis spectra of CIS–TiO2 composite fibers and pure TiO2 fibers. | ||
Fig. 5 illustrates the photoinduced electron transfer from CIS particles to TiO2 fibers, and the energy level diagram. Hupp and Gaal’s work presented that as the driving force increases, the rate of electron transfer (ET, “normal region kinetics”) increases, reaching a maximum when the driving force equals the reorganization energy.21 In the present experiments, the driving force for the electron transfer between CIS and TiO2 is dictated by the energy difference between the conduction band energies. Since the conduction band of TiO2 is at −0.5 V (band gap ≈ 3.2 eV) versus a normal hydrogen electrode (NHE) which is much lower than the conduction band of CIS (band gap ≈ 1.7 eV), it can accept photogenerated electrons successfully.22 1D structures allow the lateral confinement of electrons and guide the movement of electrons in the axial direction.3 Thus the as prepared CIS–TiO2 composite fibers show good photoelectrochemical properties.
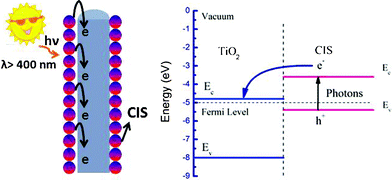 | ||
| Fig. 5 The photoinduced electron transfer process from CIS particles to TiO2 fibers. | ||
Fig. 6 shows the transmission electron microscopy (TEM) images of samples obtained with different concentrations of the CIS precursor. As shown in Fig. 6a, pure TiO2 fibers have a smooth surface, whereas in Fig. 6b–d, there are small CIS particles growing on the surface of the TiO2 fibers. The density of the CIS particles on the surface of the fibers increases with the increasing weight ratio of CIS:TiO2. Together with the results of EIS, photo-current response and UV-Vis absorption, CIS–TiO2 60% should be the ideal system, and was chosen for detailed analysis. The hybrid structures of the resulting CIS–TiO2 60% composite fibers were characterized by field emission scanning electron microscopy (FESEM) and high resolution TEM. Fig. 6e depicts the HR-TEM images of a single CIS–TiO2 60% composite fiber. It clearly shows the comprehensive coverage of CIS particles on the surface of the TiO2 fiber, in accordance with the SEM image (Fig. 6f). The enlarged image of the selected area A indicates a well-defined crystallinity displaying (101) and (011) planes of TiO2 with an interfacial angle of 82.4°, which is quite consistent with the literature.23 The enlarged image of selected area B shows the crystalline CIS with a lattice spacing of 0.32 nm, which corresponds to the (111) planes of a zincblende structure. The FESEM image in Fig. 6f shows representative morphology of the CIS–TiO2 60% composites, of which the average diameter is approximately 180 nm. The growth of the CIS particles on the fibers increases the surface roughness of composite fibers. However, there are some aggregate structures composed of small CIS particles, due to the inefficient adsorption of the Na2S precursor onto the surfaces of the pure TiO2 fibers.
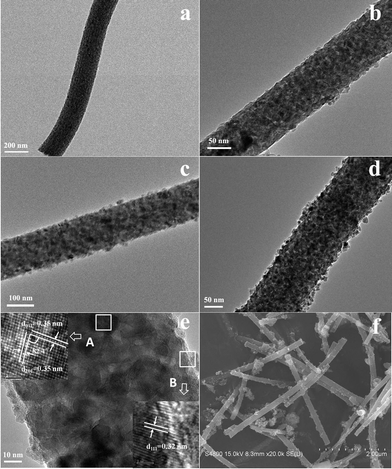 | ||
| Fig. 6 TEM images of pure TiO2 fibers (a), CIS–TiO2 30% composite fibers (b), CIS–TiO2 60% composite fibers (c) and CIS–TiO2 120% composite fibers (d); HR-TEM (e) and SEM (f) images of CIS–TiO2 60% composite fibers. | ||
Conclusions
In summary, we successfully fabricated CIS–TiO2 composite fibers by employing the electrospinning method combined with a solvothermal technique. The TiO2 fibers wrapped with zincblende CIS showed a good photocurrent response under visible light illumination (λ > 400 nm), and the performance of composite fibers is related to the mass ratio of CIS:TiO2.
Acknowledgements
We thank the National Natural Science Foundation of China (20925621, 20976054, and 21176083), the Special Projects for Nanotechnology of Shanghai (11nm0500800) the Fundamental Research Funds for the Central Universities (WD1013015 and WD1114005), the Program for Changjiang Scholars and Innovative Research Team in University (IRT0825), and the Shanghai Leading Academic Discipline Project (project number: B502) for financial support.References
- (a) A. Fujishima, X. T. Zhang and D. A. Tryk, Surf. Sci. Rep., 2008, 63, 515 CrossRef CAS; (b) K. Zhou, Y. Zhu, X. Yang, X. Jiang and C. Li, New J. Chem., 2011, 35, 353 RSC.
- (a) Y. Bi and J. Ye, Chem.–Eur. J., 2010, 16, 10327 CrossRef CAS; (b) G. H. Du, Q. Chen, P. D. Han, Y. Yu and L. M. Peng, Phys. Rev. B, 2003, 67, 035323 CrossRef; (c) W. Wang, H. Lin, J. Li and N. Wang, J. Am. Ceram. Soc., 2008, 91, 628–631 CrossRef CAS; (d) M. Y. Song, D. K. Kim, K. J. Ihn, S. M. Jo and D. Y. Kim, Nanotechnology, 2004, 15, 1861 CrossRef CAS; (e) Q. Wang, Z. Wen and J. Li, Inorg. Chem., 2006, 45, 6944 CrossRef CAS; (f) L. Yang and W. W. Leung, Adv. Mater., 2011, 23, 4559 CrossRef CAS.
- H. Tong, S. Ouyang, Y. Bi, N. Umezawa, M. Oshikiri and J. Ye, Adv. Mater., 2012, 24, 229 CrossRef CAS.
- R. Ostermann, D. Li, Y. Yin, J. T. McCann and Y. Xia, Nano Lett., 2006, 6, 1297 CrossRef CAS.
- N. Wang, C. Sun, Y. Zhao, S. Zhou, P. Chen and L. Jiang, J. Mater. Chem., 2008, 18, 3909 RSC.
- A. Kubacka, M. Fernandez-García and G. Colon, Chem. Rev., 2012, 112, 1555 CrossRef CAS.
- Y. Li, G. M. Wang, H. Y. Wang, Y. C. Ling, Y. C. Tang, X. Y. Yang, R. C. Fitzmorris, C. C. Wang and J. Z. Zhang, Nano Lett., 2011, 11, 3026 CrossRef.
- H. Cao, Y. Zhu, X. Tan, H. Kang, X. Yang and C. Li, New J. Chem., 2010, 34, 1116 RSC.
- (a) A. Kongkanand, K. Tvrdy, K. Takechi, M. Kuno and P. V. Kamat, J. Am. Chem. Soc., 2008, 130, 4007 CrossRef CAS; (b) W. T. Sun, Y. Yu, H. Y. Pan, X. F. Gao, Q. Chen and L. M. Peng, J. Am. Chem. Soc., 2008, 130, 1124 CrossRef CAS.
- M. Nanu, J. Schoonman and A. Goossens, Adv. Funct. Mater., 2005, 15, 95 CrossRef CAS.
- (a) X. G. Peng, R. G. Xie and M. Rutherford, J. Am. Chem. Soc., 2009, 131, 5691 CrossRef; (b) H. Chang, W. Tzeng, C. Lin and S. Cheng, J. Alloys Compd., 2011, 509, 8700 CrossRef CAS.
- J. H. Yun, Y. H. Ng, S. Huang, G. Conibeer and R. Amal, Chem. Commun., 2011, 47, 11288 RSC.
- (a) D. Pan, L. An, Z. Sun, W. Hou, Y. Yang, Z. Yang and Y. Lu, J. Am. Chem. Soc., 2008, 130, 5620 CrossRef CAS; (b) B. Marsen, L. Steinkopf, A. Singh, H. Whilhelm, I. Lauermann, T. Unold, R. Scheer and H. Schock, Sol. Energy Mater. Sol. Cells, 2010, 94, 1730 CrossRef CAS.
- W. Yue, S. Han, R. Peng, W. Shen, H. Geng, F. Wu, S. Tao and M. Wang, J. Mater. Chem., 2010, 20, 7570 RSC.
- (a) A. Greiner and J. H. Wendorff, Angew. Chem., Int. Ed., 2007, 46, 5670 CrossRef CAS; (b) M. Jin, X. Zhang, A. V. Emeline, Z. Liu, D. A. Tryk, T. Murakami and A. Fujishima, Chem. Commun., 2006, 4483 RSC.
- D. Li and Y. Xia, Nano Lett., 2003, 3, 555 CrossRef CAS.
- J. Zhu, Z. Lu, S. T. Aruna, D. Aurbach and A. Gedanken, Chem. Mater., 2000, 12, 2557 CrossRef CAS.
- (a) A. Lafond, X. Rocquefelte, M. Paris, C. Guillot-Deudon and V. Jouenne, Chem. Mater., 2011, 23, 5168 CrossRef CAS; (b) T. Ryo, D. Nguyen, M. Nakagiri, N. Toyoda, H. Matsuyoshi and S. Ito, Thin Solid Films, 2011, 519, 7184 CrossRef CAS; (c) A. Goossens and J. Hofhuis, Nanotechnology, 2008, 19, 424018 CrossRef.
- (a) X. Han, Y. Zhu, X. Yang, J. Zhang and C. Li, J. Solid State Electrochem., 2011, 15, 511 CrossRef CAS; (b) K. Zhou, Y. Zhu, X. Yang and C. Li, Electroanalysis, 2011, 23, 862 CrossRef CAS.
- (a) P. V. Kamat, J. Phys. Chem. C, 2008, 112, 18737–18753 CAS; (b) S. Kang, Y. Yang, W. Bu and J. Mu, J. Solid State Chem., 2009, 182, 2972 CrossRef CAS.
- D. A. Gaal and J. T. Hupp, J. Am. Chem. Soc., 2000, 122, 10956 CrossRef CAS.
- (a) I. Robel, M. Kuno and P. Kamat, J. Am. Chem. Soc., 2007, 129, 4136 CrossRef CAS; (b) T. L. Li, Y. L. Lee and H. Teng, J. Mater. Chem., 2011, 21, 5089 RSC.
- (a) X. H. Yang, Z. Li, C. Sun, H. G. Yang and C. Li, Chem. Mater., 2011, 23, 3486 CrossRef CAS; (b) J. Zhu, S. Wang, Z. Bian, S. Xie, C. Cai, J. Wang, H. Yang and H. Li, CrystEngComm, 2010, 12, 2219 RSC.
| This journal is © The Royal Society of Chemistry 2012 |