Synthesis and piezoelectric response of cubic and spherical LiNbO3 nanocrystals†
Debasish
Mohanty
,
Girija S.
Chaubey
,
Amin
Yourdkhani
,
Shiva
Adireddy
,
Gabriel
Caruntu
and
John B.
Wiley
*
Department of Chemistry and Advanced Materials Research Institute, University of New Orleans, New Orleans, LA 70148, USA. E-mail: jwiley@uno.edu; Fax: +1 504 280 6860; Tel: +1 504 280 6849
First published on 6th January 2012
Abstract
Methods have been developed for the shape-selective synthesis of ferroelectric LiNbO3 nanoparticles. Decomposition of the single-source precursor, LiNb(O-Et)6, in the absence of surfactants, can reproducibly lead to either cube- or sphere-like nanoparticles. X-Ray diffraction shows that the LiNbO3 nanoparticles are rhombohedral (R3c). Sample properties were examined by piezoresponse force microscopy (PFM) and Raman where both sets of nanoparticles exhibit ferroelectricity. The longitudinal piezoelectric coefficients, d33, varied with shape where the largest value was exhibited in the nanocubes (17 pm V−1 for the cubes versus 12 pm V−1 for spheres).
Introduction
For the past several decades, there has been considerable interest in the synthesis of ferroelectric materials due to their various applications in electronics, nonvolatile memories, and thin film capacitors.1–2Lithium niobate (LiNbO3, here after abbreviated as LN) is a well known ferroelectric material and due to its excellent piezoelectric and nonlinear optical properties, has been intensely studied for applications in holographic memories, second harmonic generation, and electrooptics.3–6 Further, LN crystals show a strong room temperature spontaneous polarization of 70 C cm−2 that can persist up to the high ferroelectric transition temperature of 1483 K, making it a promising candidate for a number of other applications in sensor and piezoelectric antenna arrays.7–8A variety of synthetic methods have been used to prepare bulk LN including sol–gel,9 molten salt synthesis,10hydrothermal methods,11combustion,12 and solvothermal methods.13 The physical properties of materials can be strongly dependent upon particle shape, size, and crystallinity as well as preparation methods and as such, there is always an interest in studying properties as a function of dimensions, morphology, and processing history. Recently nanoparticles of LN were prepared using soft-chemical,5sugar–PVA matrix,14 and solution-phase methods.15 One report of the use of a single-source precursor, in combination with a surfactant, has been published and this method produced rod-like structures of aggregated LN nanoparticles.15 Despite the use of these various methodologies to prepare nanoscale LN, there have been no reports demonstrating effective shape control in the production of single crystalline nanoparticles. Herein, we describe the controlled synthesis of cube- and sphere-like LN nanoparticlesvia the single-source precursor, LiNb(O-Et)6. Both morphologies exhibit ferroelectric response with the cubic crystal demonstrating a larger piezoamplitude.
Experimental section
LN nanoparticles were readily synthesized by a solvothermal approach. The single-source precursor, LiNb(O-Et)6 (Alfa Aesar, 5% w/v in ethanol), and 1,4-butanediol (Sigma-Aldrich, ≥99%), used without any further purification, were heated in an autoclave (Parr Instrument Model #4749). In typical syntheses, 3.5 ml (for cube-shaped particles) or 4.5 ml (for spherical particles) of LiNb(O-Et)6 solution were placed in a ∼23 ml Teflon sleeve along with 2.5 ml of 1,4-butanediol. The Teflon vessel was sealed in the stainless steel autoclave and heated in a furnace at 235 °C for 3 d before being cooled down to room temperature naturally. The resulting white precipitate was collected by centrifugation, washed several times with ethanol, and dried in an oven at 70 °C.The X-ray diffraction (XRD) patterns of samples were collected on a Philips X-pert PW 3040 MPD X-ray powder diffractometer operated at 40 kV and 40 mA current with Cu-Kα radiation. The transmission electron microscopy (TEM) was performed with a JEOL 2010 electron microscope at accelerating voltage of 200 kV. Raman spectra were collected at room-temperature on a Thermo-Fisher DXR dispersive Raman spectrometer in a conventional backward geometry using the λ = 532 nm line with a spectral resolution of 3 cm−1. The laser was focused with an X50 long-focal-length objective to a spot of about ∼2 μm. Measurements were taken with a relatively low power of the incident laser beam (1 mW), to avoid the overheating of the sample. An Asylum Research MFP-3D atomic force microscope was employed to collect piezoelectric properties in a capacitor geometry, where the conductive AFM tip and the conductive substrate are the top and bottom electrodes, respectively. Individual LN nanoparticles were imaged in dual resonance tracking (DART) mode applying a small ac voltage with a drive amplitude of 40 mV and a contact resonance frequency of 270 kHz between the tip and the conductive substrate. To avoid measurement-related artefacts and to compare the piezoelectric properties of LN nanoparticles with different shapes, all measurements were carried out with the same conductive AFM tip and laser spot on the micro-cantilever. Local amplitude and phase hysteresis loops were collected by applying 22 V ac-voltage between the tip (top electrode) and conductive substrate (bottom electrode).
Results
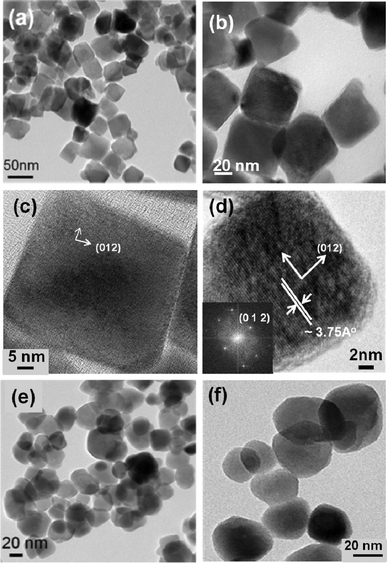
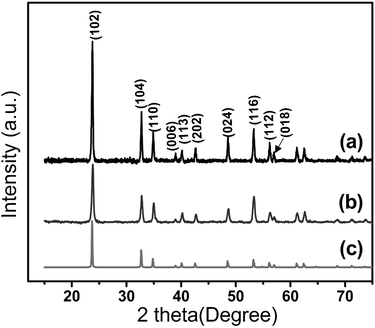
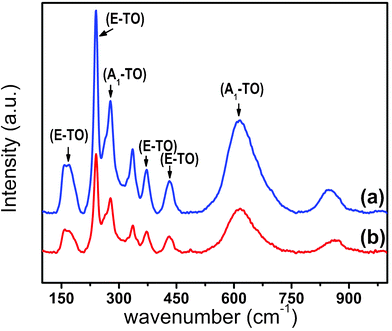
Fig. 1 presents the transmission electron microscopy (TEM) images of LN nanoparticles. Both cube-shaped (a–d) and sphere-shaped (e–f) nanoparticles can be obtained by this method. The nanocubes typically have an edge length of 50–60 nm (based on ∼100 particles, average edge length is 54.32 ± 6.53 nm), while the sphere-like particles have a sphere diameter of 40–60 nm (ave. dia. ≈ 48.82 ± 8.53 nm). A high resolution TEM image (HRTEM) of a cube, along with its First Fourier Transformation (FFT, see Fig. 1d and its inset), show that it is highly crystalline with the facet oriented along (012) planes. Structural and phase characterization of LN nanoparticles were further performed by X-ray powder diffraction (XRD). From Fig. 2, the nanoparticles can be seen to crystallize in the rhombohedral crystal system of the space groupR3c (#161), this being the ferroelectric phase of LN. All the diffraction peaks are well matched with those from the reference (PDF file #20-0631).16 The refined lattice parameters are in agreement with the values reported in the literature15 and appear to be independent of nanoparticle shape (a = b = 5.145(3) Å, c = 13.867(3) Å for nanocubes; a = b = 5.139(3) Å, c = 13.855(3) Å for nanospheres). Raman spectra in the range of 100–1000 cm−1 are shown in Fig. 3. Peaks are observed at 156, 239, 370, and 433 cm−1 and are attributed to the E transverse optical (TO) phonon mode of LN. These peaks are also consistent with the rhombohedral ferroelectric phase.17,18 The fundamental A1 TO modes were observed at 277 and 619 cm−1, which also agree with values reported for ferroelectric LN single crystals.17,18 | ||
| Fig. 1 TEM images of LiNbO3 nanoparticles. (a–d) Cubic shaped particles, (e–f) spherical shaped particles. (d) HRTEM of one single nanocube with its FFT transformation shown as inset. | ||
 | ||
| Fig. 2 XRD patterns of LiNbO3 nanoparticles. (a) Nanospheres and (b) nanocubes. The reference pattern (PDF file #20-0631) of LiNbO3 (trigonal crystal system, space groupR3c) is given in (c). | ||
 | ||
| Fig. 3 Raman spectra of LiNbO3 nanoparticles. (a) Nanospheres and (b) nanocubes. Transverse optical (TO) bands assignments, E TO and A1 TO, are shown. | ||
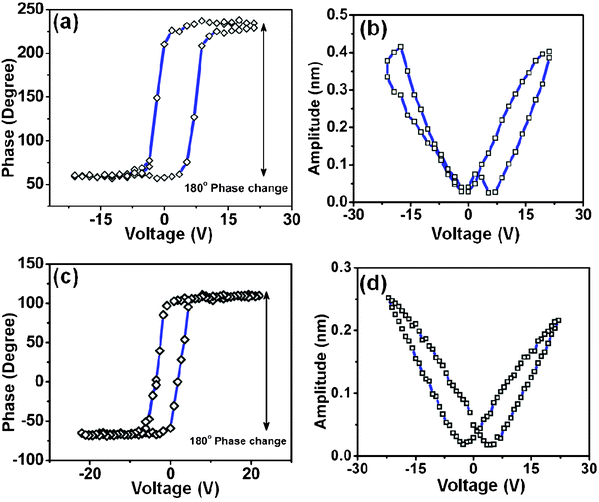
Piezoresponse force microscopy (PFM) was used to investigate the local electromechanical deformation of LN nanoparticles. Standard PFM hysteresis (piezo-phase versus voltage, Fig. 4a and 4c), and butterfly curves (piezo-amplitude versus voltage, Fig. 4b and 4d), for both LN nanocubes and nanospheres are shown in Fig. 4. In the phase response curves (Fig. 4a and 4c), the existence of intrinsic lattice polarization in both LN nanocubes and nanospheres and 180° switching can be observed, which indicates the existence of 180° domains in the lattice.19 Such a domain change in voltage is generally associated with ferroelectric behavior.20 The maximum piezo-amplitude signal measured was approximately 0.4 nm for the nanocubes and 0.25 nm for spherical nanoparticles (see Fig. 4b and 4d). From the linear portion of the piezoresponse amplitude signal, we have calculated the values of the longitudinal piezoelectric coefficients, d33, which are 17 pm V−1 for cube-like and 12 pm V−1 for spherical LN nanoparticles. (A = QVacd33, where A is piezo-amplitude, Q is the quality factor which accounts for the amplitude enhancement at tip-bias resonance and Vac is the voltage).
 | ||
| Fig. 4 (a) Phase and (b) amplitude responses from LN nanocubes, (c) phase and (d) amplitude responses from LN nanospheres. The double headed arrows in (a) and (c) highlight the 180° phase change with voltage. | ||
Discussion
The solvothermal method is a versatile technique for the production of metal oxide nanoparticles at low temperatures. In this study we found that the particle shape could be tuned simply by changing the amount of precursor. For larger amounts of LiNb(O-Et)6, the particles attain nearly spherical shape while with smaller amounts, cubic morphologies with well-defined edges were obtained. In a solvothermal reaction, pressure is generated autogenously in the reaction vessel and is dependent on the total volume of the vessel, the filling factor of the vessel, and the molar volume of the liquids. When the volume of the liquid inside the vessel is increased, the pressure generated decreases according to the Peng–Robinson equation of state.21 So by decreasing the amount of precursor, the pressure generated in the reaction vessel increases so as to facilitate the nucleation and growth of the particle along a particular direction, effectively favouring the cubic morphology. 1,4-butanediol also appears to be critical for this synthesis; syntheses attempted with other polyol solvents (ethylene glycol, triethylene glycol) were not successful and we found that only 1,4-butanediol leads to the production of the LN. It was also noted that three days’ reaction time was the minimum duration needed to form nanoparticles with definite shape. For example, the TEM image taken from a sample containing nanoparticles obtained after two days of reaction (Fig. S1†) showed only agglomerations of nanoparticles—those particles eventually grow during the aging time to produce nanocubes (Fig. 1a). The reaction temperature (T = 235 °C) also has an impact on the stabilization of LN. If the reaction is carried out at T = 250 °C for three days, the secondary phase, LiNb3O8, is formed along with LN (Fig. S2†) and if the reaction temperature is 220 °C, then crystallization does not occur.To investigate whether the LN nanoparticles were passivated with solvent species after their growth, FT-IR spectra were collected from neat 1,4-butanediol and then compared to that obtained from a solid sample containing LN nanocubes (Fig. S3†). No evidence of 1,4-butanediol can be observed in the spectrum. This is also consistent with the surfactant-free approach targeted in this synthesis.
LN is a ferroelectric material with a high Curie temperature (Tc = 1483 K). Below the Curie temperature, the material is rhombohedral with the R3c space group, and at higher temperature (>Tc), changes to R![[3 with combining macron]](https://www.rsc.org/images/entities/char_0033_0304.gif) c and R
c and R![[3 with combining macron]](https://www.rsc.org/images/entities/char_0033_0304.gif) .22 In the R3c ferroelectric phase, the cations are displaced along the [111] crystallographic direction, which breaks the mirror symmetry plane present in the high temperature paraelectric phase to induce the spontaneous polarization in the lattice. The XRD patterns of the synthesized nanoparticles show that the materials crystallize in the R3c phase, and this was further confirmed by Raman phonon bands. The optical phonon modes obtained from Raman scattering are very sensitive to stoichiometry, strain, impurities as well as the crystal system of the materials.17 The phonon modes observed for the LN cube-shaped nanoparticles are very similar to those of the spherical nanoparticles both in terms of position and relative intensity (Fig. 3). The characteristic phonon peaks convincingly suggest that the ferroelectric phase (R3c) is stable in these nanoparticles,17 results which are consistent with the PFM response curves. Close examination of the local piezoelectric response in individual nanoparticles evidenced that the displacement observed in nanocubes is slightly higher than that measured in nanospheres. This difference could be attributed to a greater crystallinity in nanocubes in tandem with the presence of better-defined facets in nanocubes than in spherical nanoparticles.23 This is consistent with previous studies where researchers found that piezoelectric properties of nanostructured materials can depend on the crystallite size,23 crystal orientation,24 and geometry.25,26
.22 In the R3c ferroelectric phase, the cations are displaced along the [111] crystallographic direction, which breaks the mirror symmetry plane present in the high temperature paraelectric phase to induce the spontaneous polarization in the lattice. The XRD patterns of the synthesized nanoparticles show that the materials crystallize in the R3c phase, and this was further confirmed by Raman phonon bands. The optical phonon modes obtained from Raman scattering are very sensitive to stoichiometry, strain, impurities as well as the crystal system of the materials.17 The phonon modes observed for the LN cube-shaped nanoparticles are very similar to those of the spherical nanoparticles both in terms of position and relative intensity (Fig. 3). The characteristic phonon peaks convincingly suggest that the ferroelectric phase (R3c) is stable in these nanoparticles,17 results which are consistent with the PFM response curves. Close examination of the local piezoelectric response in individual nanoparticles evidenced that the displacement observed in nanocubes is slightly higher than that measured in nanospheres. This difference could be attributed to a greater crystallinity in nanocubes in tandem with the presence of better-defined facets in nanocubes than in spherical nanoparticles.23 This is consistent with previous studies where researchers found that piezoelectric properties of nanostructured materials can depend on the crystallite size,23 crystal orientation,24 and geometry.25,26
Conclusions
Lithium niobate nanoparticles with different morphologies were synthesized under solvothermal conditions by a surfactant-free route using a single-source precursor. The shapes of the nanoparticles, nanocubes versus nanospheres, were tuned by simply changing the concentration of the precursor. Both sets of particles exhibit polarization switching at room temperature with static d33 coefficient values of 17 pm V−1 for cube-like and 12 pm V−1 for spherical LN nanoparticles. Work is ongoing to study ferroelectricity in these nanostructures, including the stability of the ferroelectric phase and the kinetics of the local polarization switching in individual nanocrystals. With controlled size and shape and predictable ferroelectric properties, these nanostructures will be attractive as building blocks for the design of complex structures, such as in ferroelectric memories, sensors, and multiferroic nanoparticulate composites.Acknowledgements
Financial support from the Department of Defense through DARPA (Grant HR 0011-09-1-0047) is gratefully acknowledged.References
- D. Hennings, M. Klee and R. Waser, Adv. Mater., 1991, 3, 334–340 CrossRef CAS.
- Z. B. Zhang, X. Z. Sun, M. S. Dresselhaus, J. Y. Ying and J. Heremans, Phys. Rev. B, 2000, 61, 4850–4861 CrossRef CAS.
- A. Guarino, G. Poberaj, D. Rezzonico, R. Degl'Innocenti and P. Gunter, Nat. Photonics, 2007, 1, 407–410 CrossRef CAS.
- D. F. Xue and X. K. He, Phys. Rev. B, 2006, 73, 64113 CrossRef.
- M. Niederberger, N. Pinna, J. Polleux and M. Antonietti, Angew. Chem., Int. Ed., 2004, 43, 2270–2273 CrossRef CAS.
- D. F. Xue and K. Kitamura, J. Cryst. Growth, 2003, 249, 507–513 CrossRef CAS.
- I. Inbar and R. E. Cohen, Phys. Rev. B, 1996, 53, 1193–1204 CrossRef CAS.
- D. L. Zhang, W. J. Zhang, Y. R. Zhuang and E. Y. B. Pun, Cryst. Growth Des., 2007, 7, 1541–1546 CAS.
- M. W. Pitcher, Y. N. He and P. A. Bianconi, Mater. Chem. Phys., 2005, 90, 57–61 CrossRef CAS.
- P. Afanasiev, Mater. Lett., 1998, 34, 253–256 CrossRef CAS.
- D. Dey and M. Kakihana, J. Ceram. Soc. Jpn., 2004, 112, 368–372 CrossRef CAS.
- M. N. Liu, D. F. Xue and C. Luo, J. Am. Ceram. Soc., 2006, 89, 1551–1556 CrossRef CAS.
- M. N. Liu and D. F. Xue, Mater. Lett., 2005, 59, 2908–2910 CrossRef CAS.
- S. Wohlrab, M. Weiss, H. C. Du and S. Kaskel, Chem. Mater., 2006, 18, 4227–4230 CrossRef CAS.
- B. D. Wood, V. Mocanu and B. D. Gates, Adv. Mater., 2008, 20, 4552–4556 CrossRef CAS.
- National Bureau of Standards (U.S.) Monograph, 1968, 6, 22 Search PubMed.
- A. S. Barker and R. Loudon, Phys. Rev., 1967, 158, 433 CrossRef.
- R. F. Schaufele and M. J. Weber, Phys. Rev., 1966, 152, 705 CrossRef CAS.
- S. V. Kalinin, A. N. Morozovska, L. Q. Chen and B. J. Rodriguez, Rep. Prog. Phys., 2010, 73, 056502 CrossRef.
- S. Jesse, A. P. Baddorf and S. V. Kalinin, Appl. Phys. Lett., 2006, 88, 062908 CrossRef.
- M. Rajamathi and R. Seshadri, Curr. Opin. Solid State Mater. Sci., 2002, 6, 337–345 CrossRef CAS.
- C. Abrahams, H. J. Levinstein and J. M. Reddy, J. Phys. Chem. Solids, 1966, 27, 1019 CrossRef.
- A. Rudiger, T. Schneller, A. Roelofs, S. Tiedke, T. Schmitz and R. Waser, Appl. Phys. A: Mater. Sci. Process., 2005, 80, 1247–1255 CrossRef.
- Z. X. Cheng, C. V. Kannan, K. Ozawa, H. Kimura and X. L. Wang, Appl. Phys. Lett., 2006, 89, 032901 CrossRef.
- Z. Y. Wang, J. Hu, A. P. Suryavanshi, K. Yum and M. F. Yu, Nano Lett., 2007, 7, 2966–2969 CrossRef CAS.
- Y. Zheng, C. H. Woo and B. Wang, J. Phys.: Condens. Matter, 2008, 20, 135216 CrossRef.
Footnote |
| † Electronic supplementary information (ESI) available: TEM image, IR spectra, XRD data. See DOI: 10.1039/c2ra00628f |
| This journal is © The Royal Society of Chemistry 2012 |
