Density functional theory and interatomic potential study of structural, mechanical and surface properties of calcium oxalate materials†
Devis Di
Tommaso
*,
Sergio E. Ruiz
Hernández
,
Zheimei
Du
and
Nora H. de
Leeuw
Department of Chemistry, University College London, 20 Gordon Street, London, WC1H 0AJ, United Kingdom. E-mail: d.tommaso@ucl.ac.uk; Fax: +44 (0)20 7679 7463; Tel: +44 (0)20 7679 7465
First published on 10th April 2012
Abstract
The structural and elastic properties of anhydrous calcium oxalate [COA, Ca(C2O4)] and calcium oxalate monohydrate [COM, Ca(C2O4)·H2O] have been studied by first-principles and interatomic potential calculations. Density functional theory calculations of the structures of COA and COM using a semi-empirical addition of dispersive forces to the Perdew–Burke–Ernzerhof (PBE) functional (PBE-D) are in substantially better agreement with experiment than conventional PBE calculations. The single-crystal elastic stiffness constants Cij of COA and COM have been computed at the PBE-D level from the polynomial fit of the total energy curve as a function of the deformation. We have consequently derived an interatomic potential (IP) for calcium oxalate that accurately reproduces the structural and elastic properties (bulk modulus, shear modulus, Young's modulus, bulk modulus-shear modulus ratio, Poisson's ratio, and elastic anisotropy ratio) of COA and COM as predicted by PBE-D. The IP model has been applied to compute the surface energies of COM and determine its equilibrium morphology by applying the Gibbs–Wulff theorem. The computed morphologies of the COM crystal agree with experimentally found morphologies.
Introduction
Calcium oxalate is present in nature in three degrees of hydration: calcium oxalate monohydrate (COM, CaC2O4·H2O-Whewellite), dihydrate (COD, CaC2O4·2H2O-Weddellite), and trihydrate (COT, CaC2O4·3H2O).1,2 The crystal structure of anhydrous calcium oxalate (COA) obtained from the complete dehydration of COM and COD has also been reported recently by Hochrein et al.3 Because of the chelate properties of the oxalate group, Whewellite and Weddellite are very important minerals in the ecosystem as reservoirs of calcium. Moreover, Whewellite is of considerable medical and biological interest,4 since it represents a major component of renal calculi,5 and is the most important phase in minerals and plants.6,7 For example, in plants needle-shape Whewellite crystals provide protection against herbivores and improve the mechanical properties of the tissues.2 Because of the fundamental role of calcium oxalates, several experimental studies have been concerned with the crystal structure,8 and the formation, growth, and aggregation of COM crystals,8–13 but they have not yet been the subject of any detailed computational chemistry study. However, molecular-level insights into complex phenomena such as nucleation and crystal growth, or the interaction of surfaces with simulated body fluid are challenging tasks that can only be investigated by applying simulation techniques such as classical molecular dynamics and lattice dynamics methods [e.g.ref. 14]. Most interatomic potentials for such simulations are derived empirically to reproduce experimental data like crystal structure and elastic properties [e.g.ref. 16], but despite extensive research the only experimental information available for calcium oxalates is their crystal structure, whereas the single-crystal elastic constants are unknown from either experiment or theoretical prediction. Therefore, an investigation of the structural and elastic properties of calcium oxalate materials using modern quantum mechanical techniques is clearly desirable. This approach provides several benefits: first, by reproducing computed quantities resulting from ab initio calculations, adopting a particular Hamiltonian, one is guaranteed that the training set is fully consistent and there are no differences in temperature, pressure, sample quality, or variable uncertainties in the ab initio computed data; secondly, data calculated by quantum mechanical methods are free of statistical mechanical effects, such as thermal, vibrations and zero point motion.15The aim of the present study is to compute the structures and single crystal elastic constants of COA and COM using modern density functional theory methods that include a semi-empirical correction to the dispersion interaction, and to derive an interatomic potential model that can accurately simulate the structural, elastic and surface properties of calcium oxalate materials. This IP model will then be applied to simulate surface structures and calculate crystal morphologies.
Structure
Anhydrous calcium oxalate (COA) is reported to undergo temperature-dependent phase transitions to form α-, β- and γ-modifications:3 | (1) |
Dehydration of COM has been proposed to occur via an intermediate α-phase to a stable β-phase, which takes place without destruction of the crystalline form and conserving the ion distances.17 The crystal structure of the β-modification has been revealed only recently by Hochrein and co-workers through a combination of atomistic computer simulations and Rietveld refinement of the X-ray powder pattern.3 COA crystallizes in the monoclinic system, with space group P2/m (No. 10) [see Fig. 1(a)]. The crystal structure of Whewellite, COM, used in the present study is the one reported by Tazzolli and Domeneghetti1 and Echigo et al.,8 which is a monoclinic structure belonging to the space group P21/c (No. 14) [see Fig. 2(a)].
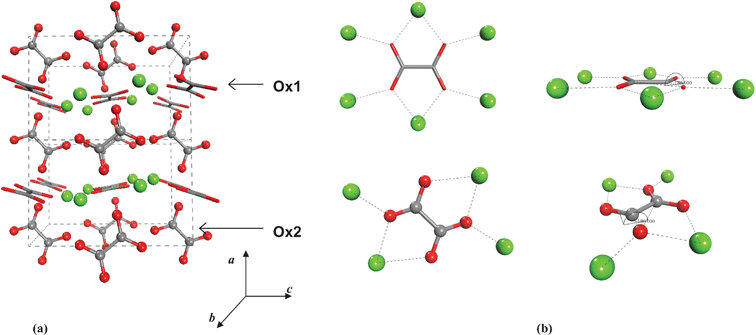 | ||
| Fig. 1 Crystal structure of COA and the calcium coordination around the Ox1 (sticks) and Ox2 (balls) type of oxalate ions (Hochrein et al., 2008). | ||
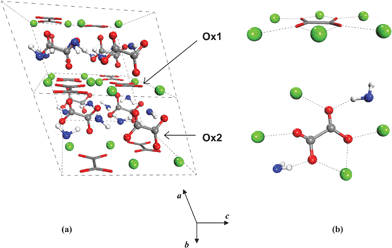 | ||
| Fig. 2 Crystal structure of COM and the calcium coordination around the Ox1 (sticks) and Ox2 (balls) type of oxalate ions (Echigo et al., 2005). | ||
It is worth noting the peculiar spatial structure of oxalate ions, with four negatively charged oxygen atoms lying on the same plane (see Fig. 1). This allows the oxalate group to coordinate to both calcium and water (see Fig. 2) and form a variety of stable hydrated crystals, in contrast with, for example, calcium carbonate, where the hydrated form (ikaite, CaCO3·6H2O) is only found in a metastable state. The crystal structures of COA and COM are closely related. There are two types of oxalate ions present in equal amounts: Ox1 and Ox2.11 Ox1 are located in the planes parallel to the (100) face together with all of the Ca ions, two of them by chelato-bond to a single Ca, and the other by a single Ca–O bond [see Fig. 1(b) and 2(b)]. Ox2 are situated between [100] layers parallel to [010] planes. Through the Ox2 ions, each oxalate binds four calcium ions [see Fig. 1(b)], and in case of COM, two additional water molecules are connected via hydrogen bonds to the oxygen atoms of Ox2 [see Fig. 2(b)]. The local environment of Ox1 is unaffected by the release of water on going from COM to COA, whereas Ox2 reorients itself in order to get closer to the surrounding four calcium ions.3
Methodology
2.1 DFT calculations
The unit cell was fully optimized in order to obtain the equilibrium crystal structure. Lattice parameters and internal atomic coordinates were independently modified to minimize the total energy and interatomic forces. The Broyden–Fletcher–Goldfarb–Shanno scheme was used for ions and cell relaxation. The criteria for the variable-cell minimisation were selected as follows: difference in total energy within 10−5 a.u., maximum ionic Hellmann–Feynman forces within 10−3 a.u., and maximum stress within 0.5 Kbar. No symmetry constraints were applied in the calculation.
To calculate the elastic coefficients, we have applied stricter criteria for the convergence of the internal atomic coordinates: difference in total energy within 2 × 10⁻⁶ a.u., and ionic Hellmann–Feynman forces within 10−4 a.u. The tolerance for the total-energy difference in the self-consistent-field calculation was 10−9 a.u. Test calculations using a 10 × 10 × 10 k-point mesh gave only marginal differences in the computed elastic constants (less than 0.5%).
| σ = Cε | (2) |
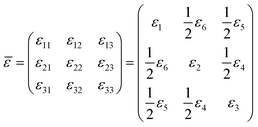
 | (3) |
 | (4) |
 | (5) |
According to Wallace,26 the internal energy of a crystal under strain, ![[small epsilon, Greek, macron]](https://www.rsc.org/images/entities/i_char_e0c6.gif) , can be Taylor-expanded in powers of the strain tensor with respect to the initial energy of the unstrained crystal:
, can be Taylor-expanded in powers of the strain tensor with respect to the initial energy of the unstrained crystal:
 | (6) |
Therefore, the second-order elastic constants (SOEC) are related to the strain second derivatives of the total energy:
 | (7) |
First-, third, and higher-order terms in eqn (6) are assumed to be zero, and this will be the case for pure linear elastic strains. However, these terms may not be exactly zero in actual calculations, but can be made close to zero with extremely small strains. Therefore, small elastic strains, εα, can be applied to the fully relaxed unit cell lattice, and elastic constants can be determined from the resulting change in energy.
Table 1 illustrates the distortion matrix employed and the relation between the elastic constant of a monoclinic crystal27 and the second order coefficient of the polynomial. Quantities such as the elastic constants depend on the unit cell orientation relative to the Cartesian frame. In the ‘standard’ crystallographic convention the special axis of monoclinic systems is b and the orientation of the lattice vectors of a monoclinic unit cell are:
 | (8) |
| Distortion matrix | Relation between the elastic constants and the second order coefficient of fit |
|---|---|

|

|

|

|

|

|

|

|

|

|

|

|

|

|

|

|

|

|

|

|

|

|

|

|

|

|
However, Quantum-ESPRESSO uses a different convention (the special axis is c) and the matrix R of the crystallographic vectors is:
 | (9) |
The correspondence between the elastic constants associated with the monoclinic unit cell orientation in PWscf and the elastic constants associated with the ‘standard’ monoclinic unit cell orientation, together with the full set of elastic constants computed according to the monoclinic unit cell orientation in PWscf, are reported in Table SI.1 (ESI†). The lattice parameters and elastic constants reported in the present work refer to the ‘standard’ crystallographic monoclinic unit cell orientation.
Any distortion matrix D will move every Bravais lattice point of the undistorted lattice to a new position in the distorted matrix R'. For each deformation matrix, the limit of the maximum positive and negative deformation (δ) was increased in increments of 0.005, up to the values of ± 0.03. For each deformed unit cell, the internal atomic coordinates were fully minimised.
The SOEC Cαβ were then obtained by means of polynomial fits of the crystal energy curves, and by applying the relations between the elastic constants and the second order coefficient of fit reported in Table 1. Following Perger et al.,28 we have considered an analysis of the effect of Np, the number of points used for the evaluation of the numerical second-derivative of the energy with respect to the strain parameter, and P, the degree of the polynomial used for fitting, to the values of the SOEC. The results, reported in Table SI.2 (ESI†), show that the values of Cαβ depend significantly on Np and P. For example C11 changes from 89.7 GPa (Np = 9, P = 2) to 95.0 GPa (Np = 15, P = 10). In Fig. 3 are reported the values of C11 as a function of the number of energy points for fitting polynomials of different order, which shows that C11 does not converge with Np. However, when the order of the fit is chosen to be Np-1 (red line in Fig. 3) then the value of C11 is significantly less dependent on the parameters Np and P. Table 2 reports the values of C22 obtained from fitting Np energy values with a polynomial of order P = Np-1, together with the values of the Pearson's chi-square test to judge the quality of the fitting:
 | (10) |
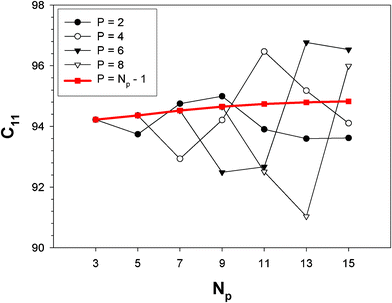 | ||
| Fig. 3 Second-order elastic constant C11 as a function of the maximum strain |δmax| included in the polynomial fitting of order P. | ||
| C11 | χ 2 | |
|---|---|---|
| 15 | 94.8 | 3.4E-01 |
| 13 | 94.8 | 3.2E-02 |
| 11 | 94.7 | 2.4E-02 |
| 9 | 94.7 | 1.7E-04 |
| 7 | 94.5 | 6.3E-06 |
| 5 | 94.4 | 4.5E-07 |
| 3 | 94.2 | 2.2E-05 |
2.2 Interatomic potential calculations
The atomistic simulations performed in this study were conducted using the codes GULP (version 3.1)29 and METADISE.30–32 GULP was used to derive the potential parameters and compute the bulk properties of calcium oxalate by performing constant pressure optimisations, whereas METADISE was employed to conduct the surface calculations as this program was specifically designed to model dislocation, interfaces and surfaces.Both programs implement the Born model of solids, which assumes that the ions in the crystal interact via short-range repulsive interactions, longer-range attractive interactions, and long-range Coulombic interactions. The short-range energy contribution due to interactions between each particle and all others is summed within a predetermined cutoff. The contribution of the long range electrostatic forces is summed using the Ewald sum. The electronic polarisability of ions is included via the shell model of Dick and Overhauser in which each polarisable ion, in this case the oxygen atoms of the oxalate groups and water molecules, is represented by a core and a massless shell, connected by a spring. The polarisability of the model ion is then determined by the spring constant and the charges of the core and shell.
| Buckingham: Ae−r/p − Cr−6 | A (eV) | ρ (Å) | C (eV Å6) | Cutoff (Å) | |||
|---|---|---|---|---|---|---|---|
| Oox,shell | Oox,shell | 16![[thin space (1/6-em)]](https://www.rsc.org/images/entities/char_2009.gif) 372.0 372.0 |
0.21300 | 3.47 | r min = 0.0/rmax = 20.0 | ||
| Oox,shell | Oow,shell | 12![[thin space (1/6-em)]](https://www.rsc.org/images/entities/char_2009.gif) 533.6 533.6 |
0.21300 | 12.09 | r min = 0.0/rmax = 20.0 | ||
| Cacore | Oox,shell | 1550.0 | 0.29360 | 0.0 | r min = 0.0/rmax = 20.0 | ||
| Cacore | Oow,shell | 1186.6 | 0.29700 | 0.0 | r min = 0.0/rmax = 20.0 | ||
| Ccore | Oox,shell | 261.0 | 0.34000 | 0.0 | r min = 2.64/rmax = 20.0 | ||
| Ccore | Oow,shell | 217.5 | 0.34000 | 0.0 | r min = 0.0/rmax = 20.0 | ||
| Hcore | Oox,shell | 396.3 | 0.23000 | 0.0 | r min = 0.0/rmax = 20.0 | ||
| Hcore | Oow,shell | 396.3 | 0.25000 | 10.0 | r min = 1.31/rmax = 20.0 | ||
| Lennard-Jones: U(r) = A/r6 − B/r12 | A (eV Å6) | B (eV Å6) | |||||
| Oow,shell | Oow,shell | 39![[thin space (1/6-em)]](https://www.rsc.org/images/entities/char_2009.gif) 344.98 344.98 |
42.15 | r min = 0.0/rmax = 9.25 | |||
| Morse: D{[1 − exp(− (r − r0)2)] − 1} | D (eV) | α (Å−1) | r0 (Å) | ||||
| Ccore | Oox,shel | 4.710000 | 3.4500 | 1.30 | r min = 0.0/rmax = 1.4 | ||
| Ccore | Ccore | 20.60800 | 2.9198 | 1.51 | r min = 0.0/rmax = 1.6 | ||
| Hcore | Ow,shell | 6.203713 | 2.2220 | 0.92376 | r min = 0.75/rmax = 1.3 | ||
| Hcore | Ow,core | 0.000000 | 2.2220 | 0.92376 | r min = 0.75/rmax = 1.3 | ||
| Hcore | Hcore | 0.000000 | 2.8405 | 1.50 | r min = 0.0/rmax = 1.65 | ||
Three-body (the pivot is first atom):  |
k 3 (eV rad−2) | θ 0 (°) | |||||
| Ccore | Oox,core | Oox,core | 7.0000 | 125.000 | r max (1–2) = 1.4 rmax(1–3) = 1.4 rmax(2–3) = 2.4 | ||
| Ccore | Oox,core | Cox,core | 6.6900 | 125.000 | r max (1–2) = 1.4 rmax(1–3) = 1.6 rmax(2–3) = 2.6 | ||
| Ow,shell | Hcore | Hcore | 4.1998 | 108.6930 | r max (1–2) = 1.2 rmax(1–3) = 1.2 rmax(2–3) = 1.7 | ||
| Torsion: k4 [1 + cos(2φ − 180°)] | k 4 (eV) | ||||||
| Oox,core | Cox,core | Cox,core | Oox,core | 0.218961 | r max (1–2) = 1.4 rmax(2–3) = 1.6 rmax(3–4) = 1.4 rmax(4–1) = 4.0 | ||
| Cox,core | Cox,core | Oox,core | Oox,core | 0.112900 | r max (1–2) = 1.6 rmax(2–3) = 2.4 rmax(3–4) = 2.4 rmax(4–1) = 1.4 | ||
Spring:  |
k cs (eV Å−2) | ||||||
| Oox,core | Oox,shell | 507.4000 | Applies between oxygen and its shell | ||||
| Oow,core | Oow,shell | 209.4496 | Applies between oxygen and its shell | ||||
| Charges | (e) | ||||||
| Cacore | + 2.000 | No cutoff | |||||
| Cox,core | 1.090 | ||||||
| Oox,core | 0.587 | ||||||
| Oox,core | −1.632 | ||||||
| Oow,core | 1.250 | ||||||
| Oow,shel | −2.050 | ||||||
| Hcore | 0.400 | ||||||
| Intramolecular Coulomb subtraction | (%) | ||||||
| H | Ow | 50 | |||||
| H | H | 50 | |||||
The surface energy is computed using the following expression:
 | (11) |
In addition, a measure of the relative stabilities of the surfaces is provided by the equilibrium morphology of a crystal which is determined by the surface energy and the related growth rate of the various surfaces. Wulff proposed that a polar plot of surface energy versus orientation of normal vectors gives the crystal morphology,41 while Gibbs42 proposed that the equilibrium form of a crystal should possess minimal total surface free energy for a given volume. A surface with a high surface free energy has a large growth rate, and this fast growing surface will not be expressed in the equilibrium morphology of the resulting crystal. Only surfaces with low surface free energies and hence slow growth will be expressed. At 0 K, the surface free energy is a close approximation of the surface energy as calculated by static lattice simulations, because the entropy term included in the surface free energy is small compared to the enthalpy term, as the difference between the energies of the bulk and the surface is small. Thus, the surface energies can be assumed to determine the equilibrium morphology of the crystal.
As the mineral particles are present in an aqueous environment, we have modelled the hydrated surfaces of COM with a full monolayer of water, which is here defined as the maximum number of water molecules that can be adsorbed at the surface in a single layer. The addition of a monolayer of water to the surface was executed for all surfaces of COM, using a variety of initial starting configurations for the water molecules. The energy of the surface with a monolayer of water was then calculated using the following expression:
 | (12) |
 | (13) |
A negative value for the hydration energy indicates that the adsorption of water is energetically favourable.
Results
DFT calculations
3.1.1 Geometry. Table 4 shows the comparison between computed and experimental lattice parameters of COA and COM. For COA our PBE plane wave calculations are in better agreement with experiment than the lattice parameters computed using localised numeric basis set reported by Hochrein et al.,3 which we explain in terms of our better k-point sampling. However, the PBE/PW method still significantly overestimates the lattice parameters and gives a value for the unit cell volume that deviates from the experimental value by +3.9%. The inclusion of the dispersion correction within the PBE approximation reduces significantly the overestimation in the lattice parameters from 1.0% to 0.6% for lattice parameter a, from 1.4% to 0.8% for lattice parameter b, and from 1.4% to 0.5% for lattice parameter c. Results for COM show the same trend: PBE results overestimate the cell parameters, whereas the PBE-D functional is in good experimental agreement, with errors of less than 1% for a, b, and c (see Table 4).
| V 0 (Å3) | a/Å | b/Å | c/Å | β (°) | ||
|---|---|---|---|---|---|---|
| a Present work, plane waves, ultra-soft pseudopotential, Ecut = 50 Ry, 5 × 5 × 5 grids of k-points. b Ref. 3, PBE, numerical basis set, Trullier–Martins pseudopotentials, Ecut = 200 Ry, 9 k-points. c Ref. 3. d Ref. 8. | ||||||
| COA | PBE-Da | 440.687 (1.8) | 6.211 (0.6) | 7.399 (0.8) | 9.589 (0.5) | 89.92 (−0.4) |
| PBEa | 449.586 (3.9) | 6.251 (1.0) | 7.469 (1.4) | 9.629 (1.4) | 89.97 (−0.3) | |
| PBEb | 453.127 (4.7) | 6.247 (1.3) | 7.515 (1.3) | 9.653 (2.1) | 90.12 (−0.1) | |
| Experimentb | 432.834 | 6.164 | 7.362 | 9.537 | 90.24 | |
| COM | PBE-Da | 871.628 (1.4) [−0.4] | 6.296 (0.7) [0.1] | 14.573 (0.1) [−0.1] | 10.100 (−0.13) [−0.2] | 109.87 (−0.1) [0.4] |
| PBEa | 890.325 (3.6) [1.8] | 6.352 (1.6) [1.0] | 14.690 (1.5) [0.7] | 10.124 (0.10) [0.1] | 109.54 (−0.4) [0.1] | |
| Experimentc | 859.742 | 6.250 | 14.471 | 10.114 | 109.98 | |
| Experimentd | 874.904 | 6.290 | 14.583 | 10.116 | 109.46 | |
Table 5 reports the average values of some relevant bond distances and OCO angles of the COA and COM structures. As one would expect, the PBE and PBE-D methods give very similar intra-molecular geometries, which are in good agreement with experiment. On the other hand, the inter-molecular Ca···O distances and, in particular, the Oox···Oox distances computed at the PBE-D level are shorter than the those computed at the PBE level, and in better agreement with experiment. Fig. 4 highlights the Oox···Oox separation between planes of oxalate groups of type Ox2, which lie along the c parameter. The anisotropy in the O···O interaction highlights the main reason for the overestimation by the DFT-PBE method of the lattice parameter c compared with the lattice parameters a and b: because Van der Waals dynamical forces cannot be described within the formalism of GGA functionals, the extra attractive contribution in the PBE-D functional is probably the reason why the distance between the dispersively bound layers is reduced.
![View along [100] direction showing the dispersively bound layers between planes of oxalate groups of type Ox2 in the COA and COM crystals.](/image/article/2012/RA/c2ra00832g/c2ra00832g-f4.gif) | ||
| Fig. 4 View along [100] direction showing the dispersively bound layers between planes of oxalate groups of type Ox2 in the COA and COM crystals. | ||
| C–Oox | C–C | OoxCOox | OwH | Ca···Oe | Oox1···Oox1f | ||
|---|---|---|---|---|---|---|---|
| a Present work, plane waves, USPP, Ecut = 50 Ry, 5 × 5 × 5 grids of k-points. b Ref. 3. c Ref. 8. d Ref. 1. e Average over values < 3.0 Å. f Average over values < 5.0 Å. | |||||||
| COA | PBE-Da | 1.266 | 1.565 | 126.480 | — | 2.385 | 3.914 |
| PBEa | 1.267 | 1.564 | 126.568 | — | 2.402 | 3.956 | |
| Experimentb | 1.287 | 1.592 | 125.764 | — | 2.391 | 3.872 | |
| COM | PBE-Da | 1.267 | 1.558 | 126.389 | 1.009 | 2.446 | 4.477 |
| PBEa | 1.268 | 1.558 | 126.629 | 1.004 | 2.457 | 4.504 | |
| Experimentc | 1.232 | 1.552 | 126.8 | 0.956 | 2.444 | 4.458 | |
| Experimentd | 1.253 | 1.550 | 127.0 | 2.448 | 4.484 | ||
3.1.2 Elastic constants. In Fig. 5 are reported the changes in total energy (ΔE) of COA as a function of the strain (δ) for the type of distortions related to the elastic constants C11, C22, C33, C44, C55, C66, C12, C13 and C23 (see Table 1). The graphs show substantial differences in the response of the material with the type of deformation of the unit cell. The distortions D11, D22 and D33 involved in the determination of C11, C22, and C33 correspond to straining the lattice along the x, y, and z axis, respectively, and are considerably steeper than those associated with the shear deformations D55 and D66, which are involved in the determination of C55 and C66, respectively. The higher resistance to volume strain along the x, y, and z axis is associated with the deformation of the C–C covalent bonds, which lie along the x-axis for the oxalate type 1, and on the xz plane for the oxalate type 2 (see Fig. 1).
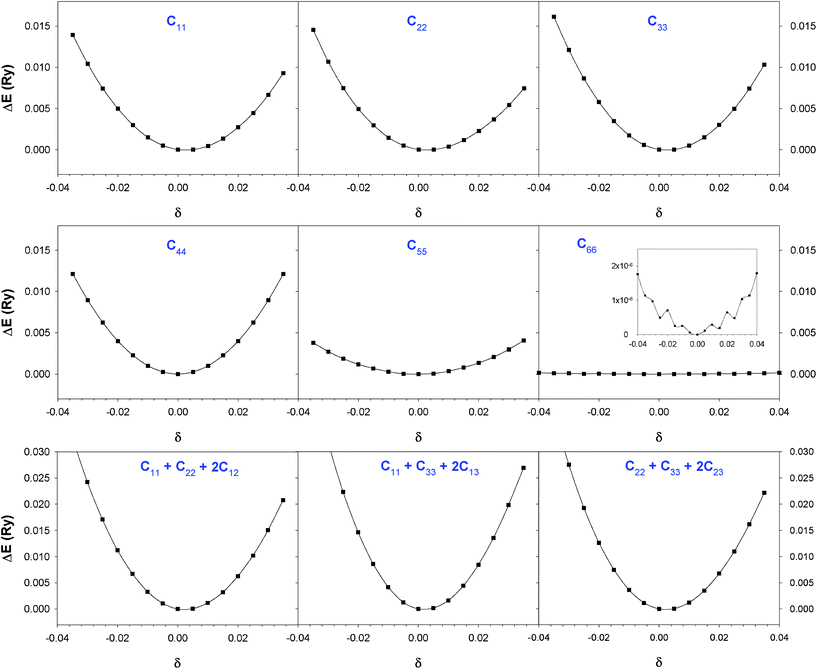 | ||
| Fig. 5 Change in the strain energy (ΔE) as a function of strain (δ) for the deformations of COA from DFT-D calculations. | ||
For the shear deformations, let us consider in Fig. 6 the comparison of the fully relaxed unit cell with the unit cell under D55 distortion matrix (δ = 0.03). Analysis of the structure has shown that there is no significant variation of the intra-molecular distances and angles before and after the deformation, whereas the inter-atomic separations between the oxygen atoms of Ox1 and Ox2 change by 0.1–0.2 Å (see Fig. 6). The flatter potential energy surface of the van der Waals interactions compared with covalent bonds is therefore responsible for the higher compressibility of COA along the D55 and D66 shear distortions.
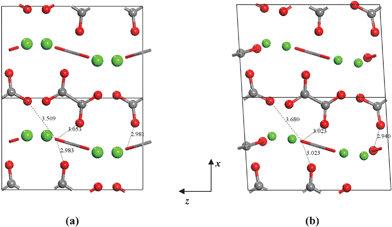 | ||
| Fig. 6 (a) 1 × 2 × 1 unit cell of COA. (b) 1 × 2 × 1 unit cell of COA under D66 shear deformation with δ = 0.03. | ||
The values of the second order elastic constants of COA and COM obtained by means of polynomial fits of the crystal energy curves in Fig. 5 are summarised in Table 6, where we have also reported the elastic constants of COA obtained by a single point calculation of the deformed unit cell where the atomic coordinates followed linearly the linear elastic deformation (term “unrelaxed in Table 6”). The “unrelaxed” approach in the calculation of elastic constants has been used in previous theoretical studies of binary systems.43,44 The influence of atomic relaxation on the SOEC is significant, as their values are 5 to 20 times higher than those evaluated using the standard procedure of re-optimising the atomic positions after each deformation of the unit cell. The elastic constants C33 and C55 have also been computed at the PBE level without dispersion correction, and their values are higher than those evaluated at the PBE-D level (see Table 6).
| COA | COM | |||
|---|---|---|---|---|
| PBE | PBE-D | PBE-D unrelaxed | PBE-D | |
| C11 | 94.4 | 249.5 | 76.0 | |
| C22 | 97.8 | 138.7 | 89.6 | |
| C33 | 109.5 | 104.0 | 968.0 | 144.2 |
| C44 | 27.4 | 75.0 | 29.2 | |
| C55 | 9.4 | 4.7 | 88.9 | 28.6 |
| C66 | 0.9 | 75.0 | 4.2 | |
| C12 | 18.5 | 8.2 | ||
| C13 | 39.1 | 29.0 | ||
| C23 | 17.8 | 24.7 | ||
Comparison of the elastic constants of COA and COM shows that C33 increases considerably from 104 GPa to 144 GPa. C33 is related to the deformation of the c axis. Parallel to the c axis lie the oxalate ions of type Ox2, whose coordination number increases from 4 in COA to 6 in COM, as two additional water molecules are connected via hydrogen-bonds to the oxygen atoms of Ox2 [see Fig. 1(b) and Fig. 2(b)]. We therefore argue that this increase of C33 is associated with the observed increase of the coordination shell on going from COA to COM.
Interatomic potential structural calculations
Table 7 reports the optimised structural parameters of the anhydrous (COA), monohydrated (COM) and trihydrated (COT) forms of calcium oxalate, computed using the inter-atomic potential model reported in Table 3, together with the percentage deviation from PBE-D and experimental results. For COM the experimental parameters refer to the work of Echigo and co-workers.8 The structure of the oxalate group and the lattice parameters of COA and COM simulated using the interatomic potentials are in excellent agreement with the PBE-D structures, with the optimised unit cell volume deviating by 0.0% and less than 1.5%, respectively. For COT the results are less favourable, with the lattice parameter b differing by 14.3% from the experimental lattice.45 However, the interest for calcium oxalate materials is mostly focused on the monohydrated form (COM), as this is, among other things, the principal crystalline component found in renal calculi.46| % ΔDFT-D | % Δexpa | |||
|---|---|---|---|---|
| a For COA ref. 3; for COM ref. 1; for COT ref. 54. b Average over values < 3.0 Å. c Average over values < 5.0 Å. | ||||
| COA | V 0 (Å3) | 440.523 | 0.0 | 1.8 |
| a/Å | 6.188 | −0.4 | 0.4 | |
| b/Å | 7.214 | −2.5 | −2.0 | |
| c/Å | 9.868 | 2.9 | 3.5 | |
| β (°) | 90.0 | 0.1 | −0.3 | |
| r(C–Oox) | 1.262 | −0.3 | −1.9 | |
| r(C–C) | 1.548 | −1.0 | −2.8 | |
| θ (OoxCOox) | 130.6 | 3.2 | 3.8 | |
| r(Ca–Oox)b | 2.382 | −0.1 | −0.4 | |
| r(Oox–Oox)c | 3.939 | 0.6 | 1.7 | |
| COM | V 0 (Å3) | 884.298 | 1.5 | 1.1 |
| a/Å | 6.306 | 0.2 | 0.3 | |
| b/Å | 14.236 | −2.3 | −2.4 | |
| c/Å | 10.153 | 0.5 | 0.4 | |
| β (°) | 104.0 | −5.3 | −5.0 | |
| r(C–Oox) | 1.263 | −0.3 | 0.8 | |
| r(C–C) | 1.549 | −0.6 | −0.1 | |
| θ (OoxCOox) | 130.1 | 2.9 | 2.4 | |
| COT | V 0 (Å3) | 331.711 | 2.1 | |
| a/Å | 7.081 | −0.9 | ||
| b/Å | 9.832 | 14.3 | ||
| c/Å | 6.003 | −1.6 | ||
| α (°) | 119.4 | 6.3 | ||
| β (°) | 112.6 | 3.4 | ||
| γ (°) | 86.7 | −3.6 | ||
| r(C–Oox) | 1.261 | 0.5 | ||
| r(C–C) | 1.548 | 0.4 | ||
| θ (OoxCOox) | 130.7 | 4.5 | ||
Elastic properties of polycrystalline crystals
In this section we will discuss the elastic properties of randomly oriented monohydrated and anhydrous calcium oxalate polycrystals. For crystal samples that are randomly oriented it is not possible to measure individual elastic constants. The theoretical polycrystalline elastic modulus can, however, be determined from the set of independent elastic stiffness constants. There are two methods to calculate the polycrystalline modulus, namely, the Voigt method and the Reuss method. They provide the upper (Voigt) and lower (Reuss) bounds to the polycrystalline elastic modulus.47 The bulk modulus (B) and shear modulus (G) according to each approximation are given by| 9BV = (C11 + C22 + C33) + 2(C12 + C23 + C31) | (14) |
| 1/BR = (S11 + S22 + S33) + 2(S12 + S23 + S31) | (15) |
| 15GV = (C11 + C22 + C33) − (C12 + C23 + C31) + 3(C44 + C55 + C66) | (16) |
| 15/GR = 4(S11 + S22 + S33) − (4S12 + S23 + S31) + 3(S44 + S55 + S66) | (17) |
 | (18) |
 | (19) |
Further physical elastic properties are the Young's modulus, E, and the Poisson's ratio, ν, given by eqn (20) and (21):
 | (20) |
 | (21) |
From a physical point of view, B represents the amount of pressure (mean stress) required for a unit volume change of the material, G measures the shear forces required to induce a unit shape change measured, E is the forces per unit of cross-sectional area needed for a unit dimensional change (either elongation or shortening), and ν is the ratio between the lateral strain (e.g., shrinkage or bulging) accompanying a unit expansion of compression change. These properties determine the load-deformation relations of polycrystalline material under different types of force loading.
Table 8 lists the bulk modulus, B, shear modulus, G, Young's modulus, E, and Poisson's ratio ν of COA and COM based on the values of elastic constants computed at the PBE-D level and from the potential model reported in Table 3. For both COA and COM, the elastic properties computed using the IP agree very well with the DFT results.
Poisson's ratio is associated with the volume change during uniaxial deformation. If ν = 0.5, no volume change occurs during elastic deformation. The computed values of ν of the anhydrous calcium oxalate are consistently higher than the values computed for COM, suggesting that larger volume changes occur for the hydrated form of calcium oxalate during force loading. The Poisson ratio also provides more information regarding the characteristics of the bonding forces than any of the other elastic constants.48 It has been proven that ν = 0.25 is the lower limit for central-force solids and 0.5 is the upper limit, which corresponds to infinite elastic anisotropy. According to this classification, the simulations agree with the conclusion that the interatomic forces in COA and COM are central.
Using the ratio introduced by Pugh,49B/G, which gives the resistance to fracture (B) relative to plastic deformation resistance (G), one can analyse the ductility of a material. A high value of B/G indicates a tendency for ‘ductility’, while a low value of B/G indicates a tendency for ‘brittleness’. The critical value which separates ductile and brittle materials has been evaluated to be equal to 1.75 (ductile material B/G > 1.75; brittle material B/G < 1.75). Both anhydrous and monohydrated forms of calcium oxalate yield values higher than 1.75, suggesting that calcium oxalate materials are prone to ductility. Moreover, the value of B/G on going from COA to COM decreases, which suggests that the inclusion of water in the crystal makes the material more brittle.
Surface energies and morphology
Starting from the experimental structure determined by Daudon (a = 6.316 Å, b = 14.541 Å and c = 10.116 Å; α = γ = 90° and β = 109°),51 the COM crystal was cut to obtain the surfaces {100}, {12![[1 with combining macron]](https://www.rsc.org/images/entities/char_0031_0304.gif) }, {001}, {021} and {010}, as these are expressed in the experimental morphology,8 but also other low Miller index surfaces, such as {110}, {011}, {111} and {101}. The calculated surface energies of “dry” (γpure) and “hydrated” (γhydrated) surfaces are reported in Table 9, which shows that the addition of a monolayer of water stabilises all surfaces (γhydrated < γpure). All the surfaces are stabilized by hydration, due to the formation of hydrogen-bonds between the added water molecules and the oxalate groups in the top layer of the surfaces.
}, {001}, {021} and {010}, as these are expressed in the experimental morphology,8 but also other low Miller index surfaces, such as {110}, {011}, {111} and {101}. The calculated surface energies of “dry” (γpure) and “hydrated” (γhydrated) surfaces are reported in Table 9, which shows that the addition of a monolayer of water stabilises all surfaces (γhydrated < γpure). All the surfaces are stabilized by hydration, due to the formation of hydrogen-bonds between the added water molecules and the oxalate groups in the top layer of the surfaces.
| Surface | γ pure (J m−2) | γ hydrated (J m−2) | ΔHhydration (kJ mol−1) |
|---|---|---|---|
| {001} | 0.51 | 0.50 | −225.31 |
| {010} | 0.35 | 0.11 | −236.44 |
| {100} | 0.34 | 0.14 | −526.31 |
| {110} | 0.62 | 0.60 | −400.90 |
| {011} | 0.63 | 0.54 | −323.92 |
| {111} | 0.57 | 0.36 | −740.70 |
| {101} | 0.52 | 0.47 | −519.83 |
| {021} | 0.63 | 0.37 | −608.45 |
{12![[1 with combining macron]](https://www.rsc.org/images/entities/char_0031_0304.gif) } } |
0.53 | 0.20 | −858.96 |
In the most stable dry surfaces after relaxation, {001}, {010} and {12![[1 with combining macron]](https://www.rsc.org/images/entities/char_0031_0304.gif) }, the oxalate molecules were coordinated to calcium in one of the forms shown in Fig. 2b. In the case of {110}, {011}, {111} and {101}, at least one oxalate group is missing the preferred coordination with calcium. This is shown in Fig. 7, which shows the relaxed dry and hydrated {021} surface, where there are two Ca2+ “missing”. In this particular case the adsorbed water molecules fill the space between the oxalates in the surface and thus contribute to stabilizing the system by increasing the coordination of the surface species.
}, the oxalate molecules were coordinated to calcium in one of the forms shown in Fig. 2b. In the case of {110}, {011}, {111} and {101}, at least one oxalate group is missing the preferred coordination with calcium. This is shown in Fig. 7, which shows the relaxed dry and hydrated {021} surface, where there are two Ca2+ “missing”. In this particular case the adsorbed water molecules fill the space between the oxalates in the surface and thus contribute to stabilizing the system by increasing the coordination of the surface species.
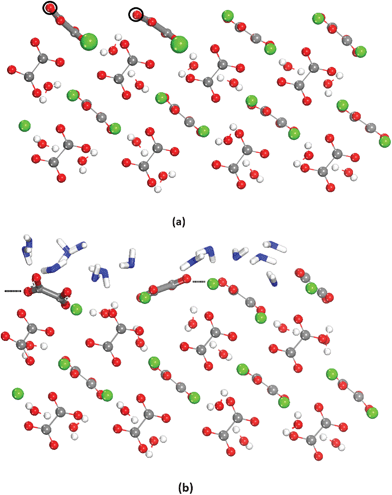 | ||
| Fig. 7 Dry (a) and hydrated (b) {021} surfaces. In (a) the black empty circumferences represent the position of the Ca ions in the bulk of the crystal. In (b) the hydration water is represented in blue. | ||
The equilibrium morphologies can be obtained from the surface energies reported in Table 9 using the Wulff construction method. Fig. 8(a) and 8(b) shows the equilibrium morphology of COM computed from the surface energies of the dry and hydrated surfaces, respectively. Both morphologies are very similar to the experimental one [see Fig. 8(c)], but the dry crystal morphology shows a residual {111} face, and {021} is missing, whereas the hydrated model shows all faces expressed frequently in experiment.11 The influence of the water also makes the crystal flatter [Fig. 8(b)], very close to the needle shape reported in the experiments.
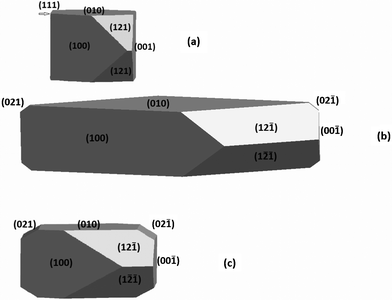 | ||
| Fig. 8 (a) Simulated equilibrium morphology of COM without solvent effect. (b) Simulated equilibrium morphology of COM considering solvent (pure water) effect . (c) Experimental equilibrium morphology of COM as deduced from synthetic and natural samples (ref. 11). | ||
Conclusions
We have reported a computational investigation of the structural and elastic properties of anhydrous calcium oxalate (COA) and calcium oxalate monohydrate (COM) crystals using first-principles and interatomic potential methods.Calculations, using a semiempirical correction of dispersive forces to conventional density functional theory of the equilibrium volume and lattice parameters of COA and COM have shown that the DFT(PBE)-D approach shows substantially better agreement with experiment compared with standard DFT(PBE) results.
The thirteen independent single-crystal elastic stiffness constants Cij of COA and COM have been computed at the PBE-D level from the polynomial fit of the total energy curve as a function of the deformation. We have conducted a detailed analysis of the dependence of values of Cij on the number of energy points (Np) used in the fitting and the order of the polynomial (P), which has shown that, for a fixed order of the polynomial, the values of Cij do not converge with Np. However, consistent values of Cij are obtained by fitting Np energy points with polynomials of order Np-1. It was also found that 5 energy points fitted with a polynomial of 4th order gives the best quality of fitting, without loss of accuracy.
A forcefield for modelling anhydrous and hydrated forms of calcium oxalate has been derived, and the structures of COA and COM computed with this potential are in excellent agreement with PBE-D and experimental results.
The polycrystalline elastic properties, including bulk modulus, shear modulus, Young's modulus, bulk modulus-shear modulus ratio, Poisson's ratio, and elastic anisotropy ratio were also determined based on the calculated elastic constants. The elastic properties computed with the derived IP model are in very good agreement with the values computed at the PBE-D level.
Finally, the interatomic potential model has been applied to compute the energies of dry and hydrated COM surfaces, and determine the morphology of this mineral by applying the Gibbs–Wulff theorem. The simulated morphology of COM is very similar to the one observed experimentally.
References
- V. Tazzoli and C. Domenghetti, Am. Miner., 1980, 65, 327 CAS.
- V. R. Franceschetti and P. A. Nakata, Annu. Rev. Plant Biol., 2005, 56, 41 Search PubMed.
- O. Hochrein, A. Thomas and R. Kniep, Z. Anorg. Allg. Chem., 2008, 634, 1826 CAS.
- E. J. Baran and P. V. Monje, ‘Oxalate Biominerals’ in Metal Ions in Life Sciences, ed. A. Sigel, H. Sigel and R. K. O. Sigel, Wiley, 4th edition, vol. 4 2008, ch. 7 Search PubMed.
- H. J. Schneider, in Urolitiasis Ethiology, Diagnosis, Springer-Verlag, Berlin, 1985 Search PubMed.
- Y. Ishii and K. Takiyama, J. Electron Microsc., 1989, 38, 423 CAS.
- W. C. Graustein, K. Cromack and P. Sollins, Science, 1977, 198, 1252 CAS.
- T. Echigo, M. Kimata, A. Kyono, M. Shimizu and T. Hatta, Mineral. Mag., 2005, 69, 77 CAS.
- W. M. M. Heijnen, J. Cryst. Growth, 1982, 57, 216 CAS.
- W. M. M. Heijnen and F. B. van Duijneveldt, J. Cryst. Growth, 1982, 67, 324 Search PubMed.
- A. Millan, Cryst. Growth Des., 2000, 1, 245 Search PubMed.
- S. R. Qiu, A. Wierzbicki, C. A. Orme, A. M. Cody, J.R. Hoyer, G. H. Nancollas, S. Zepeda and J. J. De Yoreo, Proc. Natl. Acad. Sci. U. S. A., 2004, 101, 1811 CAS.
- M. J. Hounslow, H. S. Mumtaz, A. P. Collier, J. P. Barrick and A. S. Bramley, Chem. Eng. Sci., 2001, 56, 2543 CAS.
- S. Peroos, Z. Du and N. H. de Leeuw, Biomaterials, 2006, 27, 2150 CAS.
- A. Pedone, M. Corno, B. Civalleri, G. Malavasi, M. Menziani, U. Segre and P. Ugliengo, J. Mater. Chem., 2007, 17, 2061 CAS.
- J. A. L. Rabone and N. H. de Leeuw, J. Comput. Chem., 2005, 27, 253 Search PubMed.
- R. Hocart, N. Gérard and G. Watelle-Marion, C. R. Acad. Sci., 1965, 260, 2509 CAS.
- P. Giannozzi, S. Baroni, N. Bonini, M. Calandra, R. Car, C. Cavazzoni, D. Ceresoli, G. L. Chiarotti, M. Cococcioni, I. Dabo, A. Dal Corso, S. Fabris, G. Fratesi, S. de Gironcoli, R. Gebauer, U. Gerstmann, C. Gougoussis, A. Kokalj, M. Lazzeri, L. Martin-Samos, N. Marzari, F. Mauri, R. Mazzarello, S. Paolini, A. Pasquarello, L. Paulatto, C. Sbraccia, S. Scandolo, G. Sclauzero, A. P. Seitsonen, A. Smogunov, P. Umari and R. M. Wentzcovitch, J. Phys.: Condens. Matter, 21, 395502 Search PubMed.
- J. P. Perdew, K. Burke and M. Ernzerhof, Phys. Rev. Lett., 1996, 77, 3865 CAS.
- S. Grimme, J. Comput. Chem., 2006, 27, 1787 CAS.
- V. Barone, M. Casarin, D. Forrer, M. Pavone, M. Sambi and A. Vittadini, J. Comput. Chem., 2009, 30, 934 CAS.
- D. Vanderbilt, Phys. Rev. B, 1990, 41, 7892 Search PubMed.
- D. Vanderbilt, Vanderbilt Ultra-Soft Pseudopotential Site Search PubMed http://www.physics.rutgers.edu/ .
- A. Tilocca and N. H. de Leeuw, J. Mater. Chem., 2006, 16, 1950 CAS.
- D. Di Tommaso and N. H de Leeuw, J. Phys. Chem. B, 2008, 112, 6965 CAS.
- D. C. Wallace, Thermodynamics of crystals, Wiley, New York, 1972 Search PubMed.
- N. T. S. Lee, V. B. C. Tan and K. M. Lim, Appl. Phys. Lett., 2008, 88, 31913 Search PubMed.
- W. F. Perger, J. Cryswell, B. Civalleri and R. Dovesi, Comput. Phys. Commun., 2009, 180, 1753 CAS.
- J. D. Gale and A. L. Rohl, Mol. Simul., 2003, 29, 291 CAS.
- G. W. Watson, E. T. Kelsey, N. H. de Leeuw, D. J. Harris and S. C. Parker, J. Chem. Soc., Faraday Trans., 1996, 92, 433 CAS.
- G. W. Watson, P. M. Oliver and S. C. Parker, Phys. Chem. Miner., 1997, 25, 70 CAS.
- G. W. Watson, E. T. Kelsey and S. C. Parker, Philos. Mag. A, 1999, 79, 527 CAS.
- A. Pavese, M. Catti, S. C. Parker and A. Wall, Phys. Chem. Miner., 1995, 23, 89 Search PubMed.
- N. H. de Leeuw and S. C. Parker, Phys. Rev. B: Condens. Matter, 1998, 58, 13901–13908 CAS.
- S. D. Fleming, G. M. Parkinson and A. L. Rohl, J. Cryst. Growth, 1997, 178, 402 CAS.
- N. H. de Leeuw, S. C. Parker and J. H. Harding, Phys. Rev. B, 1999, 60, 13792 CAS.
- N. H. de Leeuw and S. C. Parker, J. Phys. Chem. B, 1998, 102, 2914 CAS.
- N. H. de Leeuw and S. C. Parker, Mol. Simul., 2000, 24, 71 CAS.
- D. Mkhonto and N. H. de Leeuw, J. Mater. Chem., 2002, 12, 2633 CAS.
- P. W. Tasker, Philos. Mag. A, 1979, 39, 119 CAS.
- G. Z. Wulff, Kristallogr Kristallgeom, 1901, 34 Search PubMed.
- J. W. Gibbs, Collected Works, Longman, New York, 1928 Search PubMed.
- K. B. Panda and K. S. Ravi Chandran, Acta Mater., 2006, 54, 1641 CAS.
- D. Connétable and O. Thomas, Phys. Rev. B., 2009, 79, 94101 Search PubMed.
- F. Deganello, Acta Crystallogr., Sect. B: Struct. Crystallogr. Cryst. Chem., 1981, 37, 826 Search PubMed.
- D. J. Sutor, ‘The nature of urinary stones’ in Urolithiasis: Physical Aspects., ed. B. Finlayson, L. L. Hence and L. H. Smith, Washington, DC, National Academy of Sciences, 1972, pp. 43–63. Search PubMed.
- R. Hill, Proc. Phys. Soc., London, Sect. A, 1951, 65, 349 Search PubMed.
- W. Koster and H. Franz, Int. Mater. Rev., 1961, 6, 1 CAS.
- S. F. Pugh, Philos. Mag., 1954, 54, 823 Search PubMed.
- C. J. Chuong, P. Zhong and G. M. Preminger, J. Endourol., 1993, 7, 437 CAS.
- M. Daudon, D. Bazin, G. André, P. Jungers, A. Cousson, P. Chevallier, E. Véron and G. Matzen, J. Appl. Crystallogr., 2009, 42, 109 CAS.
Footnote |
| † Electronic Supplementary Information (ESI) available: Table SI.1 and SI.2. See DOI: 10.1039/c2ra00832g/ |
| This journal is © The Royal Society of Chemistry 2012 |
