Pareto-optimal transparent conductive oxides†
Redouane
Miloua
*,
Zoubir
Kebbab
and
Noureddine
Benramdane
Laboratoire d'Elaboration et Caractérisation des Matériaux, P.O. BOX 89, Faculty of Engineering Sciences, Djillali Liabes University of Sidi Bel-Abbes, 22000, Algeria. E-mail: mr_lecm@yahoo.fr; Tel: +213 550 716 156
First published on 2nd March 2012
Abstract
The development of optically transparent, electrically conductive oxides (TCOs) is relevant to a broad range of optoelectronic applications. The design of new TCOs and the optimization of existing ones require powerful modeling tools and algorithms that would be able to handle the multi-objective nature of the problem. Here we present a new approach that merges TCO physics to multi-objective evolutionary optimization algorithms. In contrast to conventional figure-of-merit relations, our approach discards any weighting-induced bias and hence provides accurate information on the material's performance. Moreover, it allows identifying optimization guidelines for many TCO structures. We show that once we envisage a device application (e.g. thin film solar cells) the analysis of the calculated Pareto-optimal set by data clustering techniques yields essential information on performance enhancement. Our approach opens the way towards multicriteria design of optoelectronic materials and devices.
TCOs constitute an essential part in many optoelectronic applications including flat-panel displays, photovoltaic modules and heat-reflecting coatings on architectural windows. They have to exhibit good electrical and optical characteristics, i.e. high conductivity and high transmittance in the visible range. The most popular TCOs are SnO2, ITO, CdO, ZnO and Ga2O3, including also multi-component oxides such as indium–gallium–zinc oxide and cubic spinel compounds.1 Among all of the TCOs, the question of choosing the best one does not have a unique answer but strongly depends on the specific application envisaged.2 Usually, performance evaluation depends on a figure of merit (FOM) that takes into account both characteristics of the materials. As a simplifying measure, we usually take the ratio of the electrical conductivity to the optical absorption coefficient of the film. However, this definition imposes (physically) unjustified weighting on individual material's properties and hence induces information bias on performance evaluation.3,4 The discovery of new TCO materials and the improvement of the existing ones can be realized using a combinatorial exploration process including thin film deposition, characterization and data analysis. Unfortunately, such a method is complex and time-consuming.5 Thus, the ability to design in silico the TCO materials and predict their performance prior to processing would be particularly useful.
The present approach merges the physics of TCO materials to a concept from economic theory (i.e. the Pareto-optimal set) and thus provides a graphical representation of the performance that is tremendously informative, yet unbiased. The method would ensure broad applicability to diverse transparent conductors. We first outline the general framework where we construct the TCO model. Then we introduce the evolutionary optimization algorithm and show its application to determine the Pareto optimal set, and finally we demonstrate the effectiveness of the approach in investigating different TCO structures.
The improvement of the optical–electrical characteristics of TCOs needs a profound understanding of the factors limiting both transparency and electron mobility. The transmittance is limited by the reflection losses at the optical interfaces and the residual absorption due to free carrier and materials defects. In the infrared range, the Drude model explains correctly the optical properties which are mostly influenced by free carrier absorption or reflection. Further, the bandgap absorption in the visible wavelengths is usually described by an adequate dispersion model (Lorentz, Cauchy, Forouhi–Bloomer, etc.). Thus the optical response in the whole visible–IR spectral range could be obtained by using the Drude model in combination with the dispersion formula of undoped TCOs.6 In multilayer systems, light propagation can be treated elegantly by the so called scattering matrix method.7 The overall reflection and transmittance spectra are represented by a scattering matrix that can be expressed as the product of interface and layer matrices, which describe the effects of the individual interfaces and layers constituting the whole system. In addition, simple treatment of light scattering from rough surfaces and interfaces can be realized in the framework of the scalar scattering theory.8
Although light propagation theory in multilayer coatings was established many decades ago, the transport phenomena in TCO materials are still a matter of investigation. The polycrystalline nature of the materials strongly influences the electron transport in such a way that for undoped films the mobility is mainly limited by grain boundary scattering whereas for doped layers the intragrain scattering mechanism is predominant. Several investigations of the electron mobility have been carried out based on Seto's model9 wherein a depletion layer exists at the grain boundaries.10,11 In contrast to the other TCO materials, CdO is the “exception to the rule”. It has a relatively low bandgap, high bulk mobility and exhibits surface electron accumulation. This implies that the electron accumulation is expected to take place at dislocations and grain boundaries, and hence the commonly used Seto's model becomes no more applicable to CdO.12
In the present work we develop a numerical model by taking into account all the aforementioned aspects in such a way that it permits the calculation of the average transmittance and reflectance in the visible range, as well as the sheet resistance of the considered mono/multilayer structures (see Fig. 1). For each structure's layer, the model has five independent input parameters, i.e. carrier concentration (N), thickness of the film (d), roughness at the interface (s), grain size (L) and the mean free path of electrons (![[small script l]](https://www.rsc.org/images/entities/i_char_e146.gif) ). These parameters lie in a priori fixed design domain which is taken to be the same for all TCO materials in order to allow a proper comparison between them (further details are given in the ESI†). Moreover, the model has been merged to an efficient stochastic exploratory technique to look for the best possible solutions which minimize both the optical loss and the sheet resistance, in the framework of the Pareto optimality. Normally-incident light with wavelength ranging from 400 to 700 nm is assumed. We define the optical loss as the fraction of light being absorbed, reflected or scattered, i.e. one minus the averaged transmittance in the considered wavelength range.
). These parameters lie in a priori fixed design domain which is taken to be the same for all TCO materials in order to allow a proper comparison between them (further details are given in the ESI†). Moreover, the model has been merged to an efficient stochastic exploratory technique to look for the best possible solutions which minimize both the optical loss and the sheet resistance, in the framework of the Pareto optimality. Normally-incident light with wavelength ranging from 400 to 700 nm is assumed. We define the optical loss as the fraction of light being absorbed, reflected or scattered, i.e. one minus the averaged transmittance in the considered wavelength range.
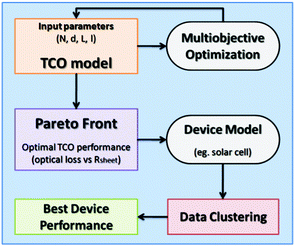 | ||
| Fig. 1 Flowchart of the proposed optimal design approach. | ||
In a multiobjective optimization problem (MOP), several possibly contradicting objectives have to be optimized simultaneously, yielding not a single optimal solution but rather a whole set of possible solutions of equivalent quality. MOP could be written in the form: minimize [f1(x),f2(x),…,fk(x)] for k objective functions (or criteria) fi: Rn → R subject to several equality and inequality constrains. The optimization task consists of the determination of all vectors which satisfy all the constraints and also yield the optimum values for all the objective functions. The notion of optimality used here was proposed by the neoclassical economist Vilfredo Pareto at the beginning of the past century.13 A vector x* is Pareto optimal if there exist no feasible vector x satisfying the whole constraints, which would decrease some objective without causing a simultaneous increase in at least one other objective. x* is said to be a non-dominated solution, the resulting set of non-dominated solutions is called the Pareto-optimal set and its plot is named the Pareto front. (Further explanations are reported in the ESI†).
We considered three types of structures: TCOs on glass substrate, TCO/TCO bilayers and Ag layer embedded in TCO (denoted Ag@TCO); the considered TCO materials are CdO, ZnO, In2O3 and SnO2. For each structure we determined the Pareto-optimal set using the Non-dominated Sorting Genetic Algorithm II (NSGA-II), as proposed by Deb et al.14–16 This evolutionary algorithm enables finding several members of the Pareto-optimal set in a single run instead of performing a series of separate runs, which is the case for some of the conventional stochastic processes. All calculations have been performed on an Intel Pentium Dual-Core laptop using MATLAB software.
Fig. 2 depicts the calculated Pareto fronts for basic TCO compounds. We notice that In2O3 shows the best compromise of electrical–optical performance due to its good intrinsic optical and transport properties whereas SnO2 and ZnO exhibit a similar trend. For high sheet resistance values, the three materials exhibit equal optical loss no less than 10%. In contrast, although CdO has better electrical characteristics, the optical loss remains superior to 40%, certainly due to the relatively lower bandgap energy and hence to a higher optical absorption. It would be worthwhile to notice that the featured trends are strongly dependent on the chosen design domain. In Fig. 3 we show the effect of adding a thin Ag layer (5∼50 nm) into the TCO structures. It appears that including a Ag layer in both SnO2 and ZnO enhances significantly their optical–electrical performance whereas only the electrical characteristics of In2O3 are improved. Moreover, Ag@CdO exhibits an important decreasing of the optical performance. As shown in Fig. 4, CdO-based bilayer structures exhibit enhancement of the electrical performance which finds its origin in the good intrinsic electrical characteristics of CdO. Unfortunately this is accompanied with dramatic increasing of the optical loss resulting from the weak transparency of CdO. In2O3/SnO2 and In2O3/ZnO structures have the same optical performance as In2O3 with slightly enhanced electrical performance. SnO2/ZnO is an interesting structure since it reaches optical and electrical enhancement at the same time.
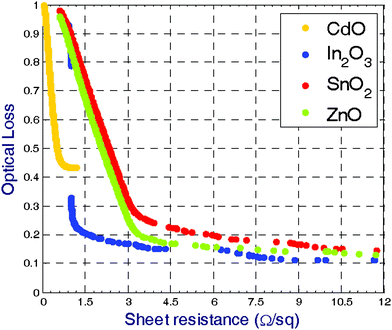 | ||
| Fig. 2 The calculated Pareto fronts for basic TCO compounds. The Pareto front represents the best performance that a TCO can achieve in terms of sheet resistance and optical loss. Among all TCOs, In2O3 exhibits the best compromise between electrical and optical responses. | ||
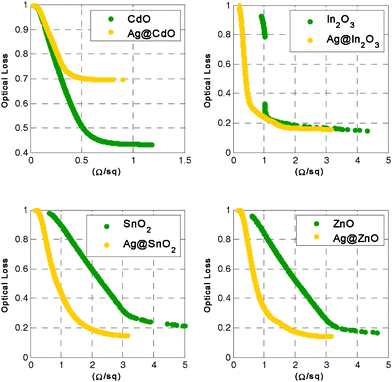 | ||
| Fig. 3 Comparative plots of TCOs and Ag@TCOs best performances (Pareto fronts). Embedding thin Ag layers yields severe decrease in the optical response of CdO and slight enhancement of the electrical performance of In2O3. In contrast, the performances of SnO2 and ZnO are significantly improved. | ||
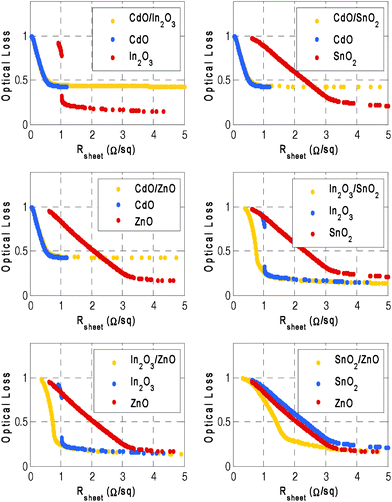 | ||
| Fig. 4 Performance estimation of TCO/TCO systems. The presence of CdO in the bilayer structures drastically reduces their optical response and enhances the electrical performance. In2O3/SnO2 and In2O3/ZnO structures exhibit slight enhancement of the electrical performance with no amelioration of the optical response. The SnO2/ZnO structure is the most interesting since it surpasses the constituents SnO2 and ZnO. This could be achieved by an adequate shifting mechanism of the variable distributions as explained elsewhere. | ||
To allow the identification of optimization strategies for each structure, an extensive investigation employing statistical analysis of the Pareto optimal sets has been performed. The estimation of both linear and non-linear correlation coefficients for each variable versus the objectives yields the determination of the most influential parameters as well as their dependency nature i.e. direct or inverse proportionality. The performance optimization depends merely on the intrinsic TCO variable distributions which can be analyzed in terms of their dispersion. In the case of Ag@ZnO, L and ![[small script l]](https://www.rsc.org/images/entities/i_char_e146.gif) distributions are broadened over a larger interval whereas carrier concentrations are shifted to smaller values which result in the enhancement of electrical and optical performances at the same time. The same behavior is observed for Ag@SnO2. Despite the broadening of
distributions are broadened over a larger interval whereas carrier concentrations are shifted to smaller values which result in the enhancement of electrical and optical performances at the same time. The same behavior is observed for Ag@SnO2. Despite the broadening of ![[small script l]](https://www.rsc.org/images/entities/i_char_e146.gif) distribution in Ag@In2O3, we assigned the electrical enhancement to the shift of thickness distribution towards higher values, yielding at the same time a detrimental impact on the optical performance. For Ag@CdO all the variables remain unchanged; since Ag is opaque the optical properties of the Ag@CdO are strongly affected (see Fig. S1–S4 in the ESI†).
distribution in Ag@In2O3, we assigned the electrical enhancement to the shift of thickness distribution towards higher values, yielding at the same time a detrimental impact on the optical performance. For Ag@CdO all the variables remain unchanged; since Ag is opaque the optical properties of the Ag@CdO are strongly affected (see Fig. S1–S4 in the ESI†).
For most of the TCO/TCO structures similar remarks can be obtained. Focusing on SnO2/ZnO, the interface roughness plays a crucial role in enhancing the transmittance of the bilayer system by scattering efficiently the light into ZnO and so diminishing multiple reflection losses. Additionally, broadening of L and ![[small script l]](https://www.rsc.org/images/entities/i_char_e146.gif) in ZnO and narrowing of N in SnO2 contribute significantly to the optical–electrical enhancement (Fig. S5 in the ESI†). In order to validate the present approach we made a comparison to some experimental works.
in ZnO and narrowing of N in SnO2 contribute significantly to the optical–electrical enhancement (Fig. S5 in the ESI†). In order to validate the present approach we made a comparison to some experimental works.
Having constructed the TCO model and exploring its best performance for different multilayer systems, it is now possible to specify an application and evaluate the best achieved performance of the optimized structures. If we envisage a photovoltaic device application, it would seem wise to make a simple estimation of the maximum achievable short-circuit current and conversion efficiency by assuming total absorption and conversion of the transmitted fraction of light through the structures. As shown in Fig. 5a the most interesting structures are those based on In2O3, SnO2 and ZnO compounds as a direct consequence of their good optoelectronic properties. Then, to be of interest to real applications it is essential to extract and use optimal parameter ranges from the Pareto optimal set. We demonstrate that this is possible using a data mining technique which consists to reduce the Pareto front to a set of k clusters. Each cluster contains solutions with similar properties and therefore we only have to characterize the cluster that contains the best achieved conversion efficiency. We used an unsupervised approach based on the k-means algorithm introduced by Cox17 which makes grouping of solutions by calculating the centroid of each cluster and assigning each solution to the group with the closest centroid. We used the silhouette plot to find the optimal number of clusters k that yields the highest average silhouette width. In Fig. 5b we display the silhouette plot corresponding to the Ag@In2O3 structure. Statistical analysis of the clusters shows that cluster #2 is the most interesting among all the others, i.e. it has the highest mean conversion efficiency and the lowest standard deviation (19.86% and 0.094, respectively). At the end, valuable guidelines to conversion-efficiency enhancement are obtained by identifying for each variable the corresponding optimal design domain. Further validation of the approach has been undertaken on In2O3/SnO2 and In2O3/ZnO systems. By comparing to experiments, we found that the method is able to predict important mechanisms, responsible for the improvement of In2O3/ZnO. For In2O3/SnO2 the optimized thicknesses were in excellent agreement with the experimental measures (see ESI†, last section).
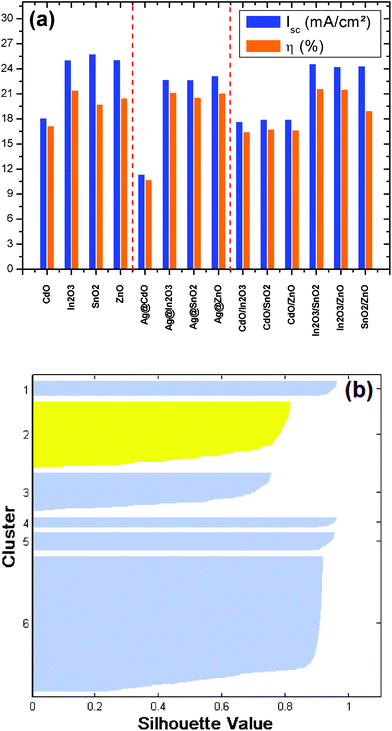 | ||
| Fig. 5 Photovoltaic performance and data clustering. (a) Highest short-circuit currents and conversion efficiencies calculated from the Pareto-optimal set of each structure. We assumed complete absorption and conversion of the transmitted light within the TCOs to the absorber. The bandgap of the absorber is taken to be 1.5 eV. In this case, the Shockley–Queisser limit is 28.98 mA cm−2 and 28.33% for the photocurrent and the conversion efficiency, respectively. (b) The silhouette plot obtained from cluster analysis of the Pareto-optimal set of Ag@In2O3. The k-means algorithm yields 6 independent clusters where cluster #2 gives the best conversion efficiency values. | ||
Summarizing, we proposed to merge fundamental TCO physics with a multi-objective evolutionary optimization method to provide a correct and useful approach to optimize TCO materials and structures. Judging TCOs on the basis of their optimal performance seems to be a promising approach. Indeed, statistical analysis of the Pareto-optimal sets led to the identification of valuable optimization principles. Once we specify an application of the structures, it is possible to determine the best design domains that maximize the performance of the device using a data clustering technique. The approach, moreover, is generally applicable to a broad range of materials and devices including ultrathin,18 nanopatterned19 transparent electrodes and plasmonic structures.20 It would be straightforward to extend the study by taking into account other criteria such as the minimization of optical reflection.21 Since the multi-objective optimization results in a population of solutions, it would be of interest to choose among those which satisfy additional technological requirements such as low production cost and little environmental impact.
Acknowledgements
We thank S. K. Vasheghani Farahani from the University of Warwick, UK, S. Tanemura from the Japan Fine Ceramics Centre (JFCC), Japan, and M. Z. Slimani from Donostia International Physics Center, San Sebastián, Spain, for discussions and providing documentation.References
- D. S. Ginley, H. Hosono and D. C. Paine, Handbook of Transparent Conductors, Springer, New York, 2010 Search PubMed.
- R. G. Gordon, MRS Bull., 2000, 25, 52 CAS.
- G. Haacke, J. Appl. Phys., 1976, 47, 4086 CrossRef CAS.
- Á. Pekker and K. Kamarás, J. Appl. Phys., 2010, 108, 054318 Search PubMed.
- J. D. Perkins et al., 31st IEEE PVSC, 2005, Lake Buena Vista, Florida, p. 145 Search PubMed.
- F. Lai, Thin Solid Films, 2007, 515, 7387 Search PubMed.
- J. Singh, Optical properties of condensed matter and applications, John Wiley & Sons Ltd, England, 2006 Search PubMed.
- C. K. Carniglia, Opt. Eng., 1979, 18, 104 Search PubMed.
- J. Y. Seto, J. Appl. Phys., 1975, 46, 5247 CrossRef CAS.
- J. Steinhauser, Appl. Phys. Lett., 2007, 90, 142107 Search PubMed.
- K. Ellmer, A. Klein and B. Rech, Transparent conductive zinc oxide, basics and applications in thin film solar cells, Springer, Berlin, 2008 Search PubMed.
- S. K. Vasheghani Farahani, J. Appl. Phys., 2011, 109, 073712 Search PubMed.
- V. Pareto, Manuale di Economia Politica, Societa Editrice Libraria, Milano, 1906. Translated to English as: Manual of Political Economy, Macmillan, New York, 1971 Search PubMed.
- K. Deb, IEEE Trans. Evol. Comput., 2002, 6, 182 CrossRef.
- N. Srinivas and K. Deb, Evol. Comput., 1994, 2, 221.
- K. Deb and A. Kumar, Complex Syst., 1995, 9, 431 Search PubMed.
- D. Cox, J. Am. Stat. Assoc., 1957, 52, 543 Search PubMed.
- D. S. Ghosh, Opt. Lett., 2009, 34, 325 Search PubMed.
- P. Catrysse and S. Fan, Nano Lett., 2010, 10, 2944 Search PubMed.
- H. A. Atwater and A. Polman, Nat. Mater., 2010, 9, 205 CrossRef CAS.
- J. N. Munday and H. A. Atwater, Nano Lett., 2011, 11, 2195 Search PubMed.
Footnote |
| † Electronic supplementary information (ESI) available. See DOI: 10.1039/c2ra01094a |
| This journal is © The Royal Society of Chemistry 2012 |
