Synthesis and structural characterization of novel visible photocatalyst Bi–TiO2/SBA-15 and its photocatalytic performance†
Jing
Ma
*ab,
Jia
Chu
*b,
Liangsheng
Qiang
b and
Juanqin
Xue
a
aSchool of Metallurgical Engineering, Xi'an University of Architecture and Technology, Xi'an, 710055, China. E-mail: mjhit@yahoo.cn
bDepartment of Chemistry, Harbin Institute of Technology, Harbin, 150001, China. E-mail: chujiahit@yahoo.cn
First published on 7th March 2012
Abstract
Bi-doped TiO2/SBA-15 (Bi–TiO2/SBA-15) was synthesized by a wet impregnation method. It was found that SBA-15 retained its ordered hexagonal mesostructure after incorporation of TiO2 and Bi. TiO2 nanoparticles and Bi species dispersed well and anchored both in the channel and the wall of SBA-15. The photocatalytic activity was evaluated on photodegradation of Rhodamine B (RhB) under visible light irradiation (λ ≥ 420 nm). Experimental results indicated that Bi–TiO2/SBA-15 exhibited higher photocatalytic activities than pure TiO2 and TiO2/SBA-15 owing to the synergetic effects of Bi species and TiO2. The degradation of RhB by these catalysts follows the pseudo-first-order kinetic model and Bi–TiO2/SBA-15 (2.0%) was found to be the best. The effect of Bi doping on the photocatalytic activity was investigated by the density functional theory (DFT) method. The calculated results indicated that Bi doping could improve the photocatalytic activity by extending the spectral response from UV to the visible region, making the Bi–TiO2/SBA-15 active under visible light irradiation.
Introduction
The photocatalytic properties of TiO2 have been exploited in various applications since Fujishima and Honda reported a TiO2 photochemical electrode for splitting water in 1972.1 TiO2 has attracted considerable interest in photocatalytic applications with a bandgap of ∼3.2 eV at room temperature; it is also widely used for optoelectronic materials, data storage and solar conversion.2 The application of TiO2 in UV-light photocatalysis has immersed importance because of its high chemical/photocorrosion stability. However, a major obstacle towards the practical application is the need of UV light for activating the photocatalysts. This factor can be minimized by doping of semiconductors, such as WO3, MoO3, Fe2O3, SnO2, Bi2O3 and CdS, which could change the electronic properties of TiO2.3–5 Among them, Bi2O3 exhibits good charge carrier mobility with a direct band gap of 2.8 eV. Furthermore, Bi species with lone electron pair formed Bi–O polyhedra can act as electron trapping centres and hinder electron–hole pair recombination. Therefore, the Bi2O3–TiO2 composite shows spectral response in the visible region owing to the fast charge carrier mobility.6,7 Recently, there are several works on the photocatalytic properties of Bi-doped TiO2 materials under visible light irradiation.8–15 Bian et al.16 reported an active Bi2O3/TiO2 visible photocatalyst with an ordered mesoporous structure and highly crystallized anatase. Wang et al.17 reported the preparation of bismuth- and sulfur-codoped TiO2 by a simple sol–gel method. Rengaraj and co-workers18 synthesized a Bi3+-doped TiO2 nanocatalyst. According to their results, the presence of Bi species in TiO2 catalysts substantially enhanced the photocatalytic degradation of methyl parathion under UV irradiation. Xie et al.14 reported the preparation of highly monodisperse spherical Bi-doped TiO2. Their hybrid showed enhanced photocatalytic activity under visible light. Jing's group19 prepared Bi2O3 surface-modified TiO2 nanoparticles by sol-hydrothermal process of Ti(OBu)4, followed by post-treatment with an appropriate amount of bismuth nitrate solution. Wu et al.20 investigated the influence of Bi doping on TiO2 photocatalysts for hydrogen evolution and photodegradation of RhB. Shamaila et al.21 demonstrated an approach for the preparation of a mesoporous nanocrystalline TiO2 based on an EISA method. The catalyst showed superior activity compared to M–TiO2, Degussa P25 and impregnated Degussa P25 for the photodegradation of MO and 2,4-DCP.Generally, the adsorption ability of the TiO2 is relatively small, which results in poor photocatalytic activity. Therefore, enhancing the adsorption ability of the catalysts may be an efficient way to improve the photocatalytic activity. A number of materials have been explored to support TiO2, such as zeolite,22,23 mesoporous silica24 and carbon materials.25 Among them, SBA-15 is a mesoporous silica sieve with uniform hexagonal pores and high surface area, which render it a good host material for photocatalysis reactions. Design of well-defined mesoporous structure materials, such as SBA-15 modified by TiO2, is a promising way to achieve high photocatalytic activity since the ordered mesopore channels facilitate fast intraparticle molecular transfer.26–31 Zhang et al.26 reported the preparation of TiO2/SBA-15 by an acidolysis reaction. The hybrid exhibited an improved UV photocatalytic performance of degradation RhB. Recently, Acosta-Silva et al.32 successfully developed TiO2/SBA-15 photocatalyst, which exhibited a higher photocatalytic activity on the photodegradation of MB than pure anatase TiO2. However, no studies have attempted to establish a system consisting of a Bi2O3–TiO2 hybrid incorporated into mesoporous silica.
Herein, we report the synthesis of Bi–TiO2/SBA-15 by wet impregnation method. The samples obtained are designated as Bi–TiO2/SBA-15. The product presents two significant features in this work: (1) it may represent a new route to improve the photocatalytic activity by depositing Bi and TiO2 on a host material, which generate a large number of active sites. (2) The as-synthesized Bi–TiO2/SBA-15 extends the spectra response from UV to the visible region, which enables the photocatalyst to be used for wastewater treatment under visible light irradiation. We expect that such a method could also be extended to prepare other photocatalysts.
Experimental
Materials
Pluronic P123 (Mw = 5800, HO(CH2CH2O)20–(CH2CHCH3O)70 (CH2CH2O)20H, EO20PO70EO20, abbreviated as P123) was purchased from Sigma-Aldrich Co., Ltd., USA. Tetrabutyl titanate (TBT, (C4H9O)4Ti) and bismuth nitrate (Bi(NO3)3·5H2O) were obtained from Shanghai Aladdin Co., Ltd., China, which were used as a precursor of TiO2 and bismuth source. Rhodamine B (RhB) used as a photodegradable agent was supplied from Shanghai Jingchun Chemical Reagent Co. Ltd., China. Doubly distilled water was used for all synthesis and treatment processes. Other chemicals were analytical grade and used without further purification.Synthesis of SBA-15
The SBA-15 matrix was prepared following the procedure reported earlier.33,34 P123 was used as a structure directing agent. In a typical process, 2 g of P123 were added to 75 ml of aqueous HCl under stirring at 40 °C for 2 h. 4.17 ml of TEOS were then added to the solution, which was stirred for another 24 h. The suspension was transferred into a Teflon-lined steel autoclave and kept at 100 °C for 72 h. After cooling to room temperature, the precipitate in the bottom of Teflon vessel was collected, filtered, thoroughly washed with water to remove any unreacted chemicals and dried at room temperature. Calcinations were performed by heating in air at 550 °C for 6 h to remove the template.Synthesis of TiO2/SBA-15
TiO2/SBA-15 materials were prepared according to our previous reported method with little modification.35 In this case, the calculated amount of tetrabutyl titanate (TBT) was dissolved in ethanol in a volume ratio of 1![[thin space (1/6-em)]](https://www.rsc.org/images/entities/char_2009.gif) :
:![[thin space (1/6-em)]](https://www.rsc.org/images/entities/char_2009.gif) 5. 0.5 g SBA-15 were then added to the solution containing different amount of TBT and stirred for 1 h to make the TBT adsorb completely on the SBA-15. The condensation reaction was started by dropwise addition of water and then, the stirring was continued for 2 h to hydrolyze TBT completely. The solid product was recovered by filtration, washed with ethanol to remove any unanchored titanium species, dried 80 °C overnight and calcined in air at 550 °C for 3 h. The calcined samples were designated as TiO2/SBA-15. TiO2/SBA-15 was prepared using above method and used for comparison.
5. 0.5 g SBA-15 were then added to the solution containing different amount of TBT and stirred for 1 h to make the TBT adsorb completely on the SBA-15. The condensation reaction was started by dropwise addition of water and then, the stirring was continued for 2 h to hydrolyze TBT completely. The solid product was recovered by filtration, washed with ethanol to remove any unanchored titanium species, dried 80 °C overnight and calcined in air at 550 °C for 3 h. The calcined samples were designated as TiO2/SBA-15. TiO2/SBA-15 was prepared using above method and used for comparison.
Synthesis of Bi–TiO2/SBA-15
For Bi-doping TiO2/SBA-15 supports, samples containing Bi were prepared by a wet impregnation method. TiO2/SBA-15 and Bi(NO3)3·5H2O in different molar ratios were mixed in an ethanol solution with a drop of nitric acid and stirred for 5 h. The resulting suspension was dried and calcined in air at 550 °C. The samples were designated as Bi–TiO2/SBA-15(x%), where x% refers to the Bi/Ti molar ratio.Characterization
Small-angle X-ray diffraction (SAXRD) measurements were performed on a Siemens D5005 instrument with Cu-Kα (λ = 0.154 nm) radiation. The diffractograms were recorded in the 2θ range of 0.5–5° with a 2θ step size of 0.01° and a step time of 10 s. Wide-angle X-ray diffraction (WAXRD) measurements were carried out on an XRD-6000 X-ray diffractometer (Shimadzu) Cu-Kα (λ = 0.154 nm) radiation. The diffractograms were recorded in the 2θ range of 10–80° with a 2θ step size of 0.2°. Raman spectra were measured with a JOBIN YVON HR800 Raman spectrophotometer (France) in the range of 100–1400 cm−1, using an Ar ion laser beam and an excitation wave length of 457.9 nm. N2 adsorption/desorption isotherms were measured at 77 K in a Quantachrome Autosorb-1 sorption analyzer. Samples were outgassed at 300 °C for 10 h before the measurement. The Brunauer–Emmett–Teller (BET) method was used to calculate the surface area. The pore size distributions were calculated with the DFT Plus software (Micromeritics), applying the Barrett–Joyner–Halenda (BJH) model with cylindrical geometry of the pores. TEM and HRTEM were performed by a FEI Tecnai G2 S-Twin electron microscope with an acceleration voltage of 200 kV. UV–vis absorption spectra scans were performed on a Shimadzu UV-2550 spectrometer in the range from 300–700 nm. BaSO4 was used as a reflectance standard material during the experiment. XPS was obtained using a physical electronics model PHI5700 X-ray photoelectron spectrometer with Mg-Kα X-rays as the excitation source. Photoluminescence (PL) spectra were performed on JASCO FP-6500 fluorescence spectrometer.Calculation of band structure
The pure TiO2 and Bi–TiO2 systems were modeled using periodic boundary condition, as shown in Fig. S1.† Anatase TiO2 has a tetragonal structure, which contains two titanium atoms and four oxygen atoms in the unit cell. The anatase TiO2 containing Bi atoms structure was labeled Bi–TiO2 where the titanium atom was substituted for the bismuth atom. The unit cell of TiO2 and Bi–TiO2 was extended in the calculation.DFT calculations were carried out based on the generalized gradient approximation (GGA) of Perdew–Burke–Ernzerhof (PBE) for the exchange–correlation potential. The ultrasoft pseudopotentials were chosen in the calculation. In all calculations, the cut-off energy of the plane-wave basis set is 340 eV for both TiO2 and Bi-doped TiO2. The Monkhorst–Pack scheme k-point grid sampling was set as 3 × 7 × 3 for the Brillouin zone.36 The total energy is considered to be converged when the self-consistent field (SCF) tolerance is 1 × 10⁻⁶ eV atom−1.
Photocatalytic activity measurement
For all samples, the adsorption and photocatalytic activities were investigated for the photodegradation of RhB in aqueous solution under visible light in a photolysis glass reactor. The visible lightsource was a 300 W Xe lamp (λ ≥ 420 nm to provide visible light irradiation) with a double wall jacket in which water was circulated to prevent over heating of the reaction mixture. The visible light irradiated perpendicularly to the surface of the suspension and the distance from the visible light source to the suspension was 10 cm. 50 mg of Bi–TiO2/SBA-15(x%) was added to RhB (100 ml, 1 × 10⁻⁵ M) and stirred for 30 min without visible light irradiation in order to establish an adsorption/desorption equilibrium between RhB and the catalyst. Next, the solution was illuminated by visible light. At a given time interval, 4 ml of the suspension were withdrawn. After centrifugation at 5000 rpm for 5 min, the filtrate was monitored by UV-vis spectrophotometer (UV-5200). The absorbance was measured at 553 nm with water as reference and converted to concentration with Lambert–Beer's law. (Lambert–Beer's Law, A = εbC, where A: absorption, ε: proportion constant, b: light length, C: concentration).Results and discussion
Typical small-angle XRD patterns of calcined Bi–TiO2/SBA-15 samples in the range of 0.5–5° were shown in Fig. 1a. All samples exhibit well-resolved diffraction peak at 2θ = 0.8–0.9° that corresponding to the (100) diffraction peak of the hexagonal features of the SBA-15, indicating that their ordered pore structure are maintained well. The position of the diffraction peak shifted to a higher angle indicates a small decrease of the pore size and unit cell. The diffraction intensity gradually decreased with increasing Bi and TiO2 loading, which can be correlated to a slightly decrease of the mesoporous orders. Yang et al.37 attribute such a decrease in intensity to the TiO2 particles that exist inside the mesopores of the SBA-15 structure.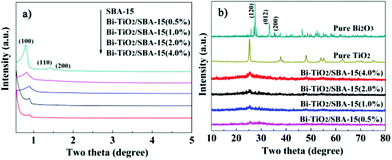 | ||
| Fig. 1 Small-angle a) and wide-angle b) XRD patterns of Bi–TiO2/SBA-15(x%). | ||
Wide-angle XRD patterns of samples (Fig. 1b) show a typical broad diffraction peak centered at 2θ of 25°, which is typically characteristic of amorphous silica. No clear characteristic peaks of crystalline TiO2 and Bi2O3 were observed in XRD patterns of the sample, which indicated that the small nanoparticle size of TiO2 and Bi2O3 were successfully incorporated into the silica framework.21
The hexagonal array of mesopores with Bi and TiO2 are examined by TEM, As shown in Fig. 2. Fig. 2a displays highly ordered hexagonal regular mesopores with an average diameter of ∼7.0 nm, where nanoparticles are embedded in the pore walls with a random orientation. HRTEM image (Fig. 2b) reveals that the materials were well crystallized, as evidenced by well-defined lattice fringes. The lattice fringes at 0.35 nm match the (101) plane of anatase TiO2, while those at 0.325 nm match the (120) plane of Bi2O3 nanoparticles, respectively. The HRTEM analysis confirmed that Bi2O3 and TiO2 coexisted in the resulting samples.
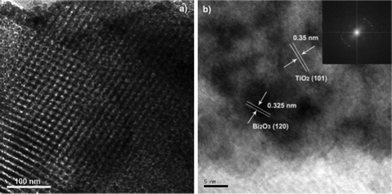 | ||
| Fig. 2 TEM micrographs a) and HRTEM image of Bi–TiO2/SBA-15(2.0%) b) (Inset is the corresponding FFT pattern). | ||
The adsorption–desorption isotherms for Bi–TiO2/SBA-15 are shown in Fig. 3a. The samples exhibit isotherms of typical type IV with a H1 hysteresis loop due to the capillary condensation steps at relative pressure of 0.5 < p/p0 < 0.8, which is characteristic of a mesoporous material.38,39 It can be clearly observed that the amount of N2 adsorption decreases upon Bi2O3 and TiO2 addition. Such a decrease of N2 adsorption for samples is reasonable, considering the formation of Bi2O3 and TiO2 nanoparticles inside the mesopores of SBA-15. The BET specific area and the pore size of the mesoporous SBA-15 and Bi–TiO2/SBA-15(x%) are summarized in Table 1. The specific surface area, pore size and volume decrease with an increase in Bi content, in comparison to those of pure SBA-15. Based on these observations, the decrease might be due to the location of the Bi2O3 and TiO2 content inside the SBA-15. Total pore volume and BET surface area of SBA-15 was decreased after the deposition of Bi2O3 and TiO2. When the Bi loading is low, the Bi2O3 nanoparticles are located inside the mesopores of SBA-15. It seems that the mesoporous channels of SBA-15 controlled the size of Bi2O3 particles to a certain extent. When the Bi loading is high, Bi2O3 nanoparticles are located inside, closing the pore. Therefore, the presence of Bi2O3 clusters will obstruct the pores of the SBA-15, resulting in low pore volumes. This trend is in good agreement with previous observations about TiO2/SBA-15.40–44
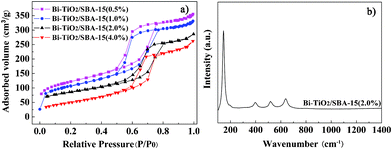 | ||
| Fig. 3 N2 adsorption–desorption isotherms a) and Raman spectra of Bi–TiO2/SBA-15 b). | ||
| Samples | Bi/Tia | BET area (m2 g−1) | V tot b (cm3 g−1) | D c(nm) |
|---|---|---|---|---|
| a Bi/Ti was measured by ICP. b V tot: the total pore volume. c D: Average pore diameter. | ||||
| SBA-15 | 0 | 590.3 | 0.961 | 7.224 |
| Bi–TiO2/SBA-15(0.5%) | 0.48% | 555.6 | 0.540 | 6.068 |
| Bi–TiO2/SBA-15(1.0%) | 1.05% | 542.8 | 0.529 | 5.973 |
| Bi–TiO2/SBA-15(2.0%) | 1.95% | 527.7 | 0.518 | 5.882 |
| Bi–TiO2/SBA-15(4.0%) | 3.86% | 509.4 | 0.510 | 5.847 |
Raman spectroscopy was performed for Bi–TiO2/SBA-15(2.0%), as shown in Fig. 3b. The Raman bands appear at 147, 400, 520 and 641 cm−1 can be assigned to the Eg, B1g, A1g and B1g vibration modes of anatase TiO2. The results indicate that the doping of Bi has not influence the anatase-type of TiO2.
XPS was used to determine the surface chemical states of doped Bi in the composite. In Fig. 4a and 4b, the peaks of Bi 4f7/2 and Bi 4f5/2 were centered at 159.3 and 164.5 eV, which was agreement with Bi2O3 values of other observations.21,45 Moreover, a weak signal centred at 157.2 eV indicated the existence of Bi0, as shown in Fig. 4b. The XPS results indicated that the Bi doping mainly existed as Bi2O3.18 The O 1s region was split into three contributions, as shown in Fig. 4c. The first peak of 529.8 eV for Bi–TiO2/SBA-15 is ascribed to the Ti–O bond in TiO2. The second shoulder one at 531.4 eV can be assigned to the oxygen attached to bismuth (Bi–O bond),17 whereas the third one at 533.6 eV is assigned to the hydroxyl groups resulting mainly from the chemisorbed water. The Ti 2p of Bi–TiO2/SBA15 is shown in Fig. 4d. The Ti 2p3/2 peak at 458.2 and Ti 2p1/2 peak at 464.7 eV are due to the presence of tetrahedral coordination of Ti with a 4+ valence while no Ti3+ species is detected.46 This can be explained by the fact that the oxygen atom in Ti–O carries a higher effective negative charge than that in the Bi–O bond.47,48 Meanwhile, there was no significant influence on the spectra in either Ti 2p or O 1s in the presence of Bi2O3.
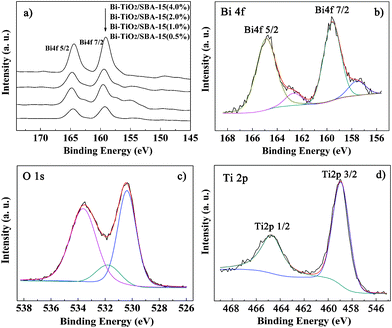 | ||
| Fig. 4 XPS spectra for samples with different Bi/Ti a), Bi 4f b), O 1s c) and Ti 2p d) of Bi–TiO2/SBA-15(2.0%). | ||
A comparison of the UV-vis absorption spectra of the pure TiO2 and Bi–TiO2/SBA-15 is displayed in Fig. 5a. There is a red-shift of absorbance for Bi–TiO2/SBA-15 in the visible region in comparison with pure TiO2. The results show that the doping of Bi increases the absorbance of visible light and extends the absorption edge to longer wavelengths. When the Bi content is 4.0%, the absorbance is significantly higher than that of other Bi–TiO2/SBA-15 samples. In addition, when the Bi content is 2.0%, the absorbance edge has the largest red shift towards longer wavelength. The enhanced adsorption of the Bi–TiO2/SBA-15 material in the visible region can be attributed to the interaction between Bi3+ 6s electrons of Bi2O3 and Ti4+ 3d energy band of TiO2.49 For Bi–TiO2/SBA-15 materials, the energy band is assumed to be between the top of the Bi3+ 6s band and the bottom of the Ti4+ 3d band. As a result, because of the decrease of the band gap and the increase of absorbance, a more efficient catalytic activity can be obtained. Thus we can infer that the doping of Bi and TiO2 in SBA-15 is effective for the visible light response of the materials and can be utilized in visible light active photocatalysis.
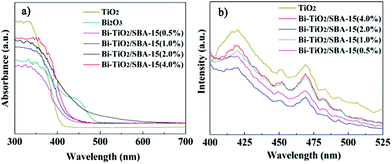 | ||
| Fig. 5 UV-vis absorption spectra a) and PL spectra b) of Bi–TiO2/SBA-15. | ||
PL emission spectra have been widely used to investigate the electron–hole pairs and charge carrier efficiency of semiconductors.50Fig. 5b showed the PL spectra of TiO2 and Bi–TiO2/SBA-15 in the range 400–525 nm. As seen for TiO2, the well-resolved peaks at 419 nm, 451 nm, 468 nm, 483 nm, 492 nm and 506 nm were observed, which can be attributed to surface traps. The PL intensity of the samples decreases as following: TiO2 > Bi–TiO2/SBA-15(4.0%) > Bi–TiO2/SBA-15(1.0%) > Bi–TiO2/SBA-15(0.5%) > Bi–TiO2/SBA-15(2.0%). It indicated that the decrease in trap states on the sample surface may slow the recombination process of photogenerated electrons and holes in TiO2, which benefit the photocatalytic reaction.
The UV-vis absorption spectra clearly reveal that the visible light absorption of Bi–TiO2/SBA-15 is higher than that of TiO2 and Bi2O3. Therefore, it is reasonable to expect higher photocatalytic activity when the Bi species and TiO2 are deposited on the SBA-15 mesostructure. Prior to studying the photocatalytic activity, absorption experiments were performed to determine the equilibrium time between RhB and photocatalyst, as shown in Fig. S2.† The results indicated that the catalysts achieve highest absorption efficiency within 30 min. We evaluated the Bi–TiO2/SBA-15(x%) samples for degradation of RhB under visible light irradiation and compared the catalytic efficiency of Bi–TiO2/SBA-15(x%) with that of TiO2/SBA-15, Bi2O3 and TiO2, the results of which are displayed in Fig. 6a. The Bi–TiO2/SBA-15(2.0%) completely decomposed the RhB solution within 90 min, compared to more than 120 min for the TiO2/SBA-15 samples, which implies that the doped Bi is essential as a co-catalyst for efficient degradation. We therefore ascribed the high photodecomposition reaction to the synergistic effect between Bi2O3 and TiO2. Thus, the recombination between e− and h+ is subsequently reduced, allowing more opportunities for electrons to participate in the reduction reaction to form active oxygen species, which are capable of photodecomposing RhB. The transfer of the photo-excited electrons from the surface of Bi2O3 to TiO2 occurs due to the small Bi2O3 band gap and its higher conduction band potential compared to that of TiO2. The activities decrease in the following order: Bi–TiO2/SBA-15(2.0%) > Bi–TiO2/SBA-15(1.0%) > Bi–TiO2/SBA-15(0.5%) > Bi–TiO2/SBA-15(4.0%) > TiO2/SBA-15 > Bi2O3 > TiO2. The superior photodecomposition property of the Bi–TiO2/SBA-15(x%) relative to TiO2 is due to their higher surface area and mesoporous structures. We also could find the optimum Bi loading in the investigated range from 0.5–4.0%. The degradation efficiency increased with increase in Bi content loaded onto SBA-15 materials up to 2.0% followed by a decrease in the efficiency with a further increase in Bi content. This indicated that higher amounts of Bi are not necessary for a more efficient photocatalyst. When the Bi content is low, the average distances between the photoactive sites and the adsorption sites are longer. On the contrary, if Bi loading is excessive, the probability of e−/h+ recombination rate increases because the average distances between the trap sites decreases, thus reducing the catalytic efficiency.
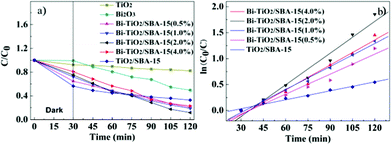 | ||
| Fig. 6 Photocatalytic activity a) and kinetic linear simulation curve b) of photocatalytic degradation by Bi–TiO2/SBA-15(x%) under visible light. | ||
It is known that photodegradation kinetics follow Langmuir–Hinshelwood kinetics model.51,52 The reaction can be represented as follows (eqn (1)):
 | (1) |
Where kr is the reaction rate constant, K is the adsorption coefficient of the RhB at the surface of SBA-15 and C is the concentration of the RhB solution. When C is very small, the KC product is negligible with respect to unity so that eqn (1) describes first-order kinetics. The integration of eqn (1) with the limit condition that at the start of irradiation, t = 0, the concentration is the initial one, C = C0, giving eqn (2):
 | (2) |
Where kapp is the apparent first-order reaction constant, C0 is the initial concentration of the RhB solution. A kinetic linear simulation curve of RhB photocatalytic degradation using Bi–TiO2/SBA-15(x%) is shown in Fig. 6b. The fact that the curve showed good linearity indicating that the photocatalytic degradation of RhB using Bi–TiO2/SBA-15(x%) as catalyst fits well with the first-order reaction kinetics. The kapp value of the catalyst Bi–TiO2/SBA-15(2.0%) is 0.0206 min−1, which is higher than that of TiO2/SBA-15 and Bi–TiO2/SBA-15(0.5, 1.0, 4.0%). It suggested that kapp is improved by Bi doping.
The energy levels and band gap of an oxide semiconductor play a crucial role in determining its photocatalytic activity. DFT calculations were performed to evaluate the electron structures of pure TiO2 and Bi–TiO2, as shown in Fig. S3† and Fig. 7. The band structure in Fig. 7a reveals that Bi–TiO2 is a direct gap semiconductor, which benefits the hole–electron separation and the charge transport. The calculated band gap of pure TiO2 and Bi–TiO2 was estimated to be 2.47 eV and 2.05 eV, respectively. The calculated band gap of pure anatase TiO2 is smaller than that of the experimental value, which is similar to other calculated results.53,54 The result indicated that Bi doping has an obvious effect on the band gap of TiO2. As shown in Fig. 7b, Bi 6s, O 2p and Ti 3d show a dominant contribution in the valence band. Compared with TiO2, of which the valence band top consists of Ti 3d and O 2p orbits, the valence band of Bi–TiO2 is largely more dispersed by Bi 6s orbits. The bottom of the conduction band is formed mainly by the Bi 6p orbital with a small contribution from O 2p, which indicates that charge transfer upon photoexcitation occurs from the orbital of O 2p and Bi 6s to the empty Bi 6p orbital. The Bi 6s and O 2p levels can form a preferable hybridized valence band, which can be excited by visible light. Therefore, it is reasonable to consider that the enhancement of photocatalytic activity is due to Bi doping. These calculated results are consistent with the experimental observations.
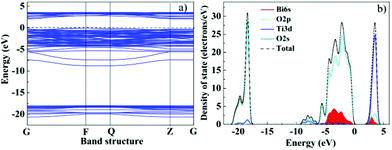 | ||
| Fig. 7 Band structure a) and DOS b) for Bi–TiO2 using plane-wave DFT. | ||
Conclusions
In conclusion, we have fabricated a visible light photocatalytic Bi–TiO2/SBA-15 material. The photocatalytic activity of the prepared photocatalysts was investigated by the photodegradation of RhB. Experimental results indicated that Bi–TiO2/SBA-15 exhibited higher photocatalytic activities than pure TiO2 and TiO2/SBA-15 owing to the synergistic effects of Bi species and TiO2. The optimal Bi/Ti molar ratio is 2.0%. The high photocatalytic activity can be attributed to the following two reasons: on the one hand, the appropriate amounts of Bi doping can enhance the photocurrent due to the reduced electron–hole recombination. On the other hand, the high surface area and the ordered mesoporous SBA-15 channels enhanced light harvesting, reactant adsorption, and diffusion. Moreover, DFT analysis suggests that the Bi doping can reduce the band gap, which enhances the photocatalytic activity under visible light. This work provides a new pathway to design and fabricate novel photoactive materials for practical applications in environmental cleaningAcknowledgements
We are grateful for financial support from the National Natural Science Foundation of China (NO.50874087 and NO.50978212) and the Talent Foundation of Xi'an University of Architecture and Technology (NO.RC1119).References
- A. Fujishima and K. Honda, Nature, 1972, 238, 37 CrossRef CAS.
- Z. Xiong, J. Ma, W. J. Ng, T. D. Waite and X. S. Zhao, Water Res., 2011, 45, 2095 CrossRef CAS.
- Y. Wang, R. Shi, J. Lin and Y. Zhu, Energy Environ. Sci., 2011, 4, 2922 CAS.
- Q. Y. Li, T. Kako and J. H. Ye, Chem. Commun., 2010, 46, 5352 RSC.
- R. Li, W. Chen, H. Kobayashi and C. Ma, Green Chem., 2010, 12, 212 RSC.
- J. J. Xu, Y. H. Ao, D. G. Fu and C. W. Yuan, Appl. Surf. Sci., 2008, 255, 2365 CrossRef CAS.
- Y. Wang, Y. Y. Wen, H. M. Ding and Y. K. Shan, J. Mater. Sci., 2010, 45, 1385 CrossRef CAS.
- J. X. Yu, S. W. Liu, Z. L. Xiu, W. N. Yu and G. J. Feng, J. Alloys Compd., 2008, 461, 17 CrossRef.
- J. Zhang, Z. Xiong and X. S. Zhao, J. Mater. Chem., 2011, 21, 3634 RSC.
- W. J. Hong and M. Kang, Mater. Lett., 2006, 60, 1296 CrossRef CAS.
- T. P. Cao, Y. J. Li, C. H. Wang, Z. Y. Zhang, M. Y. Zhang, C. L. Shao and Y. H. Liu, J. Mater. Chem., 2011, 21, 6922 RSC.
- J. H. Zhou, C. Y. Deng and S. H. Si, Electrochim. Acta, 2010, 55, 4995 CrossRef CAS.
- S. Sajjad, S. A. K. Leghari, F. Chen and J. L. Zhang, Chem.–Eur. J., 2010, 16, 13795 CrossRef CAS.
- H. Y. Li, D. J. Wang, P. Wang, H. Fan and T. F. Xie, Chem.–Eur. J., 2009, 15, 12521 CrossRef CAS.
- S. Rengaraj and X. Z. Li, Chemosphere, 2007, 66, 930 CrossRef CAS.
- Z. F. Bian, J. Zhu, S. H. Wang, Y. Cao, X. F. Qian and H. X. Li, J. Phys. Chem. C, 2008, 112, 6258 CAS.
- Y. Wang, Y. Wang, Y. Meng, H. Ding, Y. Shan, X. Zhao and X. Tang, J. Phys. Chem. C, 2008, 112, 6620 CAS.
- S. Rengaraj, X. Z. Li, P. A. Tanner, Z. F. Pan and G. K. H. Pang, J. Mol. Catal. A: Chem., 2006, 247, 36 CrossRef CAS.
- L. Q. Jing, J. Wang, Y. C. Qu and Y.B. Luan, Appl. Surf. Sci., 2009, 256, 657 CrossRef CAS.
- Y. Q. Wu, G. X. Lu and S. B. Li, J. Phys. Chem. C, 2009, 113, 9950 CAS.
- S. Shamaila, A. K. L. Sajjad, F. Chen and J. L. Zhang, Appl. Catal., B, 2010, 94, 272 CrossRef CAS.
- X. Huang, W. J. Shi, J. A. Yuan, J. W. Shi, Z. Jiang and W. F. Shangguan, Environ. Technol., 2011, 32, 307 CrossRef CAS.
- C. L. Peza-Ledesma, L. Escamilla-Perea, R. Nava, B. Pawelec and J. L. G. Fierro, Appl. Catal., A, 2010, 375, 37 CrossRef CAS.
- P. Periyat, K. V. Baiju, P. Mukundan, P. K. Pillai and K. G. K. Warrier, Appl. Catal., A, 2008, 349, 13 CrossRef CAS.
- X. Y. Zhang, H. P. Li, X. L. Cui and Y. H. Lin, J. Mater. Chem., 2010, 20, 2801 RSC.
- S. C. Zhang, D. Jiang, T. Tang, J. H. Li, Y. Xu, W. L. Shen, J. Xu and F. Deng, Catal. Today, 2010, 158, 329 CrossRef CAS.
- W. Y. Jung, G. D. Lee, S. S. Park, K. T. Lim and S. S. Hong, Catal. Today, 2011, 164, 395 CrossRef CAS.
- T. Ekou, C. Especel and S. Royer, Catal. Today, 2011, 173, 44 CrossRef CAS.
- C. C. Yang, J. Vernimmen, V. Meynen, P. Cool and G. Mul, J. Catal., 2011, 284, 1 CrossRef CAS.
- T. Klimova, O. Gutiérrez, L. Lizama and J. Amezcua, Microporous Mesoporous Mater., 2010, 133, 91 CrossRef CAS.
- F. X. Zhang, X. Carrier, J. M. Krafft, Y. Yoshimurac and J. Blanchard, New J. Chem., 2010, 34, 508 RSC.
- Y. J. Acosta-Silva, R. Nava, V. Hernández-Morales, S. A. Macías-Sánchez, M. L. Gómez-Herrera and B. Pawelec, Appl. Catal., B, 2011, 110, 108 CrossRef CAS.
- D. Zhao, J. Feng, Q. Huo, N. Melosh, G. H. Fredrickson, B. F. Chmelka and G. D. Stucky, Science, 1998, 279, 548 CrossRef CAS.
- D. Zhao, Q. Huo, J. Feng, G. H. Fredrickson and G. D. Stucky, J. Am. Chem. Soc., 1998, 120, 6024 CrossRef CAS.
- J. Ma, L. Qiang, X. Tang and H. Li, Catal. Lett., 2010, 138, 88 CrossRef CAS.
- Z. Y. Zhao and Q. J. Liu, J. Phys. D: Appl. Phys., 2008, 41, 085417 CrossRef.
- M. Yang, P. H. Liu, Y. F. Ho, C. Y. Chiu and K. J. Chao, Chem. Mater., 2003, 15, 275 CrossRef.
- S. Y. Chai, Y. J. Kim, M. H. Jung, A. K. Chakraborty, D. Jung and W. I. Lee, J. Catal., 2009, 262, 144 CrossRef CAS.
- Q. S. Huo, R. Leon, P. M. Petroff and G. D. Stucky, Science, 1995, 268, 1324 CAS.
- W. J. J. Stevens, K. Lebeau, M. Mertens, G. Van Tendeloo, P. Cool and E. F. Vansant, J. Phys. Chem. B, 2006, 110, 9183 CrossRef CAS.
- M. V. Landau, L. Vradman, X. Wang and L. Titelman, Microporous Mesoporous Mater., 2005, 78, 117 CrossRef CAS.
- E. Beyers, P. Cool and E. F. Vansant, Microporous Mesoporous Mater., 2007, 99, 112 CrossRef CAS.
- F. Chiker, J. P. Nogier, F. Launay and J. L. Bonardet, Appl. Catal., A, 2009, 243, 309 CrossRef.
- H. C. Yang, H. Y. Lin, Y. S. Chien, J. C. S. Wu and H. H. Wu, Catal. Lett., 2009, 131, 381 CrossRef CAS.
- S. Perathoner, P. Lanzafame, R. Passalacqua, G. Centi, R. Schlögl and D. S. Su, Microporous Mesoporous Mater., 2006, 90, 347 CrossRef CAS.
- B. M. Reddy, I. Ganesh and A. Khan, J. Mol. Catal. A: Chem., 2004, 223, 295 CrossRef CAS.
- M. W. Chu, M. Ganne, M. T. Caldes and L. Brohan, J. Appl. Phys., 2002, 91, 3178 CrossRef CAS.
- C. Jovalekic, M. Pavlovic, P. Osmokrovic and L. Atanasoska, Appl. Phys. Lett., 1998, 72, 1051 CrossRef CAS.
- Y. Bessekhouad, D. Robert and J. V. Weber, Catal. Today, 2005, 101, 315 CrossRef CAS.
- Y. Wu, H. Liu, J. Zhang and F. Chen, J. Phys. Chem. C, 2009, 113, 14689 CAS.
- Y. Z. Li and S. J. Kim, J. Phys. Chem. B, 2005, 109, 12309 CrossRef CAS.
- S. Zheng, Y. Cai and K. E. O'Shea, J. Photochem. Photobiol., A, 2010, 210, 61 CrossRef CAS.
- A. Heller, Acc. Chem. Res., 1995, 28, 503 CrossRef CAS.
- T. Umebayashi, Y. Yamaki, H. Itoh and K. Asai, Appl. Phys. Lett., 2002, 81, 454 CrossRef CAS.
Footnote |
| † Electronic supplementary information (ESI) available. See DOI: 10.1039/c2ra01199a |
| This journal is © The Royal Society of Chemistry 2012 |
