Customised transition metal oxide nanoparticles for the controlled production of carbon nanostructures
Karl
Mandel
,
Frank
Dillon
,
Antal A.
Koos
,
Zabeada
Aslam
,
Frank
Cullen
,
Hugh
Bishop
,
Alison
Crossley
and
Nicole
Grobert
*
Department of Materials, Parks Road, University of Oxford, Oxford, OX1 3PH UK. E-mail: nicole.grobert@materials.ox.ac.uk
First published on 7th March 2012
Abstract
Monodisperse magnetite (Fe3O4) and cobaltous oxide (CoO) nanoparticles were synthesised using a fast (up to 50 times quicker than previously reported) and facile one-pot, one-step reaction. The Fe3O4 nanoparticles had a constant size between 5 to 7 nm independent of the reagents used. Size controlled cube shaped CoO particles in the range of 10–20 nm were formed and it was possible to create voids in these particles in a controlled way. Carbon nanotubes were grown on these catalyst particles and their structures were compared. Structures of the nanotubes differed between straight, bamboo-like or partly coiled depending on the nanoparticle system used, suggesting the possibility of selection of these structures.
Introduction
The controlled synthesis of monodisperse transition metal oxide nanoparticles is of great interest due to the extensive assortment of structures with specific properties that can be generated and the phenomena observed.1 Whilst a multitude of synthesis procedures have been reported,2 most are relatively expensive and very time consuming. The thermal decomposition method, where a metal source and multiple stabilising agents are decomposed to form nanoparticles, offers one of the most flexible synthesis pathways. The seminal work of Sun et al.3 described the synthesis of magnetite nanoparticles via this method. Subsequent reports, using modifications pertaining to solvents or precursors, normally used a combination of oleic acid and oleylamine as stabilisers.4–7 The size of the magnetite nanoparticles could be varied by using long reaction times (11 nm particles resulted after 24 h)8 or by varying the amount of expensive stabilisers.6 Similarly, size-controlled Co-based nanoparticles were reported by several authors who also used the thermal decomposition method in conjunction with different types of stabilising agents.9,10,11 The shape of these Co-based nanoparticles was dependent on the stabilising agents used; Co-based nanoparticles with rod, hexagonal, cubic, triangular or spherical shapes were synthesised.12,13 However, long synthesis times, multi-step reactions and the use of expensive precursors and stabilisers limit the applicability of the thermal decomposition technique.In order to overcome this bottleneck we developed a fast and facile one-pot, one-step reaction allowing us to create size-controlled catalytic nanoparticles for the production of tailored carbon nanomaterials. For instance, transition metal-based nanoparticles play an important role in the formation of carbon nanotubes (CNTs) as the nanotube diameter is proportional to the catalyst particle sizes.18 In this context, various techniques for the growth of CNTs using pre-formed, size-controlled catalyst particles were developed in recent years, however, a detailed understanding of the catalysts necessary to generate CNTs has yet to be developed.14–20 Nanoparticles previously used for CNT growth include Co–Mo and Fe–Mo,14 Co,15 Fe–Ni,16 magnetite (Fe3O4),17 CoFe2O4,18 Fe–V–O19 and Cu.20 Nevertheless, as previous works mainly focused on the use of just one type of nanoparticle and examined the influence of various CNT synthesis conditions and techniques, it is practically impossible to directly compare the influence of different metal nanoparticle types on CNT growth and structure.
Herein, we investigate the growth of CNTs using two dedicated nanoparticle systems; namely magnetite (Fe3O4) and cobaltous oxide (CoO). Both nanoparticle systems were synthesised using a fast and facile one-pot, one step reaction previously reported for the synthesis of NiP nanoparticles.21 As both nanoparticle and CNT synthesis are identical for both materials a direct comparison between the products is possible.
Experimental
A simple one-pot, one-step approach involving only three reagents; namely 1 mmol (M)acetylacetonate (M(acac)) (M = Fe or Co), x ml oleylamine (OA), and y mmol triphenylphosphane (TPP) were used to synthesise the nanoparticles of controlled size. The reagents were placed into a three neck flask equipped with a magnetic stirrer, reflux cooler, and a thermometer which directly measured the temperature of the liquid. The flask was then flushed with Ar for 5 min whilst stirring at room temperature before the temperature was raised to 220 °C at a heating rate of 17 °C min−1. Typically, at 215 °C, the solution turned black, indicating the formation of nanoparticles. After only 10 min the heating mantle was removed and the solution was allowed to cool to room temperature while being stirred. Subsequently, the nanoparticles were collected by adding an excess of ethanol, centrifuging at 1520 g and, after removal of the liquid phase, following this, the particles could easily be re-dispersed in cyclohexane. For carbon nanotube synthesis carried out using these Fe and Co based nanoparticles the nanoparticles were deposited on the inner wall of a quartz tube. For this, CNTs were grown from the 5–7 nm Fe3O4 and 10, 14 and 20 nm CoO cube shaped particles. Cyclohexane was then decomposed in the presence of the catalyst nanoparticles at 750 °C. Details of the CNT synthesis can be found elsewhere.21Particle sizes and nanotube diameters were analyzed by counting 100 particles from transmission electron microscope (TEM) images taken with a Jeol4000HR TEM. For non spherical particles, the longest axis of the particles was measured. The nanoparticles and nanotube diameters were counted manually without any automated particle counting software in order to avoid computer pattern recognition errors. X-Ray diffraction (XRD) was carried out to obtain information about the crystalline state of the particles. Drops of the solvent containing the analyte were applied to a single crystal of silicon and were allowed to evaporate on the crystal. Analyses were carried out at room temperature, using a fully automated Siemens D5000 powder diffractometer employing copper Kα radiation (λ = 0.15406 nm) and a secondary monochromator. The samples were continuously spun during data collection and were scanned using a step size of 0.05° 2θ in the range of 5–75° 2θ and a count time of 12 s per step. A VG Clam X-ray photoelectron spectrometer was employed to investigate the chemical composition of the particles. In order to remove the organic capping of the particles, the nanoparticles were exposed to ion bombardment using 4 keV Ar+ ions from a Leybold IQE 12/38 rastered ion gun. SEM images of the CNTs were taken with a JEOL Scanning Microscope 840F. Raman analysis was carried out using a Horiba Labram Aramis spectrometer with a 532 nm laser.
Results and discussion
Initial experiments, mixing only TPP with either the iron or cobalt acetylacetonates, did not lead to the formation of nanoparticles. When using oleylamine alone (in various amounts between 3 ml and 40 ml) nanoparticles were obtained from iron(III)acetylacetonate and cobalt(II)acetylacetonate at a temperature of 220 °C. From these preliminary results more systematic studies, i.e. varying OA and TPP concentrations, were carried out in a similar fashion to how we previously investigated the formation of NiP nanoparticles.21XRD patterns of the particles, shown in Fig. 1, were found to fit well for Fe3O4 (magnetite) and CoO22 and hence the particles will be addressed as Fe3O4 and CoO particles in the following. Transmission electron micrographs (TEM) revealed that the Fe3O4 nanoparticles always exhibited diameters of 5–7 nm, independent of the amount of OA or TPP (Fig. 2)
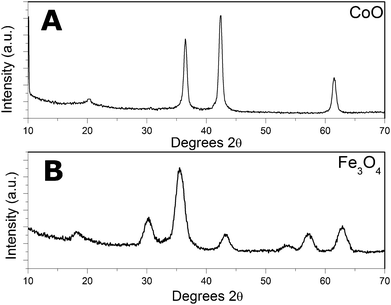 | ||
| Fig. 1 XRD of the as produced (a) CoO and (b) Fe3O4 nanoparticles. | ||
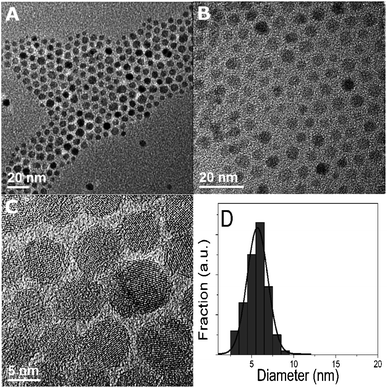 | ||
| Fig. 2 TEM micrographs of Fe3O4 nanoparticles (a, b). (c) Shows the crystallinity of the particles. Typical size distribution of the particles (d). | ||
The CoO particles produced from 1 mmol cobalt(II)acetylacetonate had cubic shapes if OA and up to 1 mmol of TPP were used. Fig. 3 demonstrates the size dependence of the nanoparticles on the oleylamine concentration. For example, 10 nm particles were obtained for 3 ml (9 mmol) OA whereas particles had sizes of 20 nm if 40 ml (120 mmol) OA was used. Fig. 4 shows TEM micrographs and size distributions of the CoO particles. The results differ from previous reports where an increase in the amount of OA led to the formation of smaller cubic nanoparticles after reaction times of eight hours.23 Here, we found cubic shapes after only 10 min, i.e. the time necessary to produce nanoparticles was reduced by 50 times compared to previous reports. A possible explanation for the size dependence observed here may be that a lower concentration of free metal atoms in solution leads to larger particles as the critical nucleation size inversely depends on the concentration of free metal atoms in the solution.24
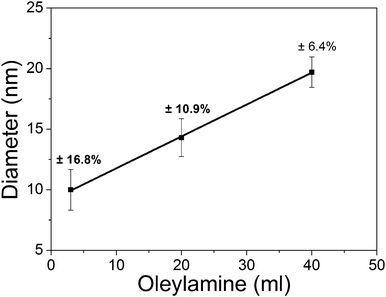 | ||
| Fig. 3 The size dependence of the CoO nanoparticles as a function of the amount of oleylamine. | ||
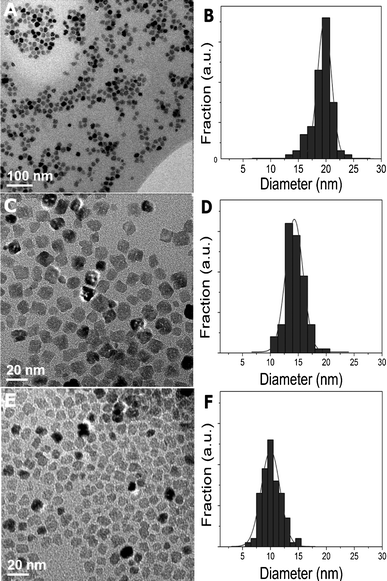 | ||
| Fig. 4 TEM micrographs and size distributions of CoO particles of 20 nm (40 ml OA, 1 mmol TPP) (a, b), 14 nm (20 ml OA, 1 mmol TPP) (c, d) and 10 nm (3 ml OA) (e, f) diameters. Increasing amounts of OA led to larger nanoparticle diameters. | ||
TEM, and high-resolution transmission electron microscopy (HRTEM) further show that higher TPP concentrations resulted in an increase in voids and cracks in the CoO nanoparticles (Fig. 5 and 6). This observation, reported as the Kirkendall effect, was previously observed for Ni2P nanoparticles25,26 and was thought to be due to different diffusing speeds of Ni and P in the particle which leads to the formation of voids. The addition of TPP also leads to an increase in size of the particles. For example, adding 20 mmol TPP to 3 ml (9 mmol) OA changed the size of the particles from 10 nm to 19 nm, while 20 mmol TPP added to 20 ml (60 mmol) OA resulted in a 12 nm increase in size, i.e. 14 nm (20 ml OA 1 mmol TPP) to 26 nm, which means that in both cases the particle size was almost doubled.
 | ||
| Fig. 5 TEM micrographs and magnified schemes of CoO particles formed using 20 ml OA and 1 mmol TPP) (a, b), 20 mmol TPP (c, d) and 40 mmol TPP (e, f). Voids and cracks were observed to become more dominant in the CoO nanoparticles with increasing amounts of TPP. | ||
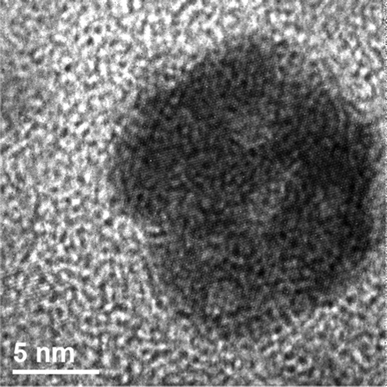 | ||
| Fig. 6 HRTEM image of a crystalline CoO particle exhibiting voids. | ||
The presence of the stabilising agent on the particles and their chemical nature was confirmed by X-ray photoelectron spectroscopy (XPS) analyses. XPS was carried out on the as prepared nanoparticles and nanoparticles which had undergone ion bombardment (5 min) in order to remove surface oxides and organic capping agents. For the Fe3O4 particles, although synthesised in the presence of TPP, no P was detected. N on the other hand was present and was significantly removed by ion bombardment, indicating the capping function of the amine on the particles (Fig. 7). Exactly the same observations were made for the CoO particles (Fig. 8). It important to point out that no P could be detected in either of the two nanoparticle systems. Although a clear relationship between the presence of TPP and the void formation is evident for the CoO particles (Fig. 4 and 5), no traces of P appear to remain in the particles.
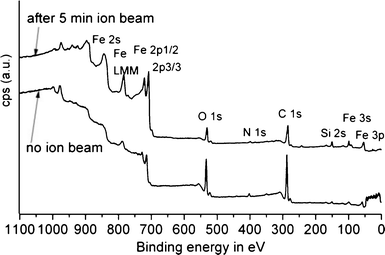 | ||
| Fig. 7 XPS spectra of the magnetite particles before ion bombardment (lower graph) and after 5 min of ion bombardment (upper graph). | ||
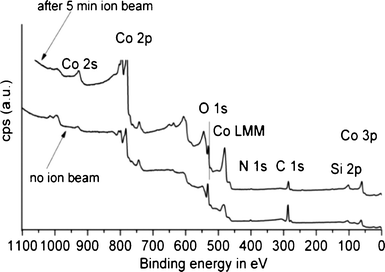 | ||
| Fig. 8 XPS spectrum before (bottom line) and after 5 min of ion bombardment (top line) for the CoO particles, being produced in the presence of TPP; no evidence of P was found. | ||
Comparisons between Fe3O4, CoO, and NiP21 nanoparticles clearly demonstrate that each transition metal interacts differently with identical stabilisers under similar reaction conditions. Ni-based nanoparticles seem to incorporate P from TPP whilst the phosphane also acts as a stabiliser. Fe3O4 and CoO nanoparticles require amines as capping agents and show no affinity towards P; although P apparently interacts with the Co particles as its presence leads to void/crack formation. Furthermore, Fe and Co tend to form oxide nanoparticles and different concentrations of stabilising agents influence Ni–P and Co/CoO particle sizes but not Fe3O4 nanoparticles.
We further investigated the performance of size controlled Fe3O4 and CoO nanoparticles as catalysts for the production of CNTs. SEM observations showed that CNTs grown from Fe3O4 nanoparticles occur in a forest like arrangement of tubes (Fig. 9a). Nanotubes grown from CoO particles do not show this forest like arrangement but rather a “spaghetti-like” order (Fig. 9b). Additionally, TEM images revealed differences in the structures of the nanotubes. Whereas mainly straight nanotubes were grown on the Fe3O4 particles (Fig. 10a), a mixture of bamboo, straight and partly coiled nanotubes were grown from CoO (Fig. 10b). Raman spectroscopy (not shown) was used to analyse the quality of the nanotubes. An intensity ratio of the D to the G peaks of 0.75 was recorded for the straight nanotubes grown on the magnetite particles, whereas the D/G ratio was 1.0 for the irregular bamboo (thus more defective) nanotubes grown on the CoO particles.
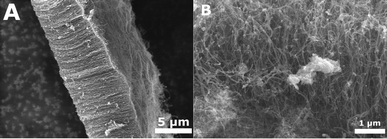 | ||
| Fig. 9 Left: SEM image of CNT forests grown from Fe3O4 particles. Right: SEM image of spaghetti-like ordered CNTs grown from CoO particles. | ||
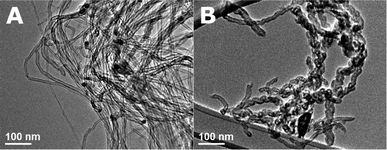 | ||
| Fig. 10 TEM: left: straight nanotubes grown from Fe3O4 nanoparticles. Right: bamboo and partly coiled nanotubes grown from CoO particles. | ||
A comparison of nanotube diameters with nanoparticle size showed a rather broad size distribution of between 5 to 20 nm for nanotubes grown on the magnetite nanoparticles. A better correlation was found for the CoO particles. An overview of the size distribution of the carbon nanotube diameters in comparison to the particle diameters is provided in Fig. 11.
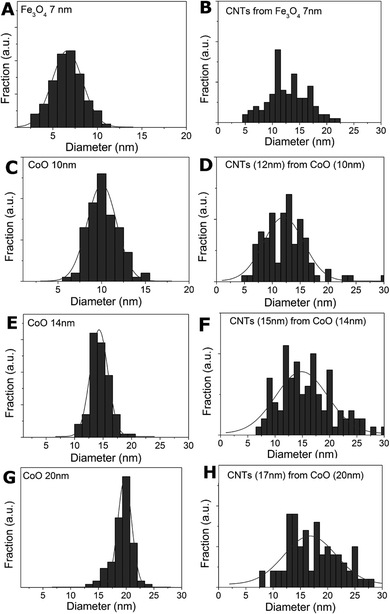 | ||
| Fig. 11 Left column: nanoparticle size distribution, right column: CNT diameter size distribution: a, b) for Fe3O4 particles and c–h) for 10, 14 and 20 nm CoO particles. | ||
Conclusions
In this work monodisperse Fe3O4 and CoO nanoparticles were produced using a one-pot, one-step reaction. Nanoparticles of Fe3O4 with a 5–7 nm diameter were synthesized, whilst cube-shaped CoO particles were obtained in controlled sizes from 10 to 20 nm by varying the amount of OA. The addition of TPP led to a void/crack formation in the particles in conjunction with an increase in the size of their diameter. Hence nanoparticle formation behaviour for the transition metals Fe, Co and Ni under identical conditions is very different. All nanoparticles were active catalysts for carbon nanotube growth. It seems that a good correlation between the nanotube diameters with the particle sizes depends on the growth mechanism which is reliant on the type of particle. Structures of the nanotubes differed between straight, bamboo-like or partly coiled depending on the nanoparticle system used.Acknowledgements
This work was supported by Evonik Industries, Studienstiftung d. dt. Volkes, the Royal Society, the European Commission (STREP project BNC Tubes, Contract Number NMP4-CT-2006-03350) and ERC-2009-StG-240500.References
- J. Park, J. Joo, S. G. Kwon, Y. Jang and T. Hyeon, Angew. Chem., Int. Ed., 2007, 46, 4630 CrossRef CAS.
- B. L. Cushing and V. L. Kolesnichenko, Chem. Rev., 2004, 104, 3893 CrossRef CAS.
- S. Sun, H. Zeng, D. B. Robinson, S. Raoux, P. M. Rice, S. X. Wang and G. Li, J. Am. Chem. Soc., 2004, 126, 273 CrossRef CAS.
- C. J. Meledandri, K. J. Stolarczyk, S. Ghosh and D. F. Brougham, Langmuir, 2008, 24, 14159 CrossRef CAS.
- D. Maity, S. G. Choo, J. Yi, J. Ding and J. M. Xue, J. Magn. Magn. Mater., 2009, 321, 1256 CrossRef CAS.
- R. Shi, G. Gao, R. Yi, K. Zhou, G. Qiu and X. Liu, Chin. J. Chem., 2009, 27, 739 CrossRef CAS.
- K. Simeonidis, S. Mourdikoudis, M. Moulla, I. Tsiaoussis, C. Martinez-Boubeta, M. Angelakeris, C. Dendrinou-Samara and O. Kalogirou, J. Magn. Magn. Mater., 2007, 316, e1 CrossRef CAS.
- D. Maity, S. N. Kale, R. Kaul-Ghanekar, J. Xue and J. Ding, J. Magn. Magn. Mater., 2009, 321, 3093 CrossRef CAS.
- Y. Lu, X. Lu, B. T. Mayers, T. Herricks and Y. Xia, J. Solid State Chem., 2008, 181, 1530 CrossRef CAS.
- S. Sun and C. B. Murray, J. Appl. Phys., 1999, 85, 4325 CrossRef CAS.
- H. Shao, Y. Huanga, H. Leeb, Y. Suhb and Ch. Kima, J. Magn. Magn. Mater., 2006, 304, e28 CrossRef CAS.
- H. Shao, Y. Huang, H. Lee, Y. Suh and Ch. Kim, J. Appl. Phys., 2006, 99, 08N702 CrossRef.
- N. Shukla, E. B. Svedberg, J. Ell and A. J. Roy, Mater. Lett., 2006, 60, 1950 CrossRef CAS.
- T. Saito, S. Ohshima, W. Xu, H. Ago, M. Yumura and S. Iijima, J. Phys. Chem. B, 2005, 109, 10647 CrossRef CAS.
- Y. Huh, M. L. H. Green, Y. H. Kim, J. Y. Lee and C. J. Lee, Appl. Surf. Sci., 2005, 249, 145 CrossRef CAS.
- W. Shen, F. E. Huggins, N. Shah, G. Jacobs, Y. Wang, X. Shi and G. P. Huffman, Appl. Catal., A, 2008, 351, 102 CrossRef CAS.
- Y. Kobayashi, H. Nakashima, D. Takagi and Y. Homma, Thin Solid Films, 2004, 464, 286 CrossRef.
- C. Altavilla, M. Sarno and P. Ciambelli, Chem. Mater., 2009, 21, 4851 CrossRef CAS.
- I. Gunjishima, T. Inoue and A. Okamoto, Jpn. J. Appl. Phys., 2008, 47, 2313 CrossRef CAS.
- W. Zhou, Z. Han, J. Wang, Y. Zhang, Z. Jin, X. Sun, Y. Zhang, C. Yan and Y. Li, Nano Lett., 2006, 6, 2987 CrossRef CAS.
- K. Mandel, F. Dillon, A. A. Koos, Z. Aslam, K. Jurkschat, F. Cullen, A. Crossley, H. Bishop, K. Moh, C. Cavelius, E. Arzt and N. Grobert, Chem. Commun., 2011, 47, 4108 RSC.
- International Center for Diffraction Data PDF4+ database.
- W. S. Seo, J. H. Shim, S. J. Oh, E. K. Lee, N. H. Hur and J. T. Park, J. Am. Chem. Soc., 2005, 127, 6188 CrossRef CAS.
- C. Burda, X. Chen, R. Narayanan and M. A. El-Sayed, Chem. Rev., 2005, 105, 1025 CrossRef CAS.
- R. K. Chiang and R. T. Chiang, Inorg. Chem., 2007, 46, 369 CrossRef CAS.
- X. Zheng, S. Yuan, Z. Tiana, S. Yina, J. Hea, K. Liua and L. Liua, Mater. Lett., 2009, 63, 2283 CrossRef CAS.
| This journal is © The Royal Society of Chemistry 2012 |
