DOI:
10.1039/C2RA01212J
(Paper)
RSC Adv., 2012,
2, 4683-4689
Effects of graphene oxide on surface energy, mechanical, damping and thermal properties of ethylene-propylene-diene rubber/petroleum resin blends†
Received
30th November 2011
, Accepted 10th March 2012
First published on 12th April 2012
Abstract
The surface energy and damping properties of graphene oxide (G–O)/polymer composites were reported for the first time. G–O/ethylene-propylene-diene rubber (EPDM)/petroleum resin (PR) composites were prepared by the combination of solution-blending and two-roll mill mixing. SEM results demonstrate that G–O nanosheets were dispersed homogeneously in EPDM and EPDM/PR blends. Such good dispersion was preliminarily attributed to the matched surface energy as well as low interfacial energy of EPDM and G–O, which were determined by contact angle tests. The addition of 0.5 wt% G–O nanosheets increased the tensile modulus, tensile strength and elongation at the break of EPDM by more than 130%, 50% and 30%, respectively. G–O nanosheets containing composites were novel in improving the damping properties of EPDM(/PR). The thermogravimetric analysis tests show that G–O slightly changed the thermal stability of EPDM(/PR).
1. Introduction
Graphene has drawn world-wide attention on account of its excellent thermal, mechanical, electrical and gas barrier properties,1,2 which makes it promising in various novel applications. Graphene oxide (G–O) is oxygenated graphene possessing abundant oxygen-containing functional groups including epoxide, hydroxyl and carboxyl groups on the edges and surfaces,3 which enables it to constitute a variety of functionalized graphene-based materials.4,5 So far, G–O has turned out to be one kind of ideal fillers for polymer composites in many studies, especially for polymer with polar groups, such as poly(vinyl alcohol) (PVA),6,7 thermoplastic polyurethane (TPU),8 poly(methyl methacrylate) (PMMA),9etc. In Zhang et al.'s study,7 compared to pure PVA hydrogels, G–O/PVA hydrogels achieved a 132% increase in tensile strength with the addition of 0.8 wt% G–O. Kim et al.8 observed more than a 10-fold increase in tensile stiffness of TPU with only 3 wt% G–O. Generally, the improvement of the mechanical properties of G–O/polymer composites is attributed to the high elastic modulus (∼650 GPa)3 of G–O and successful stress transfer from polymer matrices to G–O. This enhancement of mechanical properties mainly depends on two factors: dispersion of G–O and interfacial adhesion between G–O and polymer matrices. The oxygen-containing groups of G–O help it disperse in polymer matrices and form the strong hydrogen-bonding interaction between G–O and polar polymer matrices.
However, compared with G–O/plastic composites, G–O/rubber composites have only been reported a limited amount, such as hydrogenated carboxylated nitrile–butadiene rubber (HXNBR),10 nitrile rubber (NBR),11 butyl rubber (IIR)12 and natural rubber (NR)13 composites. Because the use of rubber is widespread in almost all economic fields, studies of G–O/rubber composites will enlarge the application of G–O as well as provide a potential approach to improve the properties of rubber materials.
As one of the versatile matrices in rubber composites, ethylene-propylene-diene rubber (EPDM) has exceptional resistance to heat, oxidation, ozone and weather aging due to its stable, saturated polymer backbone structure.14 EPDM is widely used in outdoor electrical insulation and various automotive applications, etc. Blends of EPDM with petroleum resins (PR) have great potential for mechanical damping applications.15 The PR in our study is a form of aromatic hydrocarbon resin (C9) which possesses excellent chemical and weather resistance. To our knowledge, the properties of G–O/EPDM(/PR) composites are hitherto unreported.
As mentioned previously, the properties of polymer composites depend strongly on the dispersion of the fillers.8 However, there are barriers to disperse G–O into non-polar rubbers due to the poor interfacial interaction between them. In this study, in order to obtain well-dispersed G–O/EPDM(/PR) composites, we applied a combination of mixing techniques through solution and two-roll mill processing. The co-solvent tetrahydrofuran (THF)/toluene was found to yield a homogenous G–O/EPDM solution. In addition to mechanical dispersion, we exploited whether surface energy and interfacial energy would contribute to the dispersion of G–O in polymer matrices for the first time. Even though numerous researches have paid attention to the reasons for well-dispersed G–O in polymer matrices, little research has focused on the contribution of the surface energy. The dispersion and interfacial interactions of G–O in EPDM(/PR) were analyzed by scanning electron microscopy (SEM) and Raman spectra, respectively. The mechanical, damping and thermal properties of G–O/EPDM(/PR) composites were investigated by tensile tests, dynamic mechanical analysis (DMA) and thermogravimetric analysis (TGA), respectively.
2. Experimental
2.1. Materials
EPDM (BUNA® EP G 3850, the Mooney viscosity ML (1 + 4) 125 °C is 28) containing 7.8% ethylidene norbornene (ENB) and 48% ethylene, was produced by Bayer Co., Ltd. Petroleum resin (P-140) was produced by Idemitsu Kosan Co., Ltd, and its softening point is 140 °C.
2.2. Preparation of G–O/EPDM(/PR) composites
G–O was produced using a modified Hummer's method from flake graphite.10,16 The G–O/EPDM master-batch was prepared by solution processing as follows: 100 mg of G–O was firstly dispersed in 200 ml of THF with mild sonication for 3 h. Meanwhile, 5 g of EPDM was dissolved in 100 ml of toluene. Subsequently, the G–O/THF solution was poured into the EPDM solution. The mixture was continuously stirred for 15 h to yield a well-dispersed G–O/EPDM solution. Finally, this homogeneous G–O/EPDM solution was dried under vacuum at 60 °C until its weight kept unchanged.
The preparation of G–O/EPDM/PR composites was carried out with a two-step-mixing procedure: EPDM and PR were first mixed for 10 min in a HAAKE mixer, with a rotor speed of 60 rpm at room temperature; the resulting EPDM/PR blend was then mixed with the G–O/EPDM master-batch, 3 wt% dicumyl peroxide (DCP) and 3 wt% triallyl isocyanurate (TAIC) on a two-roll mill at room temperature. These composites were finally cured at 170 °C for 20 min under a pressure of 15 MPa. The ratio of EPDM and PR was kept at 2![[thin space (1/6-em)]](https://www.rsc.org/images/entities/char_2009.gif) :
:![[thin space (1/6-em)]](https://www.rsc.org/images/entities/char_2009.gif) 3 by weight and the G–O contents were varied to 0, 0.2 wt%, 0.5 wt%.
3 by weight and the G–O contents were varied to 0, 0.2 wt%, 0.5 wt%.
G–O/EPDM composites with G–O contents of 0 and 0.5 wt% were prepared under a similar procedure without the HAAKE compounding process.
2.3. Characterization
Atomic force microscopy (AFM) images of G–O were taken in a tapping mode performed on a Nano Scope III A (Digital Instrument, USA). The G–O/DMF (dimethyl formamide) solution was spin-coated onto freshly cleaved mica substrates at 2000 rpm and dried under vacuum at 80 °C for AFM characterization. Transmission electron microscopy (TEM) was conducted on a JEOL JEM-2100 electron microscope at 200 kV. The G–O samples were prepared by depositing a drop of G–O/DMF solution onto carbon-coated copper grids and dried at room temperature. SEM images of the G–O/EPDM(/PR) composites were obtained on a JSM-7401F field-emission SEM system. The SEM samples were fractured in liquid nitrogen and the fracture surfaces were vacuum-coated with gold. Raman spectra were obtained using a Senterra R200-L dispersive confocal microscope (Bruker Optics, Germany) with 785 nm laser excitation. Surface energy, its dispersive component and polar component were determined by contact angle analysis. The contact angles of deionized water and diiodomethane on G–O/EPDM(/PR) composites were measured by an OCA20 optical contact angle tester (Germany) at room temperature. Tensile tests were conducted on a SANS-Power Test V3.0 at 23 °C and a crosshead speed of 500 mm min−1. The dumbbell shape samples were 75 mm in length, 4 mm in width, 0.85 mm (G–O/EPDM composites) and 0.70 mm (G–O/EPDM/PR composites) in thickness. DMA was carried out on a Q800 dynamic measurement instrument (TA, USA) in tension mode under a nitrogen atmosphere, with a heating rate of 3 °C min−1 and a fixed frequency of 10 Hz. The sample size was 20 × 4 × 0.70 (/0.85) mm3. TGA was tested in nitrogen with a Perkin Elmer TGA 2050 instrument at a heating rate of 20 °C min−1 over a temperature range of 20–700 °C.
3. Results and discussion
3.1 Dispersion of G–O into EPDM(/PR) matrices
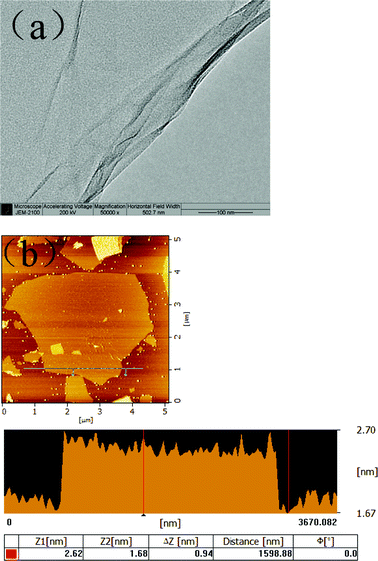
The morphology of the chemical modified G–O nanosheets was characterized by TEM and AFM. Fig. 1a shows a thin and large single-layer G–O sheet with slightly scrolled and folded edges which prevented the G–O sheets from stacking back and reforming graphite. Analysis of a large number of AFM images reveals that most G–O sheets were about 0.9 nm in thickness, which indicates that the graphite was fully exfoliated into monolayers, approximately 3 μm in both width and length (Fig. 1b).
A homogenous G–O/EPDM solution was yielded in the co-solvent THF/toluene, as shown in Fig. S1†. The final vulcanized G–O/EPDM(/PR) composites were homogenous black films without obviously aggregated G–O sheets (Fig. S2†). SEM measurements were used to investigate the morphology of G–O/EPDM(/PR) composites. Low resolution SEM images (Fig. S3†) show that the G–O/EPDM(/PR) composites were uniform. To further identify the dispersion of the G–O sheets in the G–O/EPDM(/PR) composites, high magnification SEM micrographs were taken. As seen in Fig. 2, no obvious G–O aggregates can be observed from the cross-section of G–O/EPDM (Fig. 2c–d) and G–O/EPDM/PR composites (Fig. 2g–h). The black arrows in Fig. 2 point to G–O sheets pulled out of the G–O/EPDM(/PR) composites, which were much thicker than the individual G–O sheets in Fig. 1b due to surface-coating by the matrices. The good dispersion of G–O in the composites was partly attributed to the mixing procedure combining solution-blending and two-roll-mill mixing. From the SEM images of the EPDM/PR blend and G–O/EPDM/PR composite, as shown in Fig. 2(e–h), it can be observed that there were some small particles dispersed in the matrix, which can be attributed to excess PR. Most probably it is because that the blend ratio of PR/EPDM (60/40) was higher than the absorptive capacity of EPDM, although PR and EPDM are compatible in most cases.15
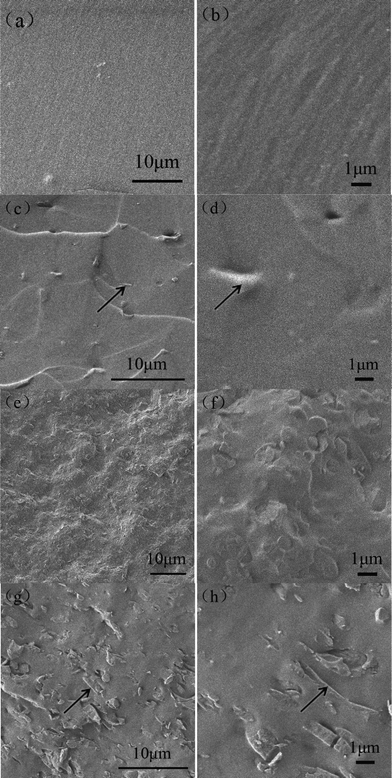 |
| | Fig. 2 SEM cross-sectional images of EPDM (a) 1000×, (b) 5000×; G–O/EPDM composites with G–O concentration of 0.5 wt% (c) 2000×, (d) 5000×; EPDM/PR blend (e) 1000×, (f) 5000×; G–O/EPDM/PR composites with a G–O concentration of 0.5 wt% (g) 2000×, (h) 5000×. The black arrows indicate the G–O nanosheets. | |
3.2. Interaction between G–O and EPDM
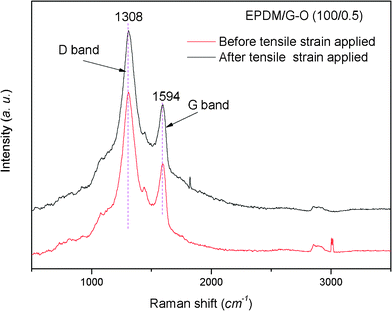
Besides the filler dispersion, the interfacial interaction between G–O and the matrices is another important factor affecting the properties of composites. In this case, Raman spectra were employed to study the interaction. The Raman spectra shown in Fig. 3 display two main bands at 1308 cm−1 and 1594 cm−1, corresponding with the characteristic D and G bands of G–O, respectively. The D band is related to the sp3 state of carbon, and it is used as proof of disruption of the aromatic π-electron system of G–O.9 If there were strong interactions between G–O and matrix, the D band peak would have shifted after tensile strain was applied to the samples, which was attributed to the strain effect, i.e. the strain would change the lattice constant of G–O and the corresponding Raman peak frequencies.17–20 After 50% tensile strain was applied to the G–O/EPDM composites, there was no D band peak shift compared with the original unstrained sample, indicating that the interfacial interaction between EPDM and G–O was not strong. It is reasonable because there are no active groups between EPDM and G–O to form hydrogen or ionic bonds, etc. In addition, the intensity ratio of the D–G band (ID/IG)9 had a slight change after extension, demonstrating that no sp2 hybridized carbons were converted to sp3 hybridized carbons because there was no covalent change in the G–O.
3.3. Effects of G–O on the surface energy of the G–O/EPDM(/PR) composites
Although the Raman spectra indicate that the interaction between G–O and EPDM was not strong, G–O can disperse homogeneously in EPDM(/PR) matrices, as seen in the SEM images. Besides the effect of mechanical dispersion, we tried to find other possible factors affecting the dispersion of G–O. It is reported that good dispersion of graphene in solvents is possible because the energy required to exfoliate graphene is balanced by the solvent–graphene interaction for solvents whose surface energy matches that of graphene.21 Similarly, we can investigate whether the surface energy of G–O and EPDM is matched, which probably contributes to the good dispersion of the G–O/EPDM composites. Furthermore, interfacial energy is found to be one of the most important factors affecting the distribution of particles in polymer blends.22
Thus, to further investigate the effect of the surface energy as well as interfacial energy on dispersion of G–O in EPDM(/PR) matrices, the contact angles were measured. The surface energy can be divided into two components: a dispersive component of nonpolar interaction and a specific (polar) component. The surface energy (γs), a dispersive component (γds) and a polar component (γps) of composites were determined by measuring the contact angles of two liquids on the composites and analyzing the results referring to the method proposed by Owens and Kaelble as follows:23
| |  | (1) |
| |  | (2) |
where
γl,
γdl and
γpl are the surface energy of immersion liquid and its dispersive and polar components, respectively.
The contact angles and surface energy of G–O/EPDM and G–O/EPDM/PR composites are presented in Table 1. Notably, the contact angles of G–O referred to the literature value,24 and the γs, γds, γps of G–O were calculated by Owens and Kaelble method as well. Using these values, the interfacial energy can be calculated by Wu's harmonic mean average equation22 and listed in Table 2.
Table 1 Contact angles (°) and surface free energy (mJ m−2) of G–O/EPDM(/PR) composites
| Sample |
Contact angle θ |
γ
s
d
|
γ
ps
|
γ
s
|
| Matrix |
G–O content (wt%) |
Deionized water |
Diiodomethane |
| EPDM |
0 |
72.9 ± 4.3 |
60.9 ± 6.6 |
20.6 |
13.3 |
34.0 |
| 0.5 |
82.8 ± 2.5 |
56.1 ± 2.5 |
25.8 |
6.2 |
31.9 |
| EPDM/PR (40/60) |
0 |
96.0 ± 1.4 |
64.1 ± 2.4 |
23.8 |
2.1 |
25.9 |
| 0.2 |
92.7 ± 3.0 |
70.0 ± 2.2 |
19.3 |
4.2 |
23.5 |
| 0.5 |
90.5 ± 7.0 |
70.3 ± 1.1 |
18.7 |
5.2 |
23.9 |
| G–O |
|
67.4 ± 1.1 |
38.5 ± 3.2 |
32.2 |
11.6 |
43.8 |
Table 2 Interfacial energy of G–O/EPDM(/PR) composites
| 1 |
2 |
γ
12, mJ m−2 |
| EPDM |
G–O |
2.8 |
| EPDM/PR |
G–O |
7.8 |
| |

| (3) |
Table 1 shows that the contact angle of EPDM under deionized
water increased significantly after mixing with PR (Fig. S4
†), which could be attributed to the decrease of
γs which consequently reduces the adhesion between the solid and liquid surface. However, there were no obvious changes of the contact angles of EPDM(/PR) matrices after adding G–O. It can be seen that
γds slightly increased while
γps mildly decreased with the addition of 0.5 wt% G–O in EPDM. In EPDM/PR blends, low loading of G–O slightly changed both
γds and
γps. The approximately matched surface energy of G–O (43.8 mJ m
−2) and EPDM (34.0 mJ m
−2) probably contributed to the good dispersion of the G–O/EPDM composites. Furthermore, considering the decrease of
γs of EPDM(/PR) matrices after adding G–O, we would expect the potential application of G–O/EPDM(/PR) materials for low surface energy materials (
γs < 25 mJ m
−2).
Interfacial energy is another factor that may affect the dispersion of G–O in EPDM(/PR) matrices. As observed in Table 2, the interfacial energy between EDPM and G–O was low, which further demonstrates that G–O was prone to disperse in EPDM. The interfacial energy between EPDM/PR blends and G–O was a little higher than that between EPDM and G–O, suggesting that the dispersion of G–O in EPDM matrix was better than that in EPDM/PR blends.
3.4. Mechanical properties of the G–O/EPDM(/PR) composites
It was expected that the mechanical properties of the composites would be enhanced due to the large aspect ratio of G–O nanosheets and good dispersion of G–O in EPDM(/PR) matrices. The mechanical properties of G–O/EPDM and G–O/EPDM/PR composites are summarized in Table 3 and Table S1†. As shown in Fig. 4, the addition of G–O into EPDM led to a significant improvement of the mechanical properties. The tensile strength of EPDM increased from 2.1 MPa to 3.2 MPa and the tensile modulus increased 133% by incorporating 0.5 wt% G–O. While in the case of EPDM/PR blends, the tensile strength and tensile modulus showed almost no change with the addition of 0.2 wt% and 0.5 wt% G–O. The addition of 0.5 wt% G–O enhanced elongation at break in both the EPDM and the EPDM/PR blends by 33% and 18%, respectively. In lots of other researches, the elongation at break was diminished severely with the addition of graphene-based materials into polymers.3 Therefore, the increment of elongation at break was meaningful for G–O/polymers composites. This phenomenon was possible because the addition of G–O caused a dilution effect25 in the EPDM/PR matrices, i.e. the volume fraction of rubber matrix decreased with increasing G–O loading, which would lead to a decrease of crosslinking of G–O/EPDM/PR composites if there were no other bonds created between the polymer matrix and the fillers and then an increase of the elongation at break. Meanwhile, the high modulus of G–O compensating the decrease of crosslinking led to little change in the tensile strength of the G–O/EPDM/PR composites. It is worth mentioning that the simultaneous improvements of tensile strength and elongation at break with low G–O loadings (0.5 wt%) were valuable for the composites.
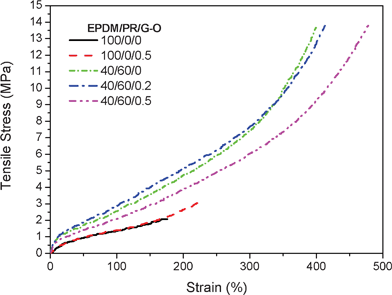 |
| | Fig. 4 Representative stress-strain behavior for G–O/EPDM(/PR) composites | |
Table 3 Mechanical properties of G–O/EPDM(/PR) composites
| Matrix |
G–O content (wt%) |
Stress at 100%, MPa |
Tensile modulus, MPa |
Elongation at break (%) |
Tensile stress, MPa |
| EPDM |
0 |
1.4 ± 0.1 |
55.7 ± 21.3 |
166 ± 7 |
2.1 ± 0.1 |
| 0.5 |
1.3 ± 0.1 |
130.8 ± 22.9 |
220 ± 10 |
3.2 ± 0.4 |
| EPDM/PR |
0 |
2.5 ± 0.1 |
110.6 ± 10.6 |
410 ± 10 |
13.5 ± 0.2 |
| 0.2 |
2.2 ± 0.5 |
76.1 ± 38.3 |
414 ± 1 |
13.1 ± 0.6 |
| 0.5 |
1.8 ± 0.4 |
110.6 ± 11.6 |
484 ± 8 |
13.6 ± 0.3 |
3.5. Dynamic mechanical properties of G–O/EPDM(/PR) composites
We believed that the increase of elongation at break was due to the dilution effect, which was considered to affect the mobility of EPDM polymer chains. On the other hand, the extremely high surface area of G–O contributing to filler–matrix friction was expected to improve the damping properties of the polymer composites. To confirm this, DMA was used to investigate the effects of G–O on the damping properties of the EPDM(/PR) composites. The damping properties of the G–O/EPDM(/PR) composites are shown in Fig. 5 and summarized in Table S2†. In Fig. 5, the EPDM/PR blend exhibited only one tan δ peak, indicating that PR and EPDM had good compatibility. Although it showed some phase separation phenomena in EPDM/PR blends from the SEM image in Fig. 2e–h, the size of the dispersed phases was too small to form a single tan δ peak.26 Compared with pure EPDM, EPDM/PR blend displays higher tan δ peak value, higher glass transition temperature (Tg) and wider efficient temperature range (tan δ > 0.3) due to the reinforcing effect of PR. For the G–O/EPDM composite, the addition of 0.5 wt% G–O into EPDM led the Tg to decrease from −23.8 °C to −25.3 °C. It was possible because the G–O diluted the physical entanglement network of EPDM. It can also be observed that the tan δ peak value increased slightly and the efficient temperature range broadened, which might be ascribed to the friction between G–O and EPDM. Briefly, a large amount of filler–matrix friction which was due to the extremely high surface area of G–O outweighed the diluting effect of G–O, thus G–O was expected to improve the damping properties of the EPDM matrix. For the G–O/EPDM/PR composites, the Tg shifted to a higher temperature by the addition of G–O in the EPDM/PR blends, indicating that G–O restrained the chain mobility of the EPDM/PR blends to some extent under low-strain tension mode. Moreover, it is evident that the tan δ peak value enhanced from 0.67 to 0.75 and the efficient temperature range broadened simultaneously when the G–O content was 0.2 wt%, which was possible due to the π–π interaction between the π-conjugated network on the surface of G–O and the aromatic groups of PR. Here, a novel approach was provided to improve the damping properties of polymer matrices by low G–O loading.
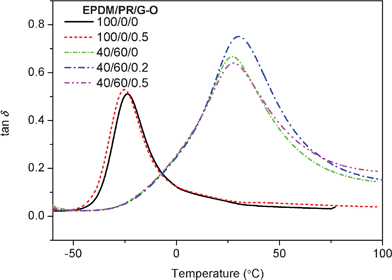 |
| | Fig. 5 Tan δ of G–O/EPDM(/PR) composites as a function of temperature at 10 Hz | |
3.6. Thermal properties of G–O/EPDM(/PR) composites
Besides the mechanical and damping properties, we further investigated the effects of G–O on the thermal properties of EPDM(/PR) composites. As shown in Fig. 6 and Table S3†, the TGA results demonstrate that the decomposition of pure EPDM took place in a single step and it started at 433 °C. Both TGA and the first derivative curves (DTGA) [Fig. 6b] shifted slightly towards lower temperatures at 0.5 wt% G–O loading in EPDM. As listed in Table S3†, the temperature at 5 wt% loss (T5), the onset temperature (Tonset‡) and peak temperature (Tp§) slightly decreased when 0.5 wt% G–O was added into EPDM compared with pure EPDM. The thermal stability showed no significant change with the addition of G–O in EPDM/PR blends. There were two conflicting factors affecting the thermal stability. On one hand, the high aspect ratio of monodispersed graphene layers that acted as the barrier and inhibited the emission of small gaseous molecules, contributed to better thermal stability.28 On the other hand, the presence of potassium salt impurities caused a catastrophic reduction of the thermal stability due to self-propagating reduction from G–O.29 Therefore, the thermal properties of the G–O/EPDM(/PR) composites showed little change by incorporating low loading of G–O.
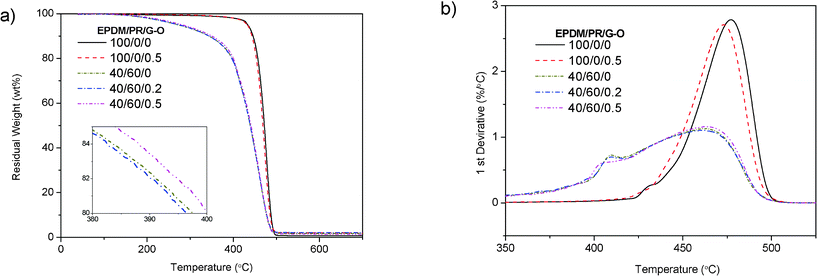 |
| | Fig. 6 a) TGA curves of G–O/EPDM(/PR) composites, the inset is an enlarged part of the thermal properties of G–O/EPDM/PR composites and b) corresponding DTG curves of G–O/EPDM(/PR) composites | |
4. Conclusions
Well-dispersed G–O/EPDM(/PR) composites were successfully prepared via the combination of solution mixing and two-roll mill mixing. The matched surface energy as well as low interfacial energy of EPDM and G–O probably contributed to the good dispersion of EPDM(/PR) composites. These results would provide valuable guidance for evaluating the dispersion of G–O in polymer matrices through surface energy and interfacial energy. Furthermore, the addition of 0.5 wt% G–O increased the tensile modulus, tensile strength and elongation at the break of the G–O/EPDM composite. Low G–O loading improved the damping properties of the EPDM(/PR) matrices, which provided a novel approach to prepare damping materials. However, the thermal stability of EPDM(/PR) mildly decreased with low G–O loading.
Acknowledgements
Financial support from the National Natural Science Foundation of China (Project numbers 51073092).
References
- Y. Zhu, S. Murali, W. Cai, X. Li, J. W. Suk, J. R. Potts and R. S. Ruoff, Adv. Mater., 2010, 22, 3906–3924 CrossRef CAS.
- A. K. Geim and K. S. Novoselov, Nat. Mater., 2007, 6, 183–191 CrossRef CAS.
- H. Kim, A. A. Abdala and C. W. Macosko, Macromolecules, 2010, 43, 6515–6530 CrossRef CAS.
- O. C. Compton and S. T. Nguyen, Small, 2010, 6, 711–723 CrossRef CAS.
- S. Wang, M. Tambraparni, J. Qiu, J. Tipton and D. Dean, Macromolecules, 2009, 42, 5251–5255 CrossRef CAS.
- J. Liang, Y. Huang, L. Zhang, Y. Wang, Y. Ma, T. Guo and Y. Chen, Adv. Funct. Mater., 2009, 19, 2297–2302 CrossRef CAS.
- L. Zhang, Z. Wang, C. Xu, Y. Li, J. Gao, W. Wang and Y. Liu, J. Mater. Chem., 2011, 21, 10399 RSC.
- H. Kim, Y. Miura and C. W. Macosko, Chem. Mater., 2010, 22, 3441–3450 CrossRef CAS.
- J. Wang, H. Hu, X. Wang, C. Xu, M. Zhang and X. Shang, J. Appl. Polym. Sci., 2011, 122, 1866–1871 CrossRef CAS.
- X. Bai, C. Wan, Y. Zhang and Y. Zhai, Carbon, 2011, 49, 1608–1613 CrossRef CAS.
- Y. Li, Q. Wang, T. Wang and G. Pan, J. Mater. Sci., 2012, 47, 730–738 CrossRef CAS.
- H. Lian, S. Li, K. Liu, L. Xu, K. Wang and W. Guo, Polym. Eng. Sci., 2011, 51, 2254–2260 CAS.
- Y. Zhan, J. Wu, H. Xia, N. Yan, G. Fei and G. Yuan, Macromol. Mater. Eng., 2011, 296, 590–602 CrossRef CAS.
- C. D. Gamlin, N. K. Dutta and N. R. Choudhury, Polym. Degrad. Stab., 2003, 80, 525–531 CrossRef CAS.
- X. Mao, S. Xu and C. Wu, Polym.-Plast. Technol. Eng., 2008, 47, 209–214 CrossRef CAS.
- W. S. Hummers and R. E. Offeman, J. Am. Chem. Soc., 1958, 80, 1339–1339 CrossRef CAS.
- I. Srivastava, R. J. Mehta, Z.-Z. Yu, L. Schadler and N. Koratkar, Appl. Phys. Lett., 2011, 98, 063102–063103 CrossRef.
- Z. H. Ni, W. Chen, X. F. Fan, J. L. Kuo, T. Yu, A. T. S. Wee and Z. X. Shen, Phys. Rev. B: Condens. Matter Mater. Phys., 2008, 77, 115416 CrossRef.
- M. A. López-Manchado, J. Biagiotti, L. Valentini and J. M. Kenny, J. Appl. Polym. Sci., 2004, 92, 3394–3400 CrossRef.
- V. G. Hadjiev, M. N. Iliev, S. Arepalli, P. Nikolaev and B. S. Files, Appl. Phys. Lett., 2001, 78, 3193–3195 CrossRef CAS.
- Y. Hernandez, V. Nicolosi, M. Lotya, F. M. Blighe, Z. Sun, S. De, I. T. McGovern, B. Holland, M. Byrne, Y. K. Gun'Ko, J. J. Boland, P. Niraj, G. Duesberg, S. Krishnamurthy, R. Goodhue, J. Hutchison, V. Scardaci, A. C. Ferrari and J. N. Coleman, Nat. Nanotechnol., 2008, 3, 563–568 CrossRef CAS.
-
(a) M. Sumita, K. Sakata, S. Asai, K. Miyasaka and H. Nakagawa, Polym. Bull., 1991, 25, 265–271 CrossRef CAS;
(b)
S. Wu
, Polymer Interface and Adhesion, Marcel Dekker Inc., New York, 1982 Search PubMed.
- Z. Xu, Y. Huang, C. Zhang, L. Liu, Y. Zhang and L. Wang, Compos. Sci. Technol., 2007, 67, 3261–3270 CrossRef CAS.
- S. Wang, Y. Zhang, N. Abidi and L. Cabrales, Langmuir, 2009, 25, 11078–11081 CrossRef CAS.
- P. Sae-oui, C. Sirisinha, U. Thepsuwan and K. Hatthapanit, Eur. Polym. J., 2007, 43, 185–193 CrossRef CAS.
- A. Mousa, G. Heinrich, U. Gohs, R. Hässler and U. Wagenknecht, Polym.-Plast. Technol. Eng., 2009, 48, 1030–1040 CrossRef CAS.
- J. R. Potts, D. R. Dreyer, C. W. Bielawski and R. S. Ruoff, Polymer, 2011, 52, 5–25 CrossRef CAS.
- T. Kuila, S. Bose, C. E. Hong, M. E. Uddin, P. Khanra, N. H. Kim and J. H. Lee, Carbon, 2011, 49, 1033–1037 CrossRef CAS.
- F. Kim, J. Luo, R. Cruz-Silva, L. J. Cote, K. Sohn and J. Huang, Adv. Funct. Mater., 2010, 20, 2867–2873 CrossRef CAS.
Footnotes |
| † Electronic Supplementary Information (ESI) available. See DOI: 10.1039/c2ra01212j/ |
| ‡ Tonset :onset temperature, calculated from the TGA curves by extrapolating from the curve at the peak of degradation back to the initial weight of the sample;27 |
| § Tp: temperature at maximum loss rate.6 |
|
| This journal is © The Royal Society of Chemistry 2012 |
Click here to see how this site uses Cookies. View our privacy policy here. ![[thin space (1/6-em)]](https://www.rsc.org/images/entities/char_2009.gif) :
:![[thin space (1/6-em)]](https://www.rsc.org/images/entities/char_2009.gif) 3 by weight and the G–O contents were varied to 0, 0.2 wt%, 0.5 wt%.
3 by weight and the G–O contents were varied to 0, 0.2 wt%, 0.5 wt%.