La0.67Sr0.33MnO3 nanofibers for in situ, real-time, and stable high temperature oxygen sensing
Yixin
Liu
a,
Yu
Ding
a,
Haiyong
Gao
b,
Lichun
Zhang
b,
Puxian
Gao
ab,
Baikun
Li
c and
Yu
Lei
*a
aDepartment of Chemical, Materials and Biomolecular Engineering, University of Connecticut, Storrs, CT 06269, USA. E-mail: ylei@engr.uconn.edu; Tel: +1 8604864554; Fax: +1 8604862959
bInstitute of Material Science, University of Connecticut, Storrs, CT 06269, USA
cDepartment of Civil and Environmental Engineering, University of Connecticut, Storrs, CT 06269, USA.
First published on 14th February 2012
Abstract
By calcining electrospun La(NO3)3–Sr(NO3)2–Mn(NO3)2–PVP precursory nanofibers, La0.67Sr0.33MnO3 (LSMO) nanofibers have been successfully fabricated on a large scale. The as-prepared LSMO nanofibers with an average diameter of ∼126 nm displayed a homogenous perovskite phase with a rough surface and porous structure. The LSMO nanofibers were thermally stable in terms of composition and crystalline structure after multiple heating/cooling cycles between room temperature and 1000 °C, accompanied by a slightly increased grain size. The LSMO nanofibers were applied for in situ real-time oxygen sensing at 800 °C and showed sensitive, reversible and reproducible response towards oxygen with a detection limit as low as 3.5 ppb (S/N = 3). These results suggest that electrospun LSMO nanofibers are a promising nanomaterial for the design and fabrication of stable high temperature gas sensors.
Introduction
Concerns over energy savings, gas pollution and corresponding public health issues have been driving worldwide research in the field of gas sensors for many years with the goal of improving combustion efficiency and minimizing emissions from various industrial sources. Recently, there is a special demand for the development of sensitive, reliable, robust and low-cost gas sensors for applications in harsh industrial environments found in automotive, aerospace, glass, ceramic, petrochemical and food-processing industries.1 According to a U.S. Department of Energy report, harsh environment sensors, if successfully employed, are predicted to save 0.25 quadrillion BTU year−1 of energy across all energy-consuming industries.1,2 Among all types of harsh industrial environments (e.g., temperature, pressure, pH, etc.), the high temperature environment in combustion processes is the most common one. Thus, in situ real-time monitoring and control of combustion-related gases are a top priority in many industrial applications, which can not only improve the efficiency of combustion, but also reduce the emission of pollutants.3–5 However, such measurements usually require the sensors to be operated at high temperature environment (800–1000 °C). For example, in close proximity to engines, the exhaust gases can reach temperatures close to 1000 °C,6 which require superior thermal stability of in situ sensor devices, including the sensing materials, electrodes and also the supporting substrates. To date, commercially available sensor technology for such harsh environment is extremely limited due to the high requirements for sensing materials and sensor performance. Therefore, there is an urgent need to develop fast, sensitive, robust, and cost-effective high temperature gas sensors for control and monitoring of power and fuel systems. The usual target gases for high temperature applications are oxygen (O2), carbon monoxide (CO), carbon dioxide (CO2), nitrogen oxide (NOx), hydrocarbons (HCs), and volatile organic compounds (VOCs). Due to the importance of oxygen in combustion environment, this study will focus on high temperature oxygen detection using novel nanostructured perovskite oxides.Perovskite oxides are a group of materials that have drawn much attention due to their potential applications as high temperature gas sensors, solid electrolyte, oxygen ion and proton conductors, fuel cell, catalysis, and hydrogen membranes.7 The ABO3 perovskite structure can form a wide variety of oxides with transport properties ranging from predominantly ionic conduction to predominantly electronic conduction, which are, respectively, suitable for potentiometric and resistor-type gas sensors.8 Perovskite oxides are particularly attractive for high temperature applications due to three-fold reasons. First, they have high melting and/or decomposition temperatures (e.g. SrTiO3, BaTiO39 and LaCrO310 exhibited excellent stability even after being exposed to reducing atmosphere at temperatures as high as 1200 K); second, they have microstructural and morphological stability to improve reliability of long-term sensor performance in a high temperature environment;8 third, a number of combinations of metal cations can be accommodated within the perovskite structure,11 which has given the ABO3 system flexible doping ability in terms of controlling the transport and catalytic properties to optimize sensor performance. The catalytic activity of the perovskite oxides is mainly determined by the B-site cations and combination of two specific different ions at the B-site could bring about synergistic effects resulting in enhanced catalyst activity.12 On the other hand, the substitution of A-site cations usually affects the oxidation states of the B-site cations and/or creates non-stoichiometric oxygen to control the catalytic performance.13 This doping flexibility allows the design of perovskite oxides with controlled transport and catalytic properties towards particular target gases, leading to improved gas sensing performance at high temperature.
A variety of perovskite oxides have been employed to detect different combustion related gases. SrTiO3 and doped SrTiO3 based sensors were intensively reported for oxygen sensing.14–16 Other perovskite oxides, such as CaTiO3,17,18 were also investigated as candidates for high temperature oxygen sensors. The general oxygen sensing mechanism for metal oxides at high temperature is based on the reactions between oxygen and defect points in the sensing material, such as oxygen and/or metal vacancies. Depending on the charge carrier of the sensing material (electrons or holes), the conductivity of the sensor will decrease for n-type semiconductors and increase for p-type semiconductors upon exposure to oxygen. By measuring the resistance change of the sensor, oxygen concentration can be obtained. However, most of the high temperature resistor-type oxygen sensor studies only focused on the relationship between conductivity and oxygen partial pressure rather than in situ, real-time detection.
Nanostructured materials can provide a large specific surface, resulting in enhanced sensitivity.19 There are several methods to fabricate one-dimensional nanostructures, which have been comprehensively reviewed recently,20,21 such as lithography, template methods and electrospinning. Among them, electrospinning is an efficient, easy processing and low cost way to produce polymer and composite fibers with diameters ranging from several nanometers to a few micrometers and can be broadly applied to lots of fields.22 Recently, it has been successfully used to develop multifunctional fiber structure composite materials, such as magnetic fibers 23–25 and fluorescent fibers.26,27 By incorporating metal salts into polymers, one-dimensional nanostructured metal oxides can be fabricated by calcination following electrospinning.28 Nanofibers fabricated via electrospinning have specific surface approximately one to two orders of the magnitude larger than flat films, making them excellent candidates for potential applications in sensors.19
In this study, novel perovskite La0.67Sr0.33MnO3 (LSMO) nanofibers were prepared by a facile electrospinning technique followed by calcination. After calcination, polycrystalline LSMO can be formed through thermal decomposition.29 The morphology of the obtained LSMO nanofibers was investigated by scanning electron microscope (SEM) and transmission electron microscope (TEM), while the composition and crystal structure of the as-prepared sample were characterized by high resolution TEM and X-Ray diffraction (XRD). A thermally stable LSMO nanofibers-based resistor-type sensor was further fabricated on an alumina ceramic tube and its application for in situ sensitive, stable, reversible and real-time detection of oxygen at an operating temperature of 800 °C was also demonstrated for the first time. The developed high temperature oxygen sensor with good sensitivity and thermal stability indicates its potential application in harsh environments.
Experimental
Reagents
Lanthanum(III) nitrate hexahydrate (La(NO3)3·6H2O), strontium nitrite (Sr(NO3)2), and dimethylformamide (DMF) were purchased from Acros Organics. Manganese(II) nitrate tetrahydrate (Mn(NO3)2·4H2O) and poly(vinyl pyrrolidone) (PVP, MW = 1![[thin space (1/6-em)]](https://www.rsc.org/images/entities/char_2009.gif) 300
300![[thin space (1/6-em)]](https://www.rsc.org/images/entities/char_2009.gif) 000) were obtained from Sigma-Aldrich. For gas sensing studies, high purity nitrogen gas and oxygen/nitrogen gas mixtures (97 ppm oxygen or 10% oxygen in nitrogen) were ordered from Airgas.
000) were obtained from Sigma-Aldrich. For gas sensing studies, high purity nitrogen gas and oxygen/nitrogen gas mixtures (97 ppm oxygen or 10% oxygen in nitrogen) were ordered from Airgas.
Preparation of LSMO nanofibers
To prepare the precursory solution for La0.67Sr0.33MnO3, the total weight of 0.386 g metal salts (the molar ratio of La(NO3)3·6H2O, Sr(NO3)2 and Mn(NO3)2·4H2O is 0.67![[thin space (1/6-em)]](https://www.rsc.org/images/entities/char_2009.gif) :
:![[thin space (1/6-em)]](https://www.rsc.org/images/entities/char_2009.gif) 0.33
0.33![[thin space (1/6-em)]](https://www.rsc.org/images/entities/char_2009.gif) :
:![[thin space (1/6-em)]](https://www.rsc.org/images/entities/char_2009.gif) 1) were dissolved in 3 mL DMF and 0.2 mL water and then 0.386 g PVP was added, followed by stirring. The final homogeneous mixture was loaded into a plastic syringe with a 23-gauge needle for electrospinning. The La(NO3)3–Sr(NO3)2–Mn(NO3)2–PVP nanofibers were fabricated by electrospinning with a flow rate of 0.3 mL h−1 at an applied voltage of 20 kV over a collection distance of 15 cm. The precursory nanofibers were then calcined in air at 800 °C for 3 h in order to remove the matrix polymer, decompose the salts, and generate LSMO nanofibers, denoted as LSMO(800). To study the thermal stability, the as-prepared LSMO(800) nanofibers were first annealed at 1000 °C in air for 5 h followed by naturally cooled down to room temperature, and the whole process was repeated three times. After three cycles of heating and cooling treatment, the final product was denoted as LSMO(1000) and then subject to further characterization.
1) were dissolved in 3 mL DMF and 0.2 mL water and then 0.386 g PVP was added, followed by stirring. The final homogeneous mixture was loaded into a plastic syringe with a 23-gauge needle for electrospinning. The La(NO3)3–Sr(NO3)2–Mn(NO3)2–PVP nanofibers were fabricated by electrospinning with a flow rate of 0.3 mL h−1 at an applied voltage of 20 kV over a collection distance of 15 cm. The precursory nanofibers were then calcined in air at 800 °C for 3 h in order to remove the matrix polymer, decompose the salts, and generate LSMO nanofibers, denoted as LSMO(800). To study the thermal stability, the as-prepared LSMO(800) nanofibers were first annealed at 1000 °C in air for 5 h followed by naturally cooled down to room temperature, and the whole process was repeated three times. After three cycles of heating and cooling treatment, the final product was denoted as LSMO(1000) and then subject to further characterization.
Characterization of LSMO nanofibers
A JEOL 6335F field-emission scanning electron microscope was employed to examine the morphology and the size of the as-electrospun nanofibers before and after calcination. More detailed morphology and selected area electron diffraction (SAED) patterns were studied using a Tecnai T12 transmission electron microscope operated at 120 kV. High resolution TEM (HRTEM) was performed on JEOL 2010 FasTEM. XRD patterns of the as-prepared samples were obtained with an Oxford diffraction XcaliburTM PX Ultra with ONYX detector. Energy dispersive X-ray spectrometer (EDX) attached with the TEM was used to characterize the composition of grown nanofibers.Sensor fabrication and testing system
Resistor-type LSMO nanofibers-based high temperature gas sensor was fabricated in-house and the schematic was presented in Fig. 1(top). Briefly, a 500 μm dent was drilled at one end of an alumina ceramic tube containing two through holes. The holes were used to hold and fix two Ni/Cr alloy wires, which served as two electrodes, while the calcined LSMO nanofibers were filled into the small dent and closely contacted with the electrodes, thus completing the fabrication of the sensing device. In order to demonstrate the in situ, real-time sensing properties of the as-fabricated sensor, the device was placed in the center of a furnace, which can control and maintain temperature up to 1200 °C and also connect with a dynamic gas flow system, as illustrated in Fig. 1(bottom). The two electrodes were connected out to a CHI 601C Electrochemical Workstation (CH Instrument, USA) for continuous recording of the current output. The sensor circuit was subjected to a fixed 1 V DC bias and the electric resistance of the sensor was calculated by applying Ohm's Law (R = V/I). The sensor was heated from room temperature to 800 °C in air with a heating rate of 20 °C min−1 and its resistances at different temperatures were measured by I–V curves to investigate the temperature-dependent resistance of the LSMO nanofibers-based sensor.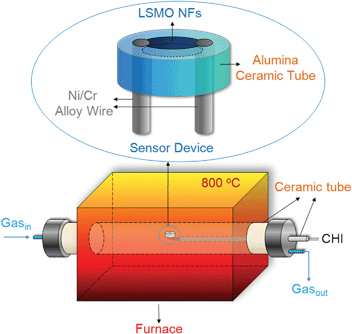 | ||
| Fig. 1 Schematic of the LSMO nanofibers-based sensor device (top) and the in situ high temperature gas sensing system (bottom). | ||
Oxygen sensing at high temperature
The responses of the LSMO nanofibers-based sensor to oxygen at 800 °C were evaluated by measuring the resistance change upon exposure to various concentrations of oxygen in a dynamic gas flow system under a constant gas flow rate of 1.5 L min−1, which was regulated by a computer-controlled gas mixing system (S-4000, Environics Inc., USA). High purity nitrogen was used as carrier gas to obtain oxygen mixture with concentrations ranging from 100 ppb to 1%. In a typical experiment, the device was first exposed to oxygen/nitrogen mixture for 7 min, followed by high purity nitrogen for 13 min to recover the sensor, and then the cycle was repeated. The normalized resistance change is defined as ΔR/R0% = [(R − R0)/R0] × 100%, where R0 is the initial electrical resistance of the sensor in high purity nitrogen and R is the measured real-time resistance upon exposure to oxygen/nitrogen mixture or nitrogen. As the exposure of LSMO nanofibers to oxygen increases its conductivity, the sign of ΔR/R0 % is always negative. All experiments were carried out at 800 °C.Results and discussion
Characterization of the nanofibers before and after calcination
SEM was first employed to investigate the morphologies of the La(NO3)3–Sr(NO3)2–Mn(NO3)2–PVP precursory nanofibers and the corresponding calcined La0.67Sr0.33MnO3 product.Fig. 2A presents typical SEM images of electrospun precursory nanofibers and its inset shows the SEM image with a higher magnification. One can see that the precursory nanofibers were uniform with an average diameter of 205 ± 33 nm and smooth surface. After calcination in air at 800 °C for 3 h, the PVP matrix was completely degraded and the metal salts were decomposed to oxides. As shown in Fig. 2B, the calcined samples retained the nanofibrous structure with a reduced average diameter of 126 ± 28 nm but the surfaces were no longer smooth due to the loss of polymer matrix and the crystallization of LSMO. The small diameter and the rough surface can provide large surface area and the porous structure can minimize the hindrance for mass transfer, which could improve subsequent gas sensing performance.30
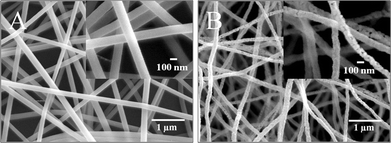 | ||
| Fig. 2 Typical SEM images of (A) La(NO3)3–Sr(NO3)2–Mn(NO3)2–PVP nanofibers; (B) LSMO(800) nanofibers (obtained after calcination of precursor nanofibers at 800 °C). Insets show the images with a higher magnification. | ||
The detailed morphology and structure of the as-prepared LSMO(800) nanofibers were further characterized by TEM, as shown in Fig. 3A. Small crystallites and nanoscale pores can be observed in the nanofibers, which was in good agreement with SEM results. The selected area electron diffraction (SAED) pattern shows a typical ring pattern, suggesting the polycrystalline structure of the nanofibers (Fig. 3B). The presence of La, Sr, Mn, and O elements were revealed by the EDX spectrum, as shown in Fig. 3C. The carbon peak and Cu peak presented in Fig. 3C can be attributed to the copper–carbon grid used for holding the nanofiber samples under the TEM.
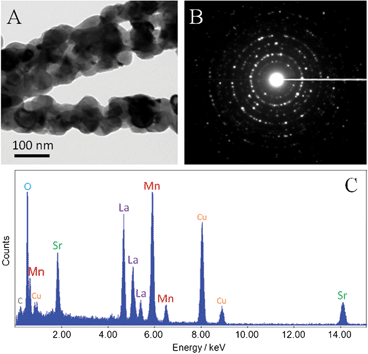 | ||
| Fig. 3 (A) A typical TEM image, (B) SAED pattern and (C) EDX analysis of LSMO(800) nanofibers (C and Cu peaks in EDX are ascribed to the copper–carbon grid for TEM). | ||
HRTEM was also carried out to identify the crystal structure and composition of LSMO(800) nanofibers, whose lattice images are presented in Fig. 4. The crystal structure of individual crystallite was identified using fast Fourier transform (FFT) analysis of their lattice images, as shown in the corresponding insets. The results are in good agreement with the typical characteristics of rhombohedral LSMO (JCPDS 54-1195), which suggested a homogenous LSMO phase in the as-prepared nanofibers rather than a mixture of oxides after calcination at 800 °C. The revealed interplanar distances between lattice fringes in Fig. 4A, 4B, and 4C are 3.88, 2.74 and 2.24 Å, respectively, corresponding to the (012), (104) and (202) planes of rhombohedral LSMO.
 | ||
| Fig. 4 HRTEM lattice images of LSMO(800) nanofiber. Insets show the FFT of the corresponding area boxed with a dashed-line. | ||
The composition and crystal structure were further characterized by XRD (Fig. 5). The XRD pattern of LSMO(800) nanofibers matches the standard spectrum of JCPDS 54-1195. The formation of rhombohedral structured LSMO was confirmed by the diffraction peaks at 2θ values of 22.91, 32.70, 40.18, 40.47, 46.92, 52.83, 58.16, 68.58° corresponding to (012), (104), (202), (006), (024), (116), (214) and (208) crystal planes, respectively. To investigate its high temperature stability, the as-prepared LSMO(800) nanofibers were annealed at 1000 °C and then cooled down to room temperature and the heating/cooling cycle was repeated three times. As shown in Fig. 5, the XRD pattern of LSMO(1000), which was subjected to three-time annealing at 1000 °C, displays the exactly same pattern as that of LSMO(800) and no peak shift is observed, indicating the good thermal stability of the sample in terms of composition and crystal structure. The morphology of the annealed sample was further investigated and shown in the inset SEM images. One can see that the sample still maintains a nanofibrous structure after thermal stability experiments. However, slightly increased grain size in LSMO nanofibers was observed, which might be ascribed to thermal mass migration over the annealing process.
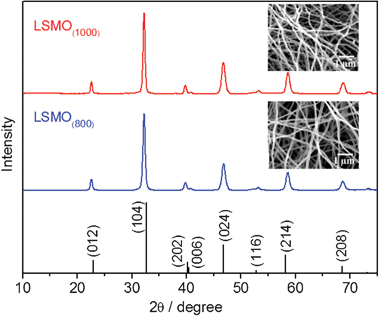 | ||
| Fig. 5 XRD patterns for the as-prepared LSMO(800) and LSMO(1000) obtained after thermal stability study and the standard values for La0.65Sr0.35MnO3. Insets show the SEM images of LSMO(800) and LSMO(1000). | ||
Resistance of LSMO(800)versus temperature
The temperature-dependent resistance of the as-prepared LSMO(800) nanofibers in air was further investigated by increasing the temperature from room temperature to 800 °C. The I–V profiles of LSMO(800) nanofibers-based sensor at different temperatures were presented in Fig. 6A, implying enhanced conductance with increased temperature. The I–V straight lines indicate that the LSMO(800) nanofibers-based sensor obeys Ohm's Law. Fig. 6B shows the Arrhenius plot for the sensor, which falls on a straight line, suggesting that the conduction follows the mechanism of a small polaron hopping.31 At a temperature in the range of 300–400 K (1000/T = 2.5–3.3 K−1), the plots are relatively irregular due to the paramagnetic–ferromagnetic transition.31–33 The relationship between temperature and hopping conduction can be expressed as: ρT ∝ exp[−Ea/(kT)]. Based on the slope of the plot, calculated activation energy for electrical conduction of LSMO(800) nanofibers is 17.5 kJ mol−1, which is in good agreement with the literature reports.34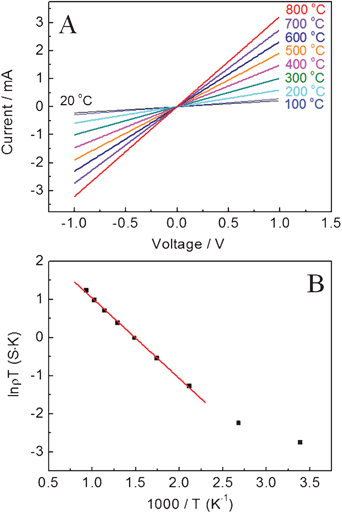 | ||
| Fig. 6 (A) I–V profiles of the LSMO(800) nanofibers-based sensor at different temperatures from room temperature to 800 °C. (B) The temperature dependence of sensor conductance (ρ) of LSMO(800) in air. | ||
Oxygen sensing at 800 °C
As the as-prepared LSMO(800) nanofiber shows good high temperature stability, it was employed for in situ oxygen detection at 800 °C.Fig. 7 represents typical electrical responses of the LSMO(800) nanofibers as a function of time upon periodic exposure to gaseous oxygen (with concentrations of 500 ppb, 800 ppm and 1%) balanced in high purity N2. High purity N2 was also used to recover the sensor. Upon exposure to oxygen, the LSMO(800) nanofibers show fast, reproducible, sensitive and concentration-dependent responses to oxygen, suggesting that LSMO(800) nanofiber is a good sensing element for oxygen detection at high temperature. By purging with nitrogen, the response of LSMO(800) nanofibers can be completely recovered, indicating the quick desorption of oxygen molecules from the LSMO(800) nanofibers and the good reproducibility of LSMO(800) nanofibers based sensor. In addition, no baseline drifting was observed for repeated operation, indicating good stability. The good performance and fast response/recovery can be attributed to the highly porous structure of sensing material and nanoscale size in LSMO(800), in which the porous structure allows the free access of oxygen molecules to LSMO with reduced diffusion resistance. In addition, long range charge carrier transfer along the nanofibers can also be achieved, which may improve the charge carrier transfer efficiency, resulting enhanced sensing performance. The response time (t90) of the sensor towards 1% oxygen is 53 s, which is defined as the time when the normalized resistance change reached 90% of the maximum response after exposure to oxygen. The response time is typically longer towards lower concentration oxygen, since it is slower to reach equilibrium at lower oxygen partial pressure.
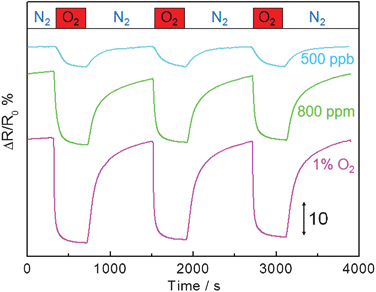 | ||
| Fig. 7 Typical responses of LSMO nanofibers based sensor device to periodic exposure to 500 ppb, 800 ppm and 1% oxygen at an applied DC bias of 1 V at 800 °C. The red bar indicates 7 min exposure time with oxygen (500 ppb, 800 ppm and 1%) followed by 13 min recovery time with nitrogen. | ||
The conductivity of the LSMO nanofibers increased upon exposure to oxygen, implying a p-type behavior. Based on the literature reports, the electronic conduction in La1−xSrxMnO3±δ is p-type irrespective of the oxygen content (δ > 0 and δ < 0).34 The oxygen content remains at its stoichiometric composition (δ = 0) at intermediate oxygen partial pressures (10−5–10−10 Pa).35 In the detection range, which was above 10−5 Pa, LSMO was in the oxygen excess region (δ > 0), where the cation vacancies are responsible for the oxygen-excess nonstoichiometry.32,36,37 Considering the misplaced atom like LaXMn, denoted for La(Mn-lattice site), is rare as the migration energy would be huge due to the large ionic radius difference between La and Mn, following defect reaction equation may not be favorable:
 | (1) |
Therefore, the sensing mechanism can be explained using a more reasonable defect reaction equation as follow:
 | (2) |
With the increase of oxygen concentration, the above equation shifts to the right and generates more holes and cation vacancies, thus resulting in the increase of conductivity, in good agreement with the experimental results. On the other hand, N2-purging (or removal of O2) could shift the equation to left side, thus bringing the conductivity back to the original level and regenerating the sensor. No baseline drift observed in Fig. 7 also indicates the excellent reversibility of this reaction.
Based on the sensing mechanism of LSMO nanofibers, the developed resistor-type sensor can distinguish oxidizing gas (O2, NOx) and reducing gas (CO, H2, HCs) by producing reverse responses. However, the selectivity within the same group gas is still challenging for high temperature gas sensors. The selectivity of the sensor can be improved by incorporation of catalyst doping and other sensing technologies.
Fig. 8 presents the calibration curve of LSMO nanofibers towards oxygen in the concentration range of 100 ppb to 800 ppm. It can be noticed that at low oxygen concentration (inset of Fig. 8), a linear relationship between the normalized resistance response and O2 concentration was revealed. Meanwhile, the normalized resistance change increased with increasing O2 concentration and then gradually reached a plateau at high oxygen concentration. The limit of detection was estimated to be 3.5 ppb at a signal-to-noise ratio of 3. These results demonstrate the potential application of LSMO nanofibers in high temperature oxygen sensing.
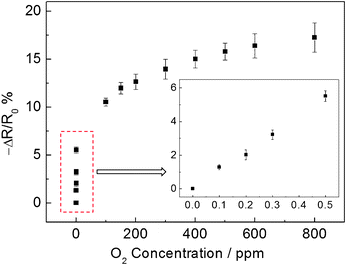 | ||
| Fig. 8 Calibration curve of the LSMO nanofibers based sensor device for oxygen at an applied DC bias of 1 V and an operating temperature of 800 °C. The inset shows the calibration curve at low oxygen concentrations. | ||
Conclusions
In summary, LSMO nanofibers have been successfully fabricated using a two-step synthetic procedure, which consists of electrospinning of La(NO3)3–Sr(NO3)2–Mn(NO3)2–PVP precursory nanofibers and a subsequent calcination process. The formed perovskite LSMO nanofibres exhibit a homogenous phase with good thermal stability up to 1000 °C. The as-prepared LSMO nanofibers presented an average diameter of ∼126 nm, with a rough surface and porous structure. Resistive type LSMO nanofibers-based sensor device was then fabricated for in situ real-time oxygen sensing at 800 °C, which showed sensitive, reversible and reproducible response towards oxygen concentration change with the detection limit of 3.5 ppb (S/N = 3). The results indicate LSMO nanofiber is a promising candidate material for stable high temperature gas sensors.Acknowledgements
We greatly appreciate the funding from DOE.References
- S. Akbar, P. Dutta and C. H. Lee, Int. J. Appl. Ceram. Technol., 2006, 3, 302 CrossRef CAS.
- N. Miura, G. Y. Lu and N. Yamazoe, Solid State Ionics, 2000, 136, 533 CrossRef.
- J. W. Fergus, Sens. Actuators, B, 2008, 134, 1034 CrossRef.
- J. W. Fergus, Sens. Actuators, B, 2007, 122, 683 CrossRef.
- J. W. Fergus, Sens. Actuators, B, 2007, 121, 652 CrossRef.
- R. Moos, Int. J. Appl. Ceram. Technol., 2005, 2, 401 CrossRef CAS.
- K. Huang, H. Y. Lee and J. B. Goodenough, J. Electrochem. Soc., 1998, 145, 3220 CrossRef CAS.
- J. W. Fergus, Sens. Actuators, B, 2007, 123, 1169 CrossRef.
- M. Crespin and W. K. Hall, J. Catal., 1981, 69, 359 CrossRef CAS.
- J. L. G. Fierro and L. G. Tejuca, J. Catal., 1984, 87, 126 CrossRef CAS.
- R. J. H. Voorhoeve, D. W. Johnson, J. P. Remeika and P. K. Gallagher, Science, 1977, 195, 827 CAS.
- H. Tanaka and M. Misono, Curr. Opin. Solid State Mater. Sci., 2001, 5, 381 CrossRef CAS.
- J. J. Zhu and A. Thomas, Appl. Catal., B, 2009, 92, 225 CrossRef CAS.
- W. Menesklou, H. J. Schreiner, K. H. Hardtl and E. Ivers-Tiffee, Sens. Actuators, B, 1999, 59, 184 CrossRef.
- G. Neri, G. Micali, A. Bonavita, R. Licheri, R. Orru, G. Cao, D. Marzorati, E. M. Borla, E. Roncari and A. Sanson, Sens. Actuators, B, 2008, 134, 647 CrossRef.
- R. Meyer and R. Waser, Sens. Actuators, B, 2004, 101, 335 CrossRef.
- T. Bak, J. Nowotny, C. C. Sorrell, M. F. Zhou and E. R. Vance, J. Mater. Sci.: Mater. Electron., 2004, 15, 635 CrossRef CAS.
- M. F. Zhou, T. Bak, J. Nowotny, M. Rekas and C. C. Sorrell, J. Mater. Sci.: Mater. Electron., 2002, 13, 697 CrossRef CAS.
- B. Ding, M. R. Wang, J. Y. Yu and G. Sun, Sensors, 2009, 9, 1609 CrossRef CAS.
- S. Barth, F. Hernandez-Ramirez, J. D. Holmes and A. Romano-Rodriguez, Prog. Mater. Sci., 2010, 55, 563 CrossRef CAS.
- Y. Z. Long, M. M. Li, C. Z. Gu, M. X. Wan, J. L. Duvail, Z. W. Liu and Z. Y. Fan, Prog. Polym. Sci., 2011, 36, 1415 CrossRef CAS.
- N. Bhardwaj and S. C. Kundu, Biotechnol. Adv., 2010, 28, 325 CrossRef CAS.
- J. H. Zhu, S. Y. Wei, D. Rutman, N. Haldolaarachchige, D. R. Young and Z. H. Guo, Polymer, 2011, 52, 2947 CrossRef CAS.
- X. L. Chen, S. Y. Wei, C. Gunesoglu, J. H. Zhu, C. S. Southworth, L. Y. Sun, A. B. Karki, D. P. Young and Z. H. Guo, Macromol. Chem. Phys., 2010, 211, 1775 CrossRef CAS.
- J. H. Zhu, S. Y. Wei, X. L. Chen, A. B. Karki, D. Rutman, D. P. Young and Z. H. Guo, J. Phys. Chem. C, 2010, 114, 8844 CAS.
- J. H. Zhu, S. Y. Wei, R. Patil, D. Rutman, A. S. Kucknoor, A. Wang and Z. H. Guo, Polymer, 2011, 52, 1954 CrossRef CAS.
- S. Y. Wei, J. Sampathi, Z. H. Guo, N. Anumandla, D. Rutman, A. Kucknoor, L. James and A. Wang, Polymer, 2011, 52, 5817 CrossRef CAS.
- D. Li and Y. N. Xia, Nano Lett., 2003, 3, 555 CrossRef CAS.
- S. Daengsakul, C. Mongkolkachit, C. Thomas, S. Siri, I. Thomas, V. Amornkitbamrung and S. Maensiri, Appl. Phys. A: Mater. Sci. Process., 2009, 96, 691 CrossRef CAS.
- X. F. Song, L. Gao and S. Mathur, J. Phys. Chem. C, 2011, 115, 21730 CAS.
- J. Mizusaki, Y. Yonemura, H. Kamata, K. Ohyama, N. Mori, H. Takai, H. Tagawa, M. Dokiya, K. Naraya, T. Sasamoto, H. Inaba and T. Hashimoto, Solid State Ionics, 2000, 132, 167 CrossRef CAS.
- J. F. Mitchell, D. N. Argyriou, C. D. Potter, D. G. Hinks, J. D. Jorgensen and S. D. Bader, Phys. Rev. B: Condens. Matter, 1996, 54, 6172 CrossRef CAS.
- A. Urushibara, Y. Moritomo, T. Arima, A. Asamitsu, G. Kido and Y. Tokura, Phys. Rev. B: Condens. Matter, 1995, 51, 14103 CrossRef CAS.
- S. P. Jiang, J. Mater. Sci., 2008, 43, 6799 CrossRef CAS.
- J. Mizusaki, N. Mori, H. Takai, Y. Yonemura, H. Minamiue, H. Tagawa, M. Dokiya, H. Inaba, K. Naraya, T. Sasamoto and T. Hashimoto, Solid State Ionics, 2000, 129, 163 CrossRef CAS.
- J. A. M. Vanroosmalen, E. H. P. Cordfunke, R. B. Helmholdt and H. W. Zandbergen, J. Solid State Chem., 1994, 110, 100 CrossRef CAS.
- J. A. Alonso, M. J. MartinezLope, M. T. Casais, J. L. MacManusDriscoll, P. deSilva, L. F. Cohen and M. T. FernandezDiaz, J. Mater. Chem., 1997, 7, 2139 RSC.
| This journal is © The Royal Society of Chemistry 2012 |
