Lipid vesicle adsorption on micropore arrays prepared by colloidal lithography-based deposition approaches†
Cristina
Satriano
* and
Maria Elena
Fragalà
Department of Chemical Sciences and INSTM, Catania University, viale Andrea Doria, 6–95125, Catania, Italy. E-mail: csatriano@unict.it; mefragala@unict.it; Fax: +39 095 580138; Tel: +39 095 7385136
First published on 27th February 2012
Abstract
We present a new method for obtaining patches of fluid lipid membranes by patterning zinc oxide nanorods in 2D–3D micropore arrays via colloidal lithography combined with metal organic chemical vapour deposition and chemical bath deposition.
Supported membranes, comprised of a bilayer assembly of lipids on a solid substrate, represent established and successful model systems in the understanding of processes occurring at cell interfaces.1 In particular, the compartmentalization of the artificial bilayer into periodically structured supported membranes is of significant impact in the study of cellular interactions and cell-cell communications2 or in the design of novel biosensors with enhanced molecular recognition selectivity.3 Patterned supported membrane assemblies have been obtained, for instance, by means of (photo)polymerizable lipids for the in situ formation of diffusion barriers,4 or by using pre-structured substrates, which can be obtained by numerous micro- and nano-fabrication techniques.5 As a matter of fact, the spatial organization and mechanical deformation of supported membranes can be easily manipulated by controlling the substrate physico–chemical properties, including curvature,6 chemical functionalization7 and topography.8
Among the several substrates holding up the spontaneous formation of supported lipid bilayers (SLBs) via the adsorption of small unilamellar vesicles (SUVs), followed by vesicle rupture and fusion into planar bilayers,9 the inorganic oxides such as silica oxide, titania and mica are the most common.10
Zinc oxide (ZnO) is a multifunctional material already widely used for nanotechnological applications ranging from transistors to sensors,11 which is getting more and more used in applications at the biointerface,12 due to its intriguing properties of chemical stability, low toxicity and biodegradability.13 In particular, protein adsorption on ZnO nanoparticles has been demonstrated to be strongly affected by the surface charge of the inorganic surface;14 moreover ZnO can slowly dissolve in both acidic and strong basic aqueous solution, thus delivering Zn2+ ions (multipurpose element in biological systems).15
Here, we provide a versatile approach to pattern lipid membranes on ZnO-based nanoplatforms, fabricated by combined colloidal lithography (CL) and standard inorganic oxide thin films deposition techniques, such as metal organic chemical vapour deposition (MOCVD) and chemical bath deposition (CBD), as illustrated in Scheme 1.
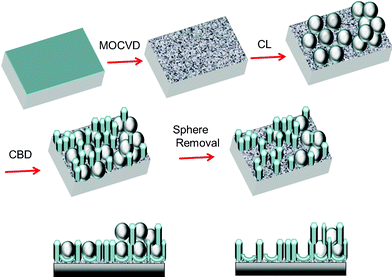 | ||
| Scheme 1 A schematic representation of the ZnO-based micropore array fabrication procedure by CL–MOCVD–CBD. | ||
The fabrication strategy employed in the present study involves the following four steps: i) growth of a thin ZnO seed layer by MOCVD; ii) deposition by drop casting of polystyrene (PS) colloidal nanospheres (diameter 0.35 μm) which are left overnight to self-assemble in close packed mono- and multi-layers; iii) CBD deposition of ZnO nanorods; iv) PS masks removal to create dense arrays of 2D and 3D micropores.16
Topography and optical properties of the resulting substrates were characterized by scanning electron microscopy (SEM, LEO Supra 55VP field emission), atomic force microscopy (AFM, Solver P47 NTD-MDT instrument in semicontact mode) and laser scanning confocal microscopy (LSM; Olympus FV1000). Small unilamellar vesicles were prepared from chloroform solutions in a 3![[thin space (1/6-em)]](https://www.rsc.org/images/entities/char_2009.gif) :
:![[thin space (1/6-em)]](https://www.rsc.org/images/entities/char_2009.gif) 1 molar ratio of 1-palmitoyl-2-oleoyl-sn-glycero-3-phosphocholine and 1-palmitoyl-2-oleoyl-sn-glycero-3-ethylphosphocholine (chloride salt). In order to obtain fluorescent vesicles, a small fraction (1%) of fluorescently labeled lipids (rhodamine-DHPE) were added. After chloroform removal the resulting thin lipid film was hydrated with phosphate buffer saline solution (pH 7.4) to a concentration of 5 mg mL−1 then extruded utilizing polycarbonate membranes with pore sizes of 100 and 30 nm. Vesicle adsorption and SLB formation were investigated by fluorescence recovery after photobleaching (FRAP) experiments after 15 min exposure of the substrates to 0.1 mg mL−1 vesicle solution followed by multiple buffer rinsings.
1 molar ratio of 1-palmitoyl-2-oleoyl-sn-glycero-3-phosphocholine and 1-palmitoyl-2-oleoyl-sn-glycero-3-ethylphosphocholine (chloride salt). In order to obtain fluorescent vesicles, a small fraction (1%) of fluorescently labeled lipids (rhodamine-DHPE) were added. After chloroform removal the resulting thin lipid film was hydrated with phosphate buffer saline solution (pH 7.4) to a concentration of 5 mg mL−1 then extruded utilizing polycarbonate membranes with pore sizes of 100 and 30 nm. Vesicle adsorption and SLB formation were investigated by fluorescence recovery after photobleaching (FRAP) experiments after 15 min exposure of the substrates to 0.1 mg mL−1 vesicle solution followed by multiple buffer rinsings.
Fig. 1 shows the SEM images of prepared surfaces and reveals the complexity of these ZnO-based nanoplatforms. In fact, in Fig. 1a three different regions of interest (ROI) can be identified and explained by the coexistence of multilayer and monolayer arrays of PS nanospheres (step ii of the deposition process), that leads to the formation of 3D hybrid ZnO nanorods/PS systems and 2D ZnO micropore arrays, respectively. In particular, both ROI 1 and ROI 2 types are regions where the PS nanospheres assembled in multilayer systems. Cross section detail (Fig. 1b) confirms the presence of a highly porous structure consisting of a double PS nanosphere layer intercalated by the presence of ZnO nanorods with a length of about 1 μm. Reasonably, the PS nanospheres entrapped in the deeper layer are not completely removed by toluene treatment, whilst the outermost PS layer is removed and contributes to form ZnO nanocups (bright regions in Fig. 1c). On the other hand, the region type ROI 3 (Fig. 1d) displays less densely packed nanosphere areas. These defects in the self-assembly of the PS masks result in an overall less porous topography, characterised by the print of PS monolayers and/or the extended region of dense ZnO nanorods, affected by coalescence processes.
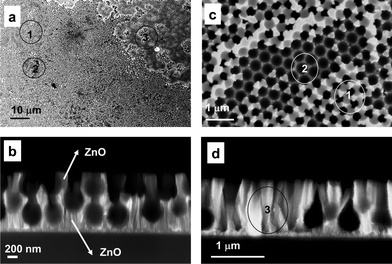 | ||
| Fig. 1 SEM images of ZnO/PS sample; a) Low magnification planar view (scale bar 10 μm); b) high magnification (scale bar 200 nm) cross section view of ROI 1 and ROI 2; c) high magnification (scale bar 1 μm) planar view of ROI 1 and ROI 2 and d) high magnification (scale bar 1 μm) cross section view of ROI 3. | ||
More insights on the structure and roughness of the patterned ZnO surfaces are provided by AFM analysis. Fig. 2 shows, in good agreement with the SEM images, the topographical complexity and the presence of different areas within the sample surface.
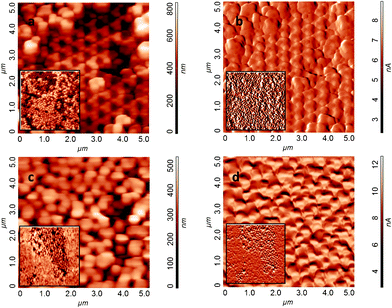 | ||
| Fig. 2 AFM images of height (a and c) and amplitude (b and d) of: (a–b) the multilayer (3D) ZnO micropore array with both types of ROIs (1 and 2); (c–d) the monolayer (2D) region with dense ZnO nanorods (ROI 3). In the inset the corresponding low magnification images (15 × 15 μm2, z = 1 μm (3D) and z = 400 nm (2D)). | ||
In particular, Fig. 2a and 2b display the top views, respectively in the height and amplitude modes, of an area of ZnO micropore arrays distributed over two planes. The removal of the PS spheres is evident for both the upper and bottom layers, according the formation of 3D micropores (compared with the SEM section in Fig. 1b).
The root mean squared roughness, measured on a scale of 2 × 2 μm2, is of 107 ± 10 nm for the top plane (ROI 1 type) and 98 ± 13 nm for the bottom layer (ROI 2 type).
On the other hand, Fig. 2c and 2d, display an array of ZnO micropores confined by dense nanorod areas. Such images are consistent with the 2D ZnO micropores evidenced by SEM (Fig. 1d). In this region the roughness values measured are 81 ± 16 nm for the micropore area and 26 ± 6 for the dense ZnO nanorods, respectively.
The morphological characterization evidences the difficulty in controlling the patterned regions on large area, due to the intrinsic non-uniformity of both the patterning and deposition approaches. However, the present substrate offers the advantage of a multivalent platform with various regions of different topography and roughness. Such regions, whose extensions may reach hundreds of micrometers, are suitable for simultaneous studies of interaction at the interface with biomolecules of interest.
Fig. 3 shows the representative micrographs, both fluorescence and bright field, obtained by LSM before and after the phospholipid adsorption process.
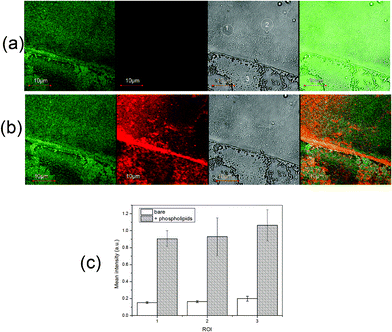 | ||
| Fig. 3 LSM micrographs of a ZnO/PS sample before (a) and after (b) lipids adsorption. From left to right: λex/λem = 488/519 nm (green); λex/λem = 543/591 nm (red); bright field image (gray); merged green and red channels. The corresponding mean fluorescence values in terms of the ratio between the average intensities of pixel luminance at 591 nm vs. 519 nm for the 1–3 ROIs are shown in (c). | ||
Before lipid adsorption (Fig. 3a), the heterogeneous character of the substrate is clearly visible in terms of both the topography and the optical properties, as the ZnO green emission changes locally due to the intrinsic distribution of the defects of the deposited films.17
On the other hand, Fig. 3b and 3c show that, after the lipid adsorption process, the detected red emission—characteristic of rhodamine-labeled phospholipids—is homogeneously distributed along the sample surface. This finding might be related to comparable lipid coverage on the differently patterned ZnO areas.
Using FRAP, the diffusion coefficient (D) of the lateral lipid mobility can be obtained by quickly focusing an intense laser on a small region of the sample, which causes local irreversible photochemical bleaching of the fluorophores.
If the adsorbed lipids diffuse, the bleached fluorophores will mix with the unbleached ones and the time it takes for the bleached area to recover fluorescence is used to determine the diffusion coefficient D. In particular, according to Axelrod's algorithm, D = (w2/4·τ1/2) γD, where w is the radius of the bleached area, τ1/2 describes time for 50% recovery and γD has the constant value of 0.88.18
Fig. 4 shows representative FRAP results for lipids adsorbed on 3D ZnO/PS micropore arrays, both ROI 1 (Fig. 4a) and ROI 2 (Fig. 4b), and on 2D ZnO nanorods extended regions (Fig. 4c).
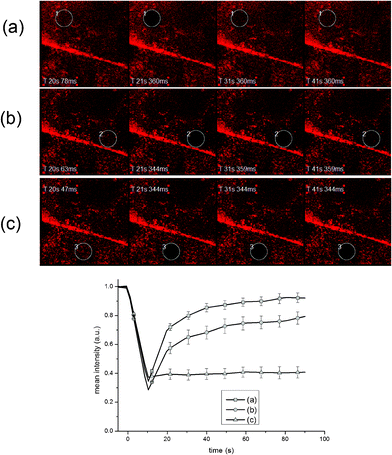 | ||
| Fig. 4 FRAP micrographs and time-solved intensity curves for lipids adsorbed on 3D ZnO micropore arrays (a: ROI 1 type region, b: ROI 2 type region) and a 2D ZnO nanorod region (c: ROI 3 type). Images are shown (from left to right) for pre-bleach, bleach, after ∼ 10 s and after ∼20 s of time lapse. Average of 3 photobleached spots on different regions on the sample per ROI type in each experiment. Error bars = standard error of means. | ||
The lipid diffusion coefficients for the ZnO 3D micropore arrays have been determined as 1.8 ± 0.2 μm2 s−1 and 1.6 ± 0.1 μm2 s−1 respectively for the ROI 1 and ROI 2 regions. These values are comparable to the diffusion coefficient obtained with the same vesicle solution on flat hydrophilic glass (data not shown) and in agreement with published values of the diffusion coefficient of fluorescent lipids in SLBs on glass.19
Therefore the present results indicate that these ZnO-based nanoplatforms prompt a differential lateral mobility behavior of the adsorbed lipid molecules. In fact, while the 3D ZnO micropore arrays support mobile lipid membranes, no significant lipid diffusion is measured on the extended 2D ZnO nanorod areas, similar to unpatterned ZnO (see Fig. S2 and S3 in the ESI†). This finding may be interpreted in terms of SLB formation on 3D ZnO micropores. In this process, the interaction between vesicles and substrates is affected not only by the vesicle properties such as composition, charge and size, but also by the substrate chemical structure, charge and roughness.
As to the surface chemical composition of the present ZnO microarray structures, it is not expected to change significantly for the 3D multilayer and 2D monolayer regions. In fact, the deposition procedure relies on the preliminary deposition of a laterally homogeneous ZnO seeding layer, about 80 nm thick (see Fig. S1 in ESI†). Moreover, according to SEM and AFM analyses (Fig. 1 and Fig. 2), a relatively thick nanostructured layer of ZnO nanorods (average height about 1 μm) is deposited. Consequently, one can be inferred that the actual adhesive substrate surface basically consists of a highly polar ZnO layer, due to the hydroxyl surface termination as well as the presence of oxidized carbon species.20
On the other hand, the inhomogeneity of the substrate topography and the related variation of the density of the ZnO nanorods—combined with the surface charge anisotropy of the ZnO nanorods exposed surfaces14—make difficult a precise estimation of the surface charge of the different regions (i.e., 3D vs. 2D) of patterned ZnO platforms. However, a different electrostatic force balance between the substrate and the bilayer can be evoked to explain the observed differences.
Finally, the high surface-to-volume ratio, intrinsically related to the porous nature of such nanoplatforms, likely leads to a predominant role of the topography for the observed lipid diffusion. In particular, the 3D ZnO micropore arrays are more effective than the smoother 2D ZnO nanorods. Further measurements using a quartz crystal microbalance with dissipation monitoring are in progress to scrutinize the change of the viscoelastic properties at the interface between the adsorbed lipids and the ZnO-based materials as function of the pattern design.
Conclusions
Here we demonstrate that highly porous ZnO-based micropore arrays strongly influence the lateral mobility properties of adsorbed lipid molecules. The mobile fraction of lipids in the adlayer is drastically reduced on the 2D ZnO extended nanorods with respect to the 3D ZnO micropores, which exhibit a much higher roughness.Our results are very promising for the set up of lipid membrane support materials which allow triggering of the apparent diffusion rates with different spatial scales of observation and would help to selectively control the diffusion of lipids or incorporated membrane proteins within the two-dimensional plane of the membrane. Such differential diffusion processes are fundamental for the understanding of the size-dependent functions of lipid organizations and how the lateral molecular transportation at microscopic regions propagate to the macroscale.
References
- P. M. Nair, K. Salaita, R. S. Petit and J. T. Groves, Nat. Protoc., 2011, 6, 523 CrossRef CAS.
- (a) J. T. Groves and S. G. Boxer, Acc. Chem. Res., 2002, 35, 149 CrossRef CAS; (b) C. Steinem and A. Janshoff, Curr. Opin. Colloid Interface Sci., 2010, 15, 479 CrossRef CAS; (c) V. Kiessling, M. K. Domanska, D. Murray, C. Wan and L. K. Chen, Wiley Encyclopedia of Chemical Biology, 2009, 4, 411–422 CAS; (d) M. Tanaka and R. Sackmann, Nature, 2005, 437, 656 CrossRef CAS.
- K. Furukawa and T. Aiba, Langmuir, 2011, 27, 7341 CrossRef CAS.
- K. Morigaki, T. Baumgart, A. Offenhausser and W. Knoll, Angew. Chem., Int. Ed., 2001, 40, 172 CrossRef CAS.
- (a) R. N. Orth, J. Kameoka, W. R. Zipfel, B. Ilic, W.W. Webb, T. G. Clark and H. G. Craighead, Biophys. J., 2003, 85, 3066 CrossRef CAS; (b) X. Han, A. Studer, H. Sehr, I. Geissbühler, M. Di Berardino, F. K. Winkler and L. X. Tiefenauer, Adv. Mater., 2007, 19, 4466 CrossRef CAS.
- (a) M. Sundh, S. Svedhem and D. Sutherland, J. Phys. Chem. B, 2011, 115, 7838 CrossRef CAS; (b) A. M. Smith, M. Vinchurkar, N. Gronbech-Jensen and A. N. Parikh, J. Am. Chem. Soc., 2010, 132, 9320 CrossRef CAS; (c) E. I. Goksu, M. I. Hoopes, B. A. Nellis, C. Xing, R. Faller, C. W. Frank, S. H. Risbud, J. H. Satcher and M. L. Marjorie, Biochim. Biophys. Acta, Biomembr., 2010, 1798, 719 CrossRef CAS.
- (a) I. Pfeiffer, S. Petronis, I. Köper, B. Kasemo and M. Zäch, J. Phys. Chem. B, 2010, 114, 4623 CrossRef CAS; (b) B. A. Nellis, J. H. Jr Satcher and S. H. Risbud, Acta Biomater., 2011, 7, 380 CrossRef CAS.
- (a) S.-W. Lee, C. Jeong and S.-D. Lee, J. Phys. Chem. B, 2009, 113, 3610 CrossRef CAS; (b) B. Sanii, A. M. Smit, R. Butti, A. M. Brozell and A. N. Parikh, Nano Lett., 2008, 8, 866 CrossRef CAS; (c) E. T. Castellana and P. S. Cremer, Surf. Sci. Rep., 2006, 61, 429 CrossRef CAS; (d) F. F. Rossetti, M. Bally, R. Michel, M. Textor and I. Reviakine, Langmuir, 2005, 21, 6443 CrossRef CAS; (e) H. M. Seeger, A. Di Cerbo, A. Alessandrini and P. Facci, J. Phys. Chem. B, 2010, 114 Search PubMed; (f) R. Tero, G. Sazaki, T. Ujihara and T. Urisu, Langmuir, 2011, 27, 9662 CrossRef CAS.
- C. Satriano, M. Edvardsson, G. Ohlsson, G. Wang, S. Svedhem and B. Kasemo, Langmuir, 2010, 26, 5715 CrossRef CAS.
- (a) N.-J. Cho, C. W. Frank, B. Kasemo and F. Hook, Nat. Protoc., 2010, 5, 1096 CrossRef CAS; (b) T. R. Khan, H. M. Grandin, A. Mashaghi, M. Textor, E. Reimhult and I. Reviakine, Biointerphases, 2008, 3, FA90 CrossRef.
- Z. L. Wang, ACS Nano, 2008, 2, 1987 CrossRef CAS.
- (a) J. T. Seil and T. J. Webster, Acta Biomater., 2011, 7, 2579 CrossRef CAS; (b) H. Hong, J. Shi, Y. Yang, Y. Zhang, J. W. Engle, J. Nickles, X. Wang and W. Cai, Nano Lett., 2011, 11, 3744 CrossRef CAS.
- Z. Li, R. Yang, M. Yu, F. Bai, C. Li and Z. L. Wang, J. Phys. Chem. C, 2008, 112, 20114 CAS.
- D. S. Golovko, R. Munõz-Espì and G. Wegner, Langmuir, 2007, 23, 3566 CrossRef CAS.
- J. Zhou, N. Xu and Z. L. Wang, Adv. Mater., 2006, 18, 2432 CrossRef CAS.
- (a) C. Satriano, M. E. Fragalà and Y. Aleeva, J. Colloid Interface Sci., 2012, 365, 90 CrossRef CAS; (b) M. E. Fragalà, C. Satriano and G. Malandrino, Chem. Commun., 2009, 839 RSC.
- Ü. Özgür, Ya. I. Alivov, C. Liu, A. Teke, b. M. A. Reshchikov, S. Doğan, V. Avrutin, S.-J. Cho and H. Morkoç, J. Appl. Phys., 2005, 98, 041301 CrossRef.
- D. Axelrod, D. E. Koppel, J. Schlessinger, E. Elson and W. W. Webb, Biophys. J., 1976, 16, 1055 CrossRef CAS.
- A. R. Patel and C. W. Frank, Langmuir, 2006, 22, 7587 CrossRef CAS.
- M. E. Fragalà, Y. Aleeva and C. Satriano, J. Nanosci. Nanotechnol., 2011, 11, 8180 CrossRef.
Footnote |
| † Electronic Supplementary Information (ESI) available: (1) Lengthy experimental details; (2) SEM micrographs of ZnO seed layer underlying 3D and 2D ZnO micropores (Fig. S1) (3) LSM micrographs and FRAP experiment on lipids adlayer onto unpatterned ZnO (Fig. S2 and S3). See DOI: 10.1039/c2ra20163a/ |
| This journal is © The Royal Society of Chemistry 2012 |
