Graphite oxide/Nafion composite membranes for polymer electrolyte fuel cells
Ravi
Kumar
,
Chenxi
Xu
and
Keith
Scott
*
School of Chemical Engineering and Advanced Materials, Newcastle University, Newcastle Upon Tyne, United Kingdom. E-mail: k.scott@ncl.ac.uk; Fax: +44 191 2225292; Tel: +44 191 2225207
First published on 26th July 2012
Abstract
Graphite oxide (GO)/Nafion composite membranes were prepared and used for polymer electrolyte membrane fuel cells (PEMFCs). Membranes were characterized by transmission electron microscopy (TEM) and scanning electron microscopy (SEM) which showed the distribution of graphite oxide sheets in a Nafion polymer matrix. Fourier transform infrared spectroscopy data (FTIR) for Nafion and GO showed vibrations at 3440 cm−1 which was attributed to intermolecular hydrogen bonding and at 1724 cm−1 ascribed to the CO stretching frequency. The proton conductivities of GO (4 wt%)/Nafion composite, Nafion 212 and Nafion recast membranes at 30 °C and 100% humidity were 0.078, 0.068 and 0.043 S cm−1 respectively. The fuel cell performance of the GO (4 wt%)/Nafion composite membrane gave a maximum power density of 415 mW cm−2 at 0.390 V at 60 °C. At 100 °C a GO (4 wt%)/Nafion membrane fuel cell performance of 212 mW cm−2 was obtained which was much better than those of Nafion recast and Nafion 212 under 25% relative humidity.
1 Introduction
Polymer electrolyte membrane fuel cells have been proposed as one of the most promising power sources for realising the hydrogen economy and for alleviating issues like environmental pollution. Polymer electrolyte membrane fuel cells are, however, not in widespread commercial use and research attempts both to improve the performance and minimize expensive components have been triggered over recent decades.1,2 Requirements for an excellent membrane are high proton conductivity, chemical resistivity, thermo-mechanical stability and durability under dynamic operations.3 One of the approaches to improve cell performance is to modify material components like membranes by chemical means.4The typical membranes currently used for PEMFCs such as Nafion or other perflourosulfonic acid polymers (e.g. Aciplex and Flemion) show a significant loss in conductivity at elevated temperature due to the dehydration of water from the membrane.5,6 The proton exchange membranes used in PEMFCs are thin, to increase the proton conductivity, which accelerates the membrane dehydration. In order to enhance the operating temperature, the prevention of water loss is very important,7 and several approaches have been attempted to prevent the loss of water from membranes. One approach is incorporating oxide materials (e.g. ZrO2, SiO2 and TiO2) to enhance the water retention properties and the corresponding proton conductivity of the membrane.8–10
Nafion membrane is made up of a hydrophobic polytetrafluoroethylene (PTFE) backbone and a hydrophilic sulfonic acid ester side chain and has an intermediate region of inverted micelles or ionic clusters with water at an approximate ratio of 70![[thin space (1/6-em)]](https://www.rsc.org/images/entities/char_2009.gif) :
:![[thin space (1/6-em)]](https://www.rsc.org/images/entities/char_2009.gif) 1000.1 The proton conductivity mainly depends on the water content in Nafion. Hence, any increase in the water content increases the proton conductivity. Graphite oxide contains different kinds of oxygen functionalities, such as carboxylic, hydroxyl and epoxy groups. Due to the presence of oxygen functionalities, GO can be easily hydrated. The acidic functional groups and intermolecular hydrogen bonding can provide abundant proton conducting paths.11
1000.1 The proton conductivity mainly depends on the water content in Nafion. Hence, any increase in the water content increases the proton conductivity. Graphite oxide contains different kinds of oxygen functionalities, such as carboxylic, hydroxyl and epoxy groups. Due to the presence of oxygen functionalities, GO can be easily hydrated. The acidic functional groups and intermolecular hydrogen bonding can provide abundant proton conducting paths.11
Herein, we present a chemical strategy to enhance the water retention properties by incorporating graphite oxide (GO) into a Nafion membrane, and evaluate this composite membrane as an electrolyte in PEMFC applications. The GO sheets dispersed in the polymer matrix, can tune the extent of hydrophilic domains in the matrix. GO/Nafion composite membranes have been used in different applications such as actuators, sensors, and reduced graphene oxide has been used as a electrocatalyst support.12 Our previous work on PBI/GO and sulfonated GO composite polymer electrolytes for high temperature PEMFCs was reported.13–15 In comparison herein, GO/Nafion composite membranes were prepared. Hence, it will be interesting to see the effect of GO sheets on the proton conductivity of Nafion membranes, because of increased water retention and a better network for proton transport.
2 Experimental
2.1 Composite polymer membrane preparation
Graphite oxide was synthesized from natural flake graphite by the modified Hummers method.16 In brief, 200 mg of graphite particles were immersed in concentrated sulfuric acid (46 ml) and KMnO4 (6 g) was added slowly in small quantities with the temperature maintained between 0 and 5 °C using an ice bath, after the complete oxidation of KMnO4, the mixture was heated to 37 °C and kept at this temperature for about 30 min. Then 12 ml of distilled water was added slowly to this mixture and the temperature of the mixture was raised to 95 °C and maintained for about 15 min, this mixture was then further diluted with 280 ml of water and 20 ml of 30% H2O2 was added and left for 5 min, then the solid was filtered off and washed with 5% HCl until the filtrate was free from sulphate ions. GO thus obtained was further washed thoroughly with water and dried in air for 24 h.Composite membranes were prepared by dissolving precast Nafion membrane (320 mg; 5% Nafion solution in lower aliphatic alcohols, Sigma Aldrich) in (10 mL) dimethylacetamide (DMAc) and mixing with a solution of graphite oxide in DMAc solution with a mass ratio of 2%, 4% or 6%. The mixture was stirred for 1 h and the composite membranes were prepared by casting this solution on a glass plate and drying at 70 °C. The resulting membranes were peeling off and dried at 140 °C in an oven for 2 h. Finally, the membranes were pre-treated by boiling for 1 h in 5% H2O2, water, 0.5 M H2SO4 and water in sequence. The dry membrane thickness was measured at 10 random points over the surface using a digital micrometer.
2.2 Membrane characterization
AC impedance measurements were carried out between frequencies of 20 kHz and 1 kHz to measure the in-plane conductivity of the composite membranes using a four-point probe method with a Frequency Response Analyzer (Voltech TF2000, UK). The method involves four equally spaced probes in contact with the measured material: two of the probes were used to source current whilst the other two were used to measure the voltage drop. The cell was operated at 100% RH at ambient pressure and with a variable temperature. The membrane samples were cut by nitrogen snapping and mounted on a holder facing the membrane opposite to the light source to see the cross section morphology of the composite membrane. Morphology was investigated by a JSM-5300 LV (Japan) scanning electron microscope (SEM). Transmission electron microscopy (TEM) was investigated by a Philips CM 100 Compustage (FEI), and images were collected using an AMT CCD camera (Deben). Fourier transform infrared spectroscopy (FTIR) was measured on a Varian 800 FT-IR spectrometer system with the wave number between 4000 and 500 cm−1. The thermal stability of the membranes was measured by thermo-gravimetric analysis using a STA6000 machine over a temperature range of 30–600 °C with a scan rate of 5 °C min−1 under Helium flow (30 ml min−1). Tensile strength measurements were carried out with an Instron 4505 machine with a displacement speed of 2 mm per minute. Membrane samples with an area of 5 × 2 cm2 were cut and used for mechanical studies.2.3 Water uptake test
Membrane samples with an area of 5 cm2 were dried at 70 °C for 24 h, weighed in their dried state (Wdry), and then soaked in deionized water at room temperature for 24 h. The membranes were carefully blotted of all surface water and weighed again (Wwet). The water uptake was calculated from the equation water uptake (%) = 100 × (Wwet − Wdry)/Wdry.2.4 Ion Exchange capacity (IEC)
The ion exchange capacity (IEC) of the membranes was measured with the classical titration technique. The samples were soaked in a large volume of 0.1 mol L−1 HCl solution, washed with distilled water to remove excess HCl, and then immersed in 1 M NaCl aqueous solution to release protons from the membrane. The released H+ was back titrated with a 0.01 M NaOH aqueous solution using phenolphthalein as an indicator. The IEC value (in meq g−1), which is defined as milli equivalents (meq.) of sulfonic groups per gram of dried sample, is obtained from following equation.| IEC =VNaOH × CNaOH/Wdry |
2.5 Membrane electrode assemblies (MEAs)
To prepare the fuel cell membrane electrode assemblies, the membrane was sandwiched between 20% Pt/C anode and cathode (0.38 mg cm−2; from Alfa Aesar, and the amount of solid Nafion content in the electrocatalyst layer is ∼10 mg) electrodes made as follows. The catalyst ink was made by ultrasonicating with 2-propanol and 20 wt% Nafion ionomer, and the ink was sprayed onto gas diffusion electrodes (carbon paper) with a wet proofed micro-porous layer (H2315 T10AC1), purchased from Freudenberg (FFCCT, Germany). The MEA was hot pressed at 125 °C and a pressure of 60 kg cm−2 for 3 min.2.6 Fuel cell tests
The MEA was set between two high-density graphite blocks impregnated with phenolic resin, and the active electrode area (1 cm2) was formed by the parallel gas flow channels area. Electric cartridge heaters were mounted at the rear of the graphite blocks to maintain the desired temperature, which was monitored by imbedded thermocouples and controlled with a temperature controller. Gold-plated steel bolts were screwed into the blocks to allow electrical contact. H2 and O2 were fed to each side of the cell at a flow rate of 0.1 and 0.07 dm3 min−1 respectively. The cell was conditioned at 0.3 V for 1 h before polarization studies.3 Results and discussion
The morphologies of recast Nafion and GO/Nafion composite membranes were studied by SEM as shown in Fig. 1a and 1b. The cross section of the Nafion recast has a typical di-block morphology,17 whereas nano-sized graphene oxide sheets (∼100 nm) are embedded in the composite polymer matrix. TEM images of pristine graphite oxide are shown in Fig. 2a and 2b, GO nano sheets appeared relatively flat, exfoliated and wrinkled which is consistent with the literature reported morphology.18Fig. 2c and 2d show TEM images of the Nafion composite membrane, graphene oxide nano sheets remained exfoliated and randomly distributed over the whole membrane and tightly held in the polymer matrix due to strong interfacial interactions. Hence, conduction paths are interconnected between GO and Nafion which potentially enhances the proton conductivity.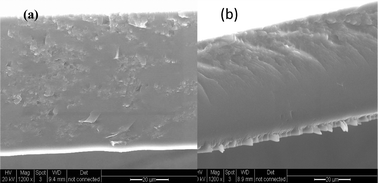 | ||
| Fig. 1 Scanning electron microscopy of a cross section of (a) GO/Nafion composite membrane and (b) recast Nafion. | ||
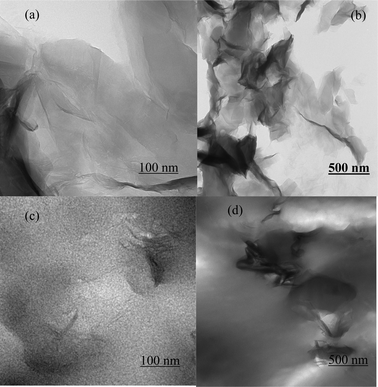 | ||
| Fig. 2 TEM images of graphite oxide at (a) high magnification, and (b) low magnification. (c) GO/Nafion at low magnification, and (d) high magnification. | ||
FTIR spectra of recast Nafion and GO/Nafion composite membranes were used to analyze the extent of chemical interaction between GO and Nafion. The FTIR spectra shown in Fig. 3, of recast Nafion and the GO/Nafion composite show substantial changes in –COC– symmetric stretching bands at 968 and 980 cm−1, whereas considerable broadening occurred in the –SO3– symmetric stretching vibrations bands at 1056 cm−1 and asymmetric stretching of –SO3– groups at 1201 cm−1. The double broadening observed in the bending vibrations of the O–H deformation peak observed at 1724 cm−1 and bands at 3440 cm−1 correspond to intermolecular hydrogen bonding, indicating interactions between the dispersed graphite oxide and the hydrate groups of the Nafion polymer matrix.15
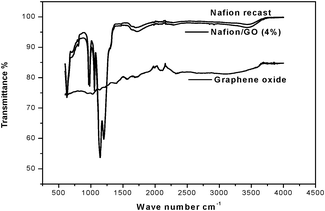 | ||
| Fig. 3 FTIR spectra of recast Nafion, GO/Nafion composite and graphene oxide. | ||
Fig. 4, shows TGA and DTA of recast Nafion and GO/Nafion composite membranes. A small fraction of initial weight loss ca. 5% at 70 °C and another of 2% at 148 °C is observed for the membranes, which could be attributed to the loss of water. A weight loss in GO/Nafion from 149 to 259 °C due to the loss of surface functional groups on GO and also the loss of bonded water on both membranes was observed. The degradation of sulfonic groups in the side chains was observed at around 280 °C on both the membranes. The sharp exothermic DTA peak observed for recast Nafion is due to degradation of PTFE back bone whereas GO/Nafion shows a small broad peak.
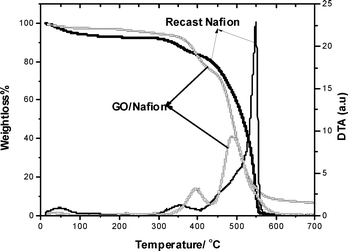 | ||
| Fig. 4 TGA and DTA of recast Nafion and GO/Nafion composite membranes over a temperature range of 10 to 700 °C. | ||
Water uptakes of recast Nafion, Nafion 212 and various GO/Nafion composite membranes are shown in Table 1. Water uptake increases with an increase in the GO content up to 4 wt% and with a further increase of GO, no significant increase in the water uptake of the membrane occurred. The water uptake increased with increasing GO content due to the hydrophilic nature of GO, and after a certain level there is no further increase (and perhaps a slight decrease) in water uptake due to the amphiphilic nature of the Nafion membrane which is often attributed to the micellar nature of hydrophilic pools dispersed in the hydrophobic domain, which are disrupted for non-optimum concentrations of fillers.1 Similarly, the increased stiffness of the Nafion membrane resulted in reduced water uptake which was observed in 6 wt% of graphite oxide.
The tensile properties of recast Nafion and GO/Nafion composite membranes with GO contents of 2, 4 and 6 wt% are shown in Fig. 5. The data indicates that the incorporation of graphite oxide nano sheets into a Nafion polymer matrix can enhance the tensile strength of the composite membranes. The tensile strength value reached a maximum value of 8.17 MPa at a graphite oxide content of 4 wt%, whereas 2 wt% and 6 wt% reached 5.5 and 6.64 MPa respectively. In contrast the recast Nafion membrane had only a value of 3.36 MPa. The Young's modulus obtained from stress strain curves, are 0.7, 0.47, 0.52 and 0.28 GPa for GO (4, 2 and 6 wt%)/Nafion and recast Nafion respectively. The percentage elongations of the membranes are 42.3%, 27.85%, 31.3% and 16.90% for GO (4, 2 and 6 wt%)/Nafion and recast Nafion respectively. The maximum tensile strength was attributed to the uniform distribution of GO nano sheets in the Nafion matrix, which helped to distribute the stress over the whole area of the membrane. However, when GO content exceeded an “optimum” content the strength of the membrane decreased to 6.64 MPa. This was mainly due to a stress concentration at the interface of the GO/Nafion composite due to the increased concentration of GO; the membranes became brittle and it was not possible to make Nafion/GO composite membranes with a GO content higher than 6 wt%.
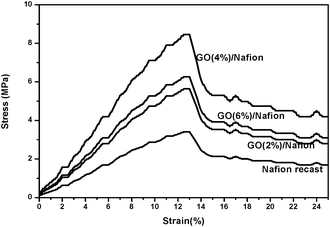 | ||
| Fig. 5 Stress vs. strain curves of GO/Nafion composites and recast Nafion membranes. | ||
Fig. 6, shows the temperature dependant ionic conductivity of recast Nafion, Nafion 212 and various compositions of GO/Nafion composite membranes measured under fully humidified conditions. The composite membranes were found to exhibit proton conductivities higher than those of recast Nafion and the Nafion 212 membrane at all temperatures employed in this study (30–120 °C). The GO (4 wt%)/Nafion membrane exhibited a proton conductivity higher than that of composite membranes of all other compositions at 80 °C, which is a suitable operating temperature of Nafion-based PEMFCs. The composite membrane had a conductivity of 0.17 S cm−1 which was higher than that of recast Nafion, 0.092 S cm−1 at 80 °C. Even at 120 °C the composite membrane showed a significant proton conductivity of 0.044 S cm−1 which was 3.6 times more than the recast Nafion (0.012 S cm−1) which indicates that the GO/Nafion composite could be suitable for higher temperature PEMFCs.
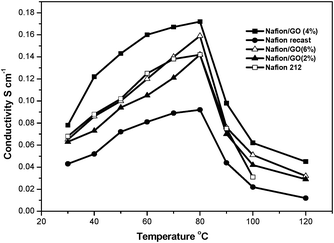 | ||
| Fig. 6 Temperature dependent proton conductivity plots of recast Nafion, Nafion 212 and various compositions of the GO/Nafion composite membrane. | ||
The high proton conductivity of the composite membrane is attributed to a Grotthus-type mechanism, in which reorganization of hydrogen bonds plays a vital role in hydrated GO. The presence of different acidic functional groups like carboxylic acid and hydroxyl groups could provide a more facile hopping of protons, which in turn would help to increase the proton transport. On the other hand the proton conductivity of the composite membrane decreased at a loading of GO higher than 4 wt%, as shown in Fig. 6. The reported behaviour that the proton conductivity passes through a maximum value at an optimum concentration of the incorporated species in composites of amphiphilic proton-conducting polymers like Nafion is often attributed to the micellar nature of the hydrophilic pools dispersed in the hydrophobic domains, which is disrupted at non-optimum concentrations of the fillers.1 By a similar argument, the increased stiffness of the Nafion membranes, which resulted in reduced water uptake, thereby adversely affected the proton conductivity. The IEC values are shown in Table 1; the GO (4%)/Nafion composite membrane shows a higher IEC value of 1.38 meq g−1 compared to all other membranes. The activation energies calculated for the recast Nafion, Nafion 212 and GO/Nafion composite membranes, from Fig. 7, are 14.2, 13.26 and 12.98 kJ mol−1 respectively, which suggests that proton transport in the case of the composite membrane was more facile than that of the recast Nafion membrane.
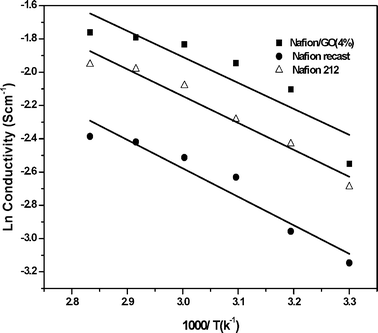 | ||
| Fig. 7 Arrhenius plot of recast Nafion, Nafion 212 and GO/Nafion composite membranes. | ||
Fig. 8a, shows the single cell polarization plots obtained with MEAs from recast Nafion, Nafion 212 and GO (4%)/Nafion composite membranes at 60 °C using passing H2 (humidified) and O2 (dry) at flow rates of 0.1 and 0.07 dm3 min−1. The open circuit voltage (OCV) of the composite membrane was more than 0.9 V, which indicates that the membrane had reasonably low gas permeability and no significant electronic conductivity of GO which would otherwise adversely affect the OCV. The GO/Nafion composite membrane showed enhanced fuel cell performance compared to that of the recast Nafion membrane. Further, it is evident, from the conductivity data that the GO (4%)/Nafion composite had the optimum graphite oxide content and it gave the greatest maximum power density of 415 mW cm−2cf. a value of 272 mW cm−2 for the recast Nafion and 300 mW cm−2 for the Nafion 212 membrane at 60 °C.
Fig. 8b displays the polarization and power density curves for the GO (4%)/Nafion composite, recast Nafion and Nafion 212 single-cell operating at 100 °C and 25% relative humidity. The peak power density for GO (4%)/Nafion was 212 mW cm−2, approximately 3.8 times higher than that of Nafion 212 (56 mW cm−2). At a cell voltage of 0.47 V, GO (4%)/Nafion showed a current density of 0.44 A cm−2, about 3.2 times higher than Nafion 212 (0.166 A cm−2).
The AC impedance was measured at 60 °C for all the MEAs in a frequency range of 100 KHz to 1 KHz, in order to understand the interfacial behaviour and it was shown in Fig. 9. The cell resistance values were 0.24 Ω for GO/Nafion, 0.29 Ω for recast Nafion and 0.25 Ω for Nafion 212 membranes. These results indicate that the composite membrane shows lower resistance compared to recast Nafion and Nafion 212. The charge transfer resistance of the GO (4%)/Nafion membrane, which is proportional to the diameter of the semicircle, was smaller than those of the recast Nafion and Nafion 212.
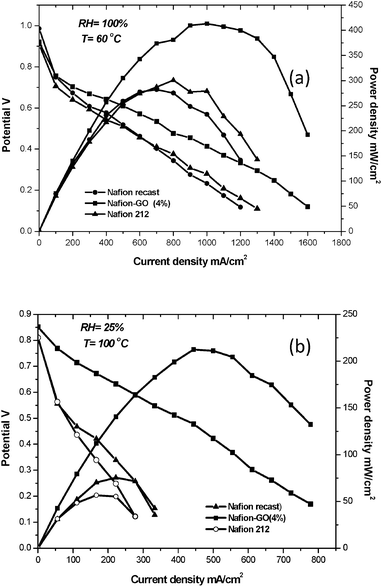 | ||
| Fig. 8 (a) Polarization curves for H2 (humidified)/O2 (dry) fuel cell at 60 °C (flow rate of 0.1 and 0.07 dm3 min−1) and (b) polarization curves for H2 (humidified)/O2 (dry) fuel cell at 100 °C (flow rate of 0.1 and 0.07 dm3 min−1). | ||
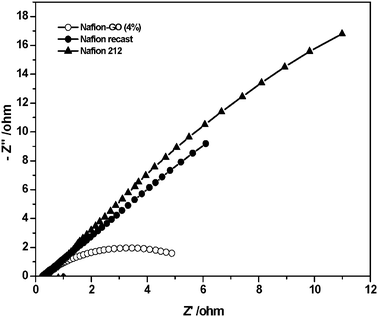 | ||
| Fig. 9 Nyquist plots of MEAs of Nafion/GO, Nafion 212 and recast Nafion membranes at 60 °C. | ||
The composite membrane showed superior proton conductivity, but the overall fuel cell performance is still relatively low, indicating that the catalyst and ionomer compositions in the MEA were not “optimal” for the fuel cell. Although GO/Nafion composites are suitable membranes for the PEMFCs, more studies are required to optimise the catalyst layer composition to fabricate suitable MEAs. The internal cell conductivities estimated from the linear region of the polarization curves obtained at 60 °C were 0.015 S cm−1, 0.018 and 0.035 S cm−1 for the recast Nafion, Nafion 212 and GO/Nafion composite membrane based MEAs respectively. These values are much lower than the membrane conductivities indicating significant voltage losses due to electrode polarization and electrode layer resistances. Several challenges such as durability, chemical stability and degradation studies of the composite membranes in fuel cell conditions have to be evaluated, which will be described in future work.
4 Conclusions
Various compositions of GO/Nafion composite membranes have been prepared for use in PEMFC applications. The effect of GO on the fundamental properties of a Nafion membrane as well as the overall fuel cell performance have been systematically demonstrated. The increase in proton conductivity with temperature measurements revealed that GO did not affect the phase separated morphology or the proton conduction mechanism, which is also supported by thermogravimetric analysis. The high proton conductivity of the GO/Nafion composite membrane is from the chemical interactions between GO/Nafion, and also the presence of different oxygen functionalities on GO, which markedly enhanced proton transport. Studies on mechanical stability revealed that using GO is a good strategy for increasing the mechanical stability without affecting the swelling properties. All the studies on fundamental properties indicated an improvement in fuel cell performance, which was seen in a peak power density of 415 mW cm−2 for GO (4 wt%)/Nafion compared with that of recast Nafion; 272 mW cm−2. The high temperature fuel cell performance of the composite membrane is better than those of recast Nafion and Nafion 212. The data indicates that GO/Nafion composite membranes could be an alternative to current Nafion membranes in the fabrication PEMFCs with improved efficiency.Acknowledgements
This work was supported by EPSRC through supergen fuel cell consortium grant number EP/Go30995/1.References
- R. Kannan, M. Parthasarathy, S. U. Maraveedu, S. Kurungot and V. K. Pillai, Langmuir, 2009, 25(14), 8299–8305 CrossRef CAS.
- J. Wu, X. Z. Yuan, J. J. Martin, H. Wang, J. Zhang, J. Shen, S. Wu and W. Merida, J. Power Sources, 2008, 184, 104–119 CrossRef CAS.
- D. Dunwoody and J. Leddy, Electrochem. Soc. Interf, 2005, 14, 37–39 CAS.
- R. Kannan, B. A. Kakade and V. K. Pillai, Angew. Chem., Int. Ed., 2008, 47, 2653 CrossRef CAS.
- Y. M. Kima, S. H. Choia and H. Ch. Lee, Electrochemical Acta, 2004, 49(4), 787–796 Search PubMed.
- P. L. Antonucci, A. S. Arico and P. Creti, Solid State Ionics, 1999, 125, 431–437 CrossRef CAS.
- Z.-G. Shao, P. Joghee and I. Ming Hsing, J. Membr. Sci., 2004, 229, 43–51 CrossRef CAS.
- N. Miyake, J. S. Wainright and R. F. Savinell, J. Electrochem. Soc., 2001, 184, A898 CrossRef.
- S. P. Tung and B. J. Hwang, Fuel Cells, 2007, 7, 32 CrossRef CAS.
- G. Alberti and M. Casciola, Annu. Rev. Mater. Res., 2003, 33, 129 CrossRef CAS.
- K. Hinokuma and M. Ata, Chem. Phys. Lett., 2001, 341, 442 CrossRef CAS.
- B. Seger and P. V. Kamath, J. Phys. Chem. C, 2009, 113, 7990–7995 CAS.
- C. Xu, Y. Cao, R. Kumar, X. Wu, X. Wang and K. Scott, J. Mater. Chem., 2011, 21, 11359–11364 RSC.
- R. Kumar and K. Scott, Chem. Commun., 2012, 48, 5584–5586 RSC.
- R. Kumar, M. Mamlouk and K. Scott, International Journal of Electrochemistry, 2011, 434186 (7 pages) Search PubMed.
- W. S. Hummers Jr. and R. E. Offeman, J. Am. Chem. Soc., 1958, 80, 1339 CrossRef.
- J.-H. Jung, J.-H. Jeon, V. Sridhar and Il.-K. Oh, Carbon, 2011, 149, 1279–1289 CrossRef.
- H. Zarrin, D. Higgins, Y. Jun, Z. W. Chen and M. Fowler, J. Phys. Chem. C, 2011, 115, 20774–20781 CAS.
| This journal is © The Royal Society of Chemistry 2012 |
