A simple method for solving the voltage overshoots of LiFePO4-based lithium-ion batteries with different capacity classes
Kwang Man
Kim
*,
Young-Gi
Lee
,
Kun-Young
Kang
,
Yil Suk
Yang
and
Jongdae
Kim
Research Team of Power Control Devices, Electronics and Telecommunications Research Institute (ETRI), Daejon 305-700, Korea. E-mail: kwang@etri.re.kr
First published on 16th February 2012
Abstract
To simulate the energy storage process of an energy harvesting device, a step-charging current protocol for LiFePO4-based lithium-ion batteries is considered, in which lower current rates are applied in both the earlier and latter steps of the voltage profile, while the maximum current (0.2 C-rate) is applied in the middle voltage region. The protocol is applied to three stages of voltage profile, i.e., initial step (stage 1), middle plateau (stage 2), and final step (stage 3) regions. In spite of their capacity-classes, lithium-ion batteries containing sub-μm-sized LiFePO4 have shown voltage overshoots in the step regions of the voltage profile, thus involving anomalous degradation of active materials and diminishing the stability and safety of the batteries. In order to overcome this overshoot problem, a simple method of blending a small amount of μm-sized LiCoO2 with the LiFePO4 is proposed. The results show that adding the LiCoO2 eliminates voltage overshoots. The small quantity of μm-sized LiCoO2 extends the operating voltage region as the short appearance of the LiCoO2 plateau serves to block the emergence of an overvoltage. In addition, battery performance is further improved by an increase in the electrode density brought about by the close packing of different-sized particles.
1. Introduction
Early lithium-ion batteries were typically charged via a constant current and the subsequent constant voltage method, which allowed for low capacity fade, a fast charging time, and low internal resistance during a long cycle life.1–3 However, certain features of this method, occurring inside both the cathode and anode, were shown to be potentially unsafe, so some modifications were suggested for safer, more efficient charging of lithium-ion batteries. These improvements include methods for boost-charging,4 current-decay variation,5 multi-stage constant-current charging,6 and pulse charging.7,8 However, all of these modifications are still aimed at improving the charging methods from the inside of a rechargeable battery. Only by switching our focus to the outside, we can begin to consider naturally occurring power sources and environmentally benign renewable energies.For decades, individual labs and scientists have been developing their own energy harvesting and energy saving activities. In terms of practicality, these diverse methods are beginning to be integrated in the hope of achieving an autonomous power module combining a renewable energy harvesting device with a rechargeable battery. As promising energy harvesting sources, piezoelectric and pyroelectric devices can produce electrical energy from natural vibrations and natural geothermal energy, respectively. However, the effectiveness of such energy harvesting devices has thus far been limited by their low conversion efficiency and wide range of power density. For instance, a piezoelectric device typically produces a power density of 0.3–0.5 mW cm−3 from machinery vibration or shoe-insert movement.9 In addition, the electrical energy obtained from natural renewable energy sources has shown highly irregular and complicated patterns of both voltage and current over time, making it very difficult to charge rechargeable batteries with good stability and efficiency. In reality, energy harvesting devices such as piezoelectric devices may generate highly fluctuating electrical energy with a wide range of voltage and infinitesimally low current values. Preliminary charging experiments for rechargeable batteries are essential in order to account for various irregular patterns of natural power sources. For example, the stability of the voltage response could be enhanced by a step-charging protocol for changing the current level over time.
On the other hand, based on the introduction10 and recent reviews,11–13 phosphor-olivine LiFePO4 (LFP) has been greatly studied as a promising cathode material for use in batteries for high-power tools and plug-in hybrid electric vehicles. The LFP offers many advantages, including comparatively high capacity (theoretically 170 mAh g−1), a long plateau at 3.45 V (vs. Li/Li+), and low cost. Owing to its intrinsically insulating feature, LFP is commonly used in the forms of carbon-coated nanoparticles to raise the electronic conductivity. For instance, one LFP/C composite, which was prepared using a carbon gel formed from the polymerization of resorcinol-formaldehyde,14 achieved 95% (162 mAh g−1) of its theoretical capacity at 0.5 C-rate, as well as very good rate-capability and excellent stability. However, LFP usually shows low values of tap density and operation voltage, which will eventually result in low volumetric energy density. Thus, LFP is continually being investigated and optimized as a cathode material for advanced lithium-ion batteries.15–18
This study presents a step-charging current protocol that closely mimics the irregular pattern of a vibration power source. This method is then adopted into LFP-based half- and full-cells with various capacity-classes in order to examine the stability of their voltage responses. The protocol consists of three current steps, each with its own duration, an initial increasing current step followed by two consecutive decreasing current steps. The protocol is applied to three different stages of charge profile: the low-voltage region, the long plateau region, and the high-voltage region. The voltage responses to the step-charging protocol will be analyzed. In addition, a simple answer to the potential problem of instability caused by voltage overshoots will be discussed in order to establish a safer LFP-based battery system that can be stably charged even under tough environmentally vibrational conditions. The voltage overshoots are very dangerous because it may involve anomalous degradation of active materials by the repeated charge-discharge processes and eventually it leads to severe problems in battery safety. In addition, the addition of a small amount of LiCoO2 (LCO), the cathode active material of conventional lithium-ion batteries, into the LFP will be discussed as a way of solving the voltage overshoots.
2. Experimental
For the LFP, which served as a cathode active material, we used a commercial product (Life Power®, P2 Grade, Süd-Chemie), which contained 2–3 wt.% of carbon and had an average diameter of 0.5–1 μm and a specific surface area of 12–18 m2 g−1. For the LCO, which served as both the active material and blending additive of a cathode, we used another commercial product (KD-10, Umicore), which had an average diameter of 10 μm. For graphite, which served as an anode active material, we used a pitch-coated natural graphite (XG-15A, Carbonix), consisting of potato-shaped particles with an average diameter of 15 μm.For the graphite anode sheet, XG-15A (92 wt.%) and poly(vinylidene fluoride) (PVdF, Aldrich) binder (8 wt.%) were mixed with a N-methyl-2-pyrrolidone solvent for 5 h using a mechanical stirrer to give a homogeneously dispersed viscous slurry. The slurry was then coated on both sides of a Cu foil (10 μm thick, serving as an anodic current collector), dried through two zones of a drying chamber at 110 and 130 °C, and then pressed with a double-roll press at a line pressure of 1![[thin space (1/6-em)]](https://www.rsc.org/images/entities/char_2009.gif) 000 kgf cm−1 to yield a thin-film anode sheet (120 μm thick including Cu foil).
000 kgf cm−1 to yield a thin-film anode sheet (120 μm thick including Cu foil).
For the LFP cathode sheet, a viscous slurry was prepared by mixing the LFP powder (90 wt.%), carbon black (Super P, Timcal) (5 wt.%) as a conductive agent, PVdF powder (5 wt.%) as a polymer binder, and N-methyl-2-pyrrolidone as a solvent. The cathode sheet was then produced by coating the slurry on both sides of an Al foil (15 μm thick, serving as a cathodic current collector), drying in an oven at 120 °C for 5 h, and finally pressing with a double-roll press at a line pressure of 1,000 kgf cm−1 to yield a thin-film cathode sheet (130 μm thick including Al foil). For the LFP-LCO blend cathode sheets, two electrodes with the LFP![[thin space (1/6-em)]](https://www.rsc.org/images/entities/char_2009.gif) :
:![[thin space (1/6-em)]](https://www.rsc.org/images/entities/char_2009.gif) LCO compositions of 9
LCO compositions of 9![[thin space (1/6-em)]](https://www.rsc.org/images/entities/char_2009.gif) :
:![[thin space (1/6-em)]](https://www.rsc.org/images/entities/char_2009.gif) 1 and 8
1 and 8![[thin space (1/6-em)]](https://www.rsc.org/images/entities/char_2009.gif) :
:![[thin space (1/6-em)]](https://www.rsc.org/images/entities/char_2009.gif) 2 (w/w) were prepared under the same conditions as those described for the preparation of the LFP cathode sheet.
2 (w/w) were prepared under the same conditions as those described for the preparation of the LFP cathode sheet.
Lithium half-cells with 1 and 10 mAh-classes were fabricated in a size-controlled pouch by sequentially superimposing an LFP electrode (pre-cut to the size adjusted by the capacity-class), a porous polyethylene separator (Celgard), and the lithium foil, followed by injecting the electrolyte solution (1 M LiPF6 dissolved in an equal-volume mixture of ethylene carbonate and dimethyl carbonate), and finally by vacuum-sealing the pouch. The 165 mAh-class LFP-based full-cell was fabricated by sequentially rolling the superimposed layers of the LFP cathode sheet, the polyethylene separator, and the graphite anode sheet together like a jelly-roll, then injecting the electrolyte solution and vacuum-sealing the pouch. The 2.7 mAh-class full-cell using the LFP-LCO blend cathode sheet was fabricated by sequentially superimposing the LFP-LCO electrode sheet, the polyethylene separator and the graphite anode sheet, and then injecting the electrolyte solution and vacuum-sealing the pouch. The 550 mAh-class full-cell using the LFP-LCO blend cathode sheet was fabricated by sequentially rolling the superimposed layers of the LFP-LCO blend cathode sheet, the polyethylene separator, and the graphite anode sheet together like a jelly-roll, then injecting the electrolyte solution and vacuum-sealing the pouch. The 192 mAh-class LCO-based full-cell was fabricated into a coin-type cell by sequentially rolling the superimposed layers of the LCO cathode sheet, the polyethylene separator, and the graphite anode sheet together like a jelly-roll, then injecting the electrolyte solution and vacuum-sealing the coin-type cell (2450, 2.4 mm thick, 50 mm diameter). All of the fabrication steps were performed in a moisture-free dry room (dew point <−40 °C).
All of the half- and full-cells were first charged and discharged at a 0.2 C-rate. These cells were step-charged, according to the step-charging protocol consisting of consecutive constant-current steps of 0.01, 0.05, 0.1, 0.2, 0.1, 0.05, and 0.01 C-rates. The basic protocol was applied equally to all three stages. The three voltage stages were determined by examining the shoulders between the step and plateau voltage profile ranges. For instance, the shoulders for the lithium half-cells were determined to be 3.5 and 3.8 V, whereas the shoulders for the full-cells were 3.3 and 3.5 V, as shown in Fig. 1. As shown in Table 1, each step was completed within a pre-specified time period, e.g., M1, M2, M2′, and M3. These periods were determined through an optimal calculation in which the accumulated multiplies between currents and their periods were adjusted to approximately satisfy their capacity-class values. The values of the periods were indicated in each caption of the voltage profile figures.
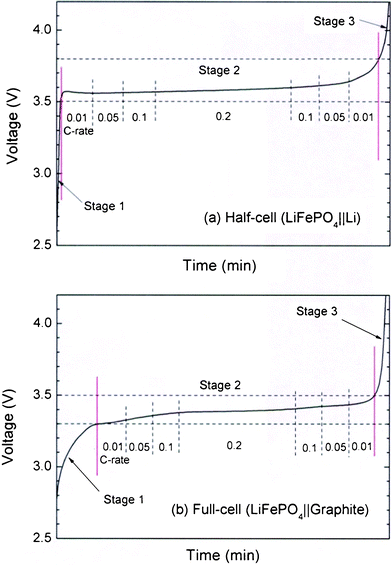 | ||
| Fig. 1 Typical charge profiles at 0.2 C-rate and examples of current rates applied at each of the stages for LFP-based (a) lithium half-cell and (b) full-cell. | ||
| Step current (C-rate) | 0.01 | 0.05 | 0.1 | 0.2 | 0.1 | 0.05 | 0.01 | ||
|---|---|---|---|---|---|---|---|---|---|
| a Stages 1, 2, and 3 for half-cells correspond to the voltage ranges of 2.5–3.5 V, 3.5–3.8 V, and 3.8–4.2 V, respectively. Also, stages 1, 2, and 3 for full-cells correspond to the voltage ranges of 2.5–3.3 V, 3.3–3.5 V, and 3.5–4.2 V, respectively. b Accumulated capacity through the stages 1 to 3 is estimated to be 184.44 mAh. | |||||||||
| LFP-based cells | Stage 1a | Time (min) | M1 | M1 | M1 | M1 | M1 | M1 | M1 |
| Stage 2a | Time (min) | M2 | M2 | M2 | M2′ | M2 | M2 | M2 | |
| Stage 3a | Time (min) | M3 | M3 | M3 | M3 | M3 | M3 | M3 | |
| 192 mAh-class LCO full-cellb | Stage 1a | Time (min) | 7 | 7 | 7 | 7 | 7 | 7 | 7 |
| Capacity (mAh) | 0.22 | 1.12 | 2.24 | 4.48 | 2.24 | 1.12 | 0.22 | ||
| Stage 2a | Time (min) | 50 | 30 | 30 | 85 | 30 | 30 | 50 | |
| Capacity (mAh) | 1.60 | 4.80 | 9.60 | 54.40 | 9.60 | 4.80 | 1.60 | ||
| Stage 3a | Time (min) | 50 | 30 | 30 | 85 | 30 | 30 | 50 | |
| Capacity (mAh) | 1.60 | 4.80 | 9.60 | 54.40 | 9.60 | 4.80 | 1.60 | ||
3. Results and discussion
As shown in Fig. 2, the lithium half-cells including the LFP cathode, exhibit typically long plateaus at about 3.5–3.6 V and 3.3–3.4 V for the charging and discharging processes at 0.2 C-rate, respectively. The difference (0.2 V) in the plateau voltage between the charging and discharging processes originates from the intrinsic internal resistance of the LFP cathode. The long plateaus of the LFP||Li half-cell can be supported by steeply increasing patterns at the initial and final stages of both the charging and discharging processes. However, severely fluctuated charging profiles with highly overshot portions will appear if the step-charging protocol is applied to the 1 and 10 mAh-class LFP||Li half-cells with the step times of M1 = M3 = 3 min, M2 = 60 min, and M2′ = 220 min. The fluctuated charging patterns are influenced by instant current changes in the step-charging with a current lower than 0.2 C-rate. In particular, the overshoots appeared in the initial and final step regions, due to severe changes of current within short periods of time. After the step-charging, the discharging profiles at a 0.2 C-rate appeared as somewhat weakened plateau regions, resulting in decreases in both the operating voltage and cell capacity. A decrease in the cell capacity is an expected result, as the step-charging is performed at current rates lower than the 0.2 C-rate. The decrease in the discharge capacity after step-charging is smaller than 3.5% in the 1 and 10 mAh-class half-cells.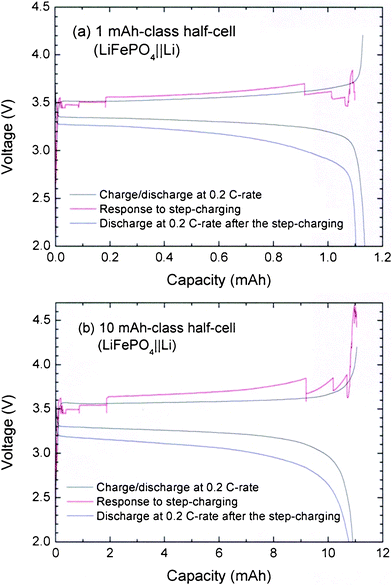 | ||
| Fig. 2 Charge-discharge profiles at the 0.2 C-rate, response to the step-charging, and discharging profile at the 0.2 C-rate after the step-charging for (a) 1 mAh- and (b) 10 mAh-class LFP||Li half-cells. The times for each step are set as M1 = M3 = 3 min, M2 = 60 min, and M2′ = 220 min. | ||
Notably, the overshoots in the voltage profile of the step-charging process essentially come from the intrinsic property of the material. This is evidenced by Fig. 3, which shows that the overshoots also appear when the step-charging protocol is applied to a large capacity-class LFP||graphite full-cell, but not the LFP||Li half-cell. As the capacity-class enlarges to 165 mAh, the step times of the step-charging protocol are also adjusted to M1 = M3 = 12 min, M2 = 40 min, and M2′ = 130 min. The LFP||graphite full-cell obviously shows significant overshoots, especially at the first stage of the steep voltage region. This indicates that the effect of changing the step-charging currents accumulate through stages 1 to 3 before appearing as a huge overshoot. Unlike in the small-capacity cells, shown in Fig. 2, the overshoot intensity increases as the cell capacity increases. In addition, the discharging process at the 0.2 C-rate after the step-charging is expected to show a greater decrease in the discharge capacity (162 → 143 mAh g−1, 11.7%) than those of the small half-cells. This may possibly be due to the loss of electrochemically active sites during the large overshoot at the final stage of the voltage profile.
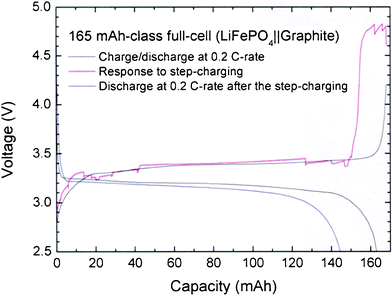 | ||
| Fig. 3 Charge-discharge profiles at the 0.2 C-rate, response to the step-charging, and discharging profile at the 0.2 C-rate after the step-charging for 165 mAh-class LFP||graphite full-cell. The times for each step are set as M1 = M3 = 12 min, M2 = 40 min, and M2′ = 130 min. | ||
In contrast, Fig. 4 shows that, when the step-charging protocol is applied, the LCO exhibits a very stable charging profile, though there are some fluctuations. Of course, the step times for the 192 mAh-class coin-type full-cell consisting of LCO||graphite are somewhat different from the LFP case, as summarized in Table 1. A slight decrease in the discharge capacity is also observed after the step-charging at current rates lower than the 0.2 C-rate. If the lack of voltage overshoot is entirely due to the structural stability of the LCO, it could provide an idea regarding how to solve the voltage overshoot of LFP-based lithium-ion batteries. In particular, it may be possible to achieve a more stabilized voltage profile by blending some of the LCO with LFP particles.
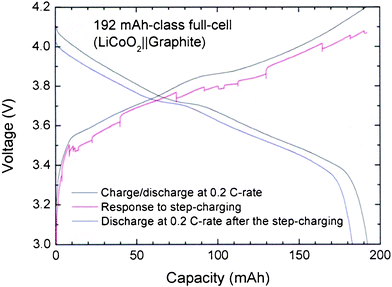 | ||
| Fig. 4 Charge-discharge profiles at the 0.2 C-rate, response to the step-charging, and discharging profile at the 0.2 C-rate after the step-charging for 192 mAh-class LCO||graphite full-cell. The times for each step are listed in Table 1. | ||
The blending concept is realized through the physical mixing of some μm-sized LCO particles with sub-μm-sized LFP particles in LFP![[thin space (1/6-em)]](https://www.rsc.org/images/entities/char_2009.gif) :
:![[thin space (1/6-em)]](https://www.rsc.org/images/entities/char_2009.gif) LCO content ratios of 8
LCO content ratios of 8![[thin space (1/6-em)]](https://www.rsc.org/images/entities/char_2009.gif) :
:![[thin space (1/6-em)]](https://www.rsc.org/images/entities/char_2009.gif) 2 and 9
2 and 9![[thin space (1/6-em)]](https://www.rsc.org/images/entities/char_2009.gif) :
:![[thin space (1/6-em)]](https://www.rsc.org/images/entities/char_2009.gif) 1 (w/w). The charge-discharge profiles of 2.7 mAh-class full-cells containing the LFP-LCO blending cathodes are shown in Fig. 5. For the full-cells, the step times are adjusted to M1 = M3 = 3 min, M2 = 70 min, and M2′ = 150 min. The plateaus appeared at 3.7–3.8 V, corresponding to typical LCO profiles during the charging and discharging processes. As shown in Fig. 5, the voltage responses after the step-charging exhibit strong stability without overshoot over the charge profile at the 0.2 C-rate. The addition of structurally stable LCO compensates for the instability of the LFP and eliminates the overshoot from the step-charging protocol. Moreover, the decrease in discharge capacity is significantly lessened. In addition, the voltage profiles reflect the contributions of each active material in correlation to the contained amounts. The contribution of the LCO, including short plateau regions at 3.7–3.8 V, appears in the initial and final stages of the discharging and charging processes, respectively. As the LCO content increases, the duration of appearing the short plateau increases. It seems that the existence of another small plateau over the long plateau of the LFP may help in buffering or relaxing the complicated states of accumulated currents without resulting in a comparable overshoot.
1 (w/w). The charge-discharge profiles of 2.7 mAh-class full-cells containing the LFP-LCO blending cathodes are shown in Fig. 5. For the full-cells, the step times are adjusted to M1 = M3 = 3 min, M2 = 70 min, and M2′ = 150 min. The plateaus appeared at 3.7–3.8 V, corresponding to typical LCO profiles during the charging and discharging processes. As shown in Fig. 5, the voltage responses after the step-charging exhibit strong stability without overshoot over the charge profile at the 0.2 C-rate. The addition of structurally stable LCO compensates for the instability of the LFP and eliminates the overshoot from the step-charging protocol. Moreover, the decrease in discharge capacity is significantly lessened. In addition, the voltage profiles reflect the contributions of each active material in correlation to the contained amounts. The contribution of the LCO, including short plateau regions at 3.7–3.8 V, appears in the initial and final stages of the discharging and charging processes, respectively. As the LCO content increases, the duration of appearing the short plateau increases. It seems that the existence of another small plateau over the long plateau of the LFP may help in buffering or relaxing the complicated states of accumulated currents without resulting in a comparable overshoot.
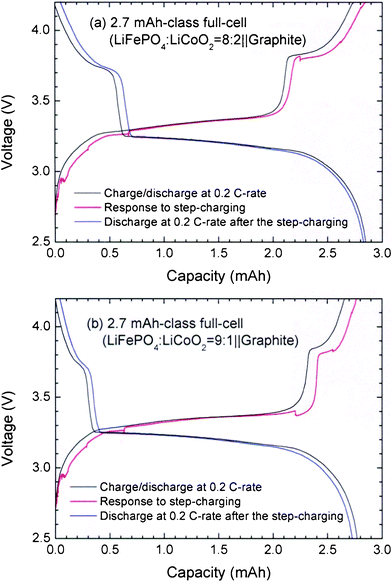 | ||
Fig. 5 Charge-discharge profiles at the 0.2 C-rate, response to the step-charging, and discharging profile at the 0.2 C-rate after the step-charging for 2.7 mAh-class full-cells with the blending ratios of LFP![[thin space (1/6-em)]](https://www.rsc.org/images/entities/char_2009.gif) : :![[thin space (1/6-em)]](https://www.rsc.org/images/entities/char_2009.gif) LCO = (a) 8 LCO = (a) 8![[thin space (1/6-em)]](https://www.rsc.org/images/entities/char_2009.gif) : :![[thin space (1/6-em)]](https://www.rsc.org/images/entities/char_2009.gif) 2 and (b) 9 2 and (b) 9![[thin space (1/6-em)]](https://www.rsc.org/images/entities/char_2009.gif) : :![[thin space (1/6-em)]](https://www.rsc.org/images/entities/char_2009.gif) 1 (w/w). The times for each step are set as M1 = M3 = 3 min, M2 = 70 min, and M2′ = 150 min. 1 (w/w). The times for each step are set as M1 = M3 = 3 min, M2 = 70 min, and M2′ = 150 min. | ||
When enlarging the capacity of batteries containing LFP-LCO blending active materials, overshoots over the voltage profile obtained at the 0.2 C-rate do not appear, as shown in Fig. 6. In the 550 mAh-class full-cells, the step times are adjusted to M1 = M3 = 10 min and M2 = M2′ = 86 min. Without the overshoot, the fluctuating patterns in the responses to the step-charging are not severe, even though the cell capacity enlarges by more than 200 times, and the decrease in discharge capacity after the step-charging maintains. Thus, the structural stability of the LCO constituent, extends the practical operating voltage range up to 4.0 V while simultaneously absorbing the overshoot debris which occurs due to accumulated currents within the LFP.
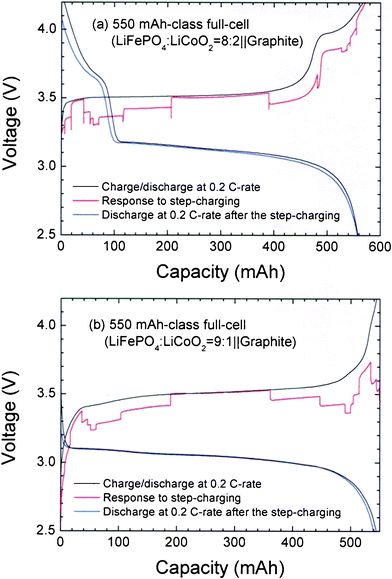 | ||
Fig. 6 Charge-discharge profiles at the 0.2 C-rate, response to the step-charging, and discharging profile at the 0.2 C-rate after the step-charging for 550 mAh-class full-cells with the blending ratios of LFP![[thin space (1/6-em)]](https://www.rsc.org/images/entities/char_2009.gif) : :![[thin space (1/6-em)]](https://www.rsc.org/images/entities/char_2009.gif) LCO = (a) 8 LCO = (a) 8![[thin space (1/6-em)]](https://www.rsc.org/images/entities/char_2009.gif) : :![[thin space (1/6-em)]](https://www.rsc.org/images/entities/char_2009.gif) 2 and (b) 9 2 and (b) 9![[thin space (1/6-em)]](https://www.rsc.org/images/entities/char_2009.gif) : :![[thin space (1/6-em)]](https://www.rsc.org/images/entities/char_2009.gif) 1 (w/w). The times for each step are set as M1 = M3 = 10 min and M2 = M2′ = 86 min. 1 (w/w). The times for each step are set as M1 = M3 = 10 min and M2 = M2′ = 86 min. | ||
Notably, Fig. 6 shows that the full-cell with an LFP![[thin space (1/6-em)]](https://www.rsc.org/images/entities/char_2009.gif) :
:![[thin space (1/6-em)]](https://www.rsc.org/images/entities/char_2009.gif) LCO = 8
LCO = 8![[thin space (1/6-em)]](https://www.rsc.org/images/entities/char_2009.gif) :
:![[thin space (1/6-em)]](https://www.rsc.org/images/entities/char_2009.gif) 2 ratio exhibits plateaus obviously originated from LCO inclusion, whereas a full-cell with a 9
2 ratio exhibits plateaus obviously originated from LCO inclusion, whereas a full-cell with a 9![[thin space (1/6-em)]](https://www.rsc.org/images/entities/char_2009.gif) :
:![[thin space (1/6-em)]](https://www.rsc.org/images/entities/char_2009.gif) 1 ratio does not. It seems to be due to the small content of the LCO and its good dispersion within LFP particles, such that the plateau property of the LCO is sufficiently immersed in the voltage profile of the LFP. In Fig. 6b, a trace of the LCO plateau can be observed as a small shoulder at about 3.7 V in the charge profile. Another reason why the electrode performance can be upgraded is the enhancement of packing density brought by the addition of LCO, which features a different particle size19 from LFP.
1 ratio does not. It seems to be due to the small content of the LCO and its good dispersion within LFP particles, such that the plateau property of the LCO is sufficiently immersed in the voltage profile of the LFP. In Fig. 6b, a trace of the LCO plateau can be observed as a small shoulder at about 3.7 V in the charge profile. Another reason why the electrode performance can be upgraded is the enhancement of packing density brought by the addition of LCO, which features a different particle size19 from LFP.
4. Conclusions
In this study, a step-charging current protocol that effectively simulates the charging from a piezoelectric device is applied to LFP-based lithium-ion batteries. Sub-μm-sized LFP-based half- and full-cells with various capacity-classes typically show complicated fluctuating responses marked by voltage overshoots. In order to overcome this problem, a simple method of blending a small amount of μm-sized LCO with the LFP is proposed, resulting in the disappearance of the voltage overshoots. In response to irregular charging conditions, the addition of structurally stable LCO, with a different particle size from that of the original active material, yields more stable voltage profiles.Acknowledgements
This work was partially supported by the IT R&D Program of MKE/KEIT (KI002077, EPMIC technology based on self-chargeable power supply module, 50%). Also, this research was partially supported by the Converging Research Center Program through the Korean Ministry of Education, Science and Technology (2011K000641, 50%).References
- G. Nagasubramanian, R. G. Jungst and D. H. Doughty, J. Power Sources, 1999, 83, 193 CrossRef CAS.
- Y. Saito, J. Power Sources, 2005, 146, 770 CrossRef CAS.
- S. S. Zhang, K. Xu and T. R. Jow, J. Power Sources, 2006, 160, 1349 CrossRef CAS.
- J. Li, E. Murphy, J. Winnick and P. A. Kohl, J. Power Sources, 2001, 102, 302 CrossRef CAS.
- G. Sikha, P. Ramadass, B. S. Haran, R. E. White and B. N. Popov, J. Power Sources, 2003, 122, 67 CrossRef CAS.
- S. S. Zhang, J. Power Sources, 2006, 161, 1385 CrossRef CAS.
- P. E. de Jongh and P. H. L. Notten, Solid State Ionics, 2002, 148, 259 CrossRef CAS.
- B. K. Purushothaman and U. Landau, J. Electrochem. Soc., 2006, 153, A533 CrossRef CAS.
- P. Harrop and R. Das, Energy Harvesting and Storage for Electronic Devices 2009-2019, IDTechEx, 2009, pp. 10 Search PubMed.
- A. K. Padhi, K. S. Nanjundaswamy, C. Masquelier, S. Okada and J. B. Goodenough, J. Electrochem. Soc., 1997, 144, 1609 CrossRef CAS.
- J.-M. Tarascon and M. Armand, Nature, 2001, 414, 359 CrossRef CAS.
- A. S. Aricò, P. Bruce, B. Scrosati, J.-M. Tarascon and W. van Schalkwijk, Nat. Mater., 2005, 4, 366 CrossRef.
- V. Etacheri, R. Marom, R. Elazari, G. Salitra and D. Aurbach, Energy Environ. Sci., 2011, 4, 3243 CAS.
- H. Huang, S.-C. Yin and L. F. Nazar, Electrochem. Solid-State Lett., 2001, 4, A170 CrossRef CAS.
- F. Croce, A. D'Epifanio, J. Hassoun, A. Deptula, T. Olczac and B. Scrosati, Electrochem. Solid-State Lett., 2002, 5, A47 CrossRef CAS.
- G. Arnold, J. Garche, R. Hemmer, S. Ströbele, C. Vogler and M. Wohlfahrt-Mehrens, J. Power Sources, 2003, 119-121, 247 CrossRef CAS.
- C. Delacourt, P. Poizot, J.-M. Tarascon and C. Masquelier, Nat. Mater., 2005, 5, 254 CrossRef.
- B. Ellis, L. K. Perry, D. H. Ryan and L. F. Nazar, J. Am. Chem. Soc., 2006, 128, 11416 CrossRef CAS.
- K. M. Kim, S. H. Lee, S. Kim and Y.-G. Lee, J. Appl. Electrochem., 2009, 39, 1487 CrossRef CAS.
| This journal is © The Royal Society of Chemistry 2012 |
