Experiments and modeling of HMX granular explosives subjected to drop-weight impact
Yan-Qing
Wu
*,
Feng-Lei
Huang
and
Zhong-Ya
Zhang
State key Laboratory of Explosion Science and Technology, Beijing Institute of Technology, 100081, Beijing, P. R. China
First published on 22nd February 2012
Abstract
The drop-weight impacts on a thin layer of cyclotetramethylene tetranitramine (HMX) explosive particles have been performed. The drop-weight impact machine is equipped with high-speed photographic techniques. Effects of drop heights and the amount of particles on compaction, deformation, and thermal responses were investigated. Considering the contact plasticity, friction, melting, fracture, as well as chemical reaction, an analytical model based on heating and kinematics equations for a single layer of explosive particles has been developed. The calculated average pressure, loading time and time-to-ignition agree well with experimental measured ones. Threshold conditions for ignition can be derived from the predicted temperature history curves. Individual particles’ pressure–strain exhibited stress–strain-like relationships, from which close relations can be found between experimental phenomena and the material's softening/hardening characteristics.
1. Introduction
Impact sensitivity is one of the most important safety concerns. Historically, drop-weight impact sensitivity for explosive material is usually expressed as the required height to cause a reaction in half of the samples tested (H50).1,2 The greatest advantages of the drop weight test are flexibility, extended input energy range, simple operation, and the possibility of testing particle beds.3 Unfortunately, explosive sensitivity rankings from various laboratories do not agree well, partly due to various “Go” criteria used by different operators.In order to overcome key limitations of the drop weight test, many researchers have developed some novel correlation methods for predicting impact sensitivity.4–7 A drop-weight impact apparatus equipped with high-speed photography (HSP) was designed to examine the initiation mechanisms of several explosives.8,9 Threshold for ignition can be quantified using the hybrid apparatus,10,11 and a comparison of the mechanical properties and ignition conditions with that of a Steven test was also conducted.12
Even for the same explosive particles, the amount or layout of particles, machine stiffness and friction characteristics may affect H50 values. A thermal ignition due to low-velocity impact cannot be explained at the macroscopic scale, but rather at the microscopic one.13–15 The course of the reaction instead of a simple Go/No Go criterion in evaluating sensitivity is emphasized in the present study. This also necessitates more effort in a theoretical model16–18 for examining how mechanical energy is converted into localized heat.
Dynamic finite element analysis of a drop weight impact has been conducted for parametric studies.19 Friedman numerically correlated thermal explosion with the impact sensitivities of several explosives.20 Francis and Cuthbert used finite element analysis of the drop-weight test to calculate the temperature in the localized zones near the sample periphery.21 In the drop-weight system, ignition by adiabatic shear bands, trapped gas spaces, viscous flow, friction, fracture and triboluminescent discharge has been discussed.22
However, for a thin layer of impacted particles, finite element simulation does not present a clear advantage. The present paper establishes an analytical model through working out kinematic equations coupled with heating equations. Contact plasticity, frictional heating and fracture are considered to be hot-spot sources at the particle level. The calculated results combined with photographic observations enable us evaluate possible ignition hazards of impacted explosives.
2. Experimental
2.1 Modified drop-weight apparatus
Some components of the drop-weight machine were modified to allow high-speed photographic observations of dynamic compression events of granular explosives in our laboratory. The schematic diagram is shown in Fig. 1, similar to the method used by Heavens and Field.23 Both the upper drop weight and bottom case were made from cast iron, in which grooves were machined to assemble mirrors and toughened glasses (shown in Fig. 2). The drop-weight has a mass of 5.782 kg and was guided by three rods. Prior to performing the impact, the height of the light source is adjusted so as to be aligned with the upper embedded mirror. The impact responses were photographed at a frame interval of 10 μs using a FASTCAM SA5 camera. Target HMX explosive particles are in the size range 0.6∼1.0 mm (in Fig. 3), prepared by China Academy of Engineering Physics.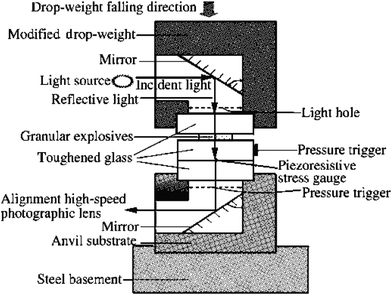 | ||
| Fig. 1 Schematic diagram of the drop-weight and optical system | ||
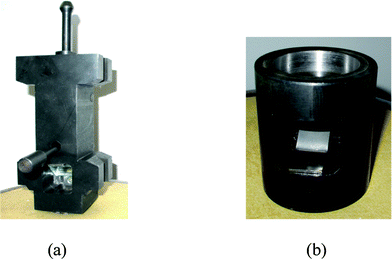 | ||
| Fig. 2 Photograph of modified (a) drop weight and (b) anvil base. | ||
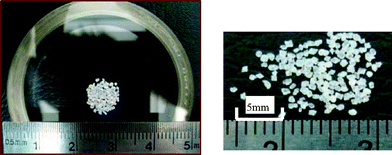 | ||
| Fig. 3 Photograph of HMX energetic particles for experiment investigation | ||
2.2 Experimental results
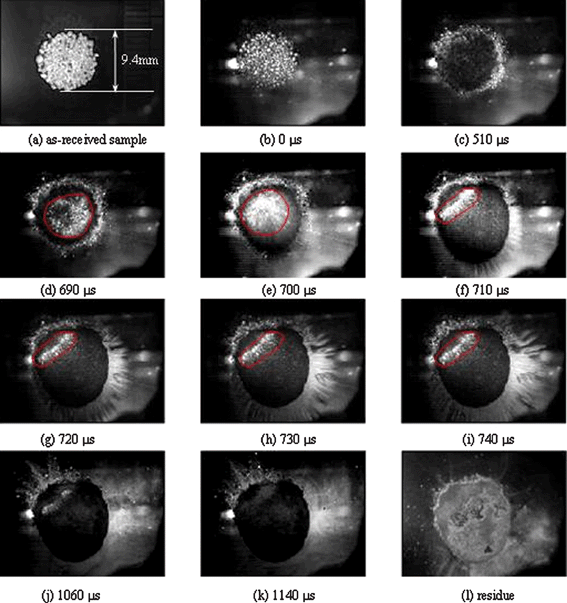 | ||
| Fig. 4 Selected high speed photographic frames showing responses of 32.0 mg HMX particles with 15.0 cm height impact, with recording starting from surface impact with particles. | ||
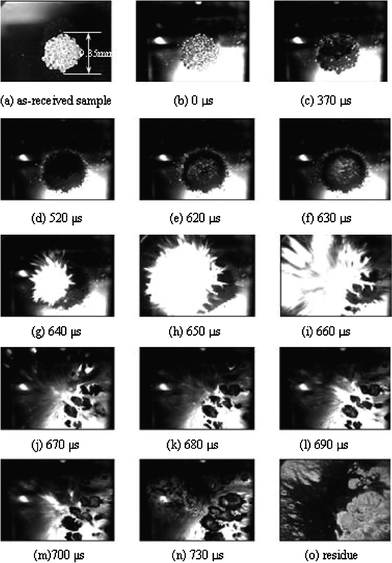 | ||
| Fig. 5 Selected high speed photographic frames showing responses of 31.5 mg HMX particles with 20.0 cm height impact, with recording starting from surface impact with particles. | ||
Below 0.15 m drop height, the input energy was not enough for ignition to occur in the sample. Fig. 4 presented the selected frames, where the layer was compacted with 2.9 m s−1 radial expansion rate prior to transparency appearance till 510 μs. Such transparency should be a combination of local particle melting or weak ignition. Several localized regions (marked by red curves) changed color from dark to milky (frames (d)–(i)). The white-colored central area changed to a relatively narrow band along with the impact (frame (f)–(j)). Interestingly, strong jetting preferentially occurred at the below right from 720 to 740 μs. Afterwards, some ejections occurred at the upper left portion from 1060 to 1140 μs. Such localized ejections must be one main mechanism for heat loss. Till the final stage, no visible burning front appeared so that this particular impact left a substantial amount of unconsumed sample as shown in Fig. 4(l).
In Fig. 5, increasing the drop height to 0.2 m, a translucent zone formed from 620 to 630 μs. The rate at which the hot-spots coalesced together to form a burning front can be very rapid, which was first observed at 640 μs and continued to grow till 660 μs. The burning front began to die out soon from 670 μs. As can be seen, no jetting phenomena have been observed in the higher drop height burning case.
The traces of radial expansion area against time corresponding to 0.15 and 0.2 m are presented in Fig. 6. For the 0.15 m drop-height impact (‘circle’ symbol), two turning points appeared at 680 μs and 1040 μs. The first one referred to the onset of transparency and the second one corresponded to strong jetting. It clearly revealed that the plastic flow was initiated at 370 μs and ended upon the occurrence of transparency. When the drop-height increased to 0.2 m (‘triangle’ symbol), an abrupt rise in the expansion area occurred at 620 μs, resulting from a central large-scale transparency. It seemed that a sharp rise in layer area always occurred at the instant of transparency or strong jetting. Variation of the layer area is closely related with the mechanical and chemical responses.
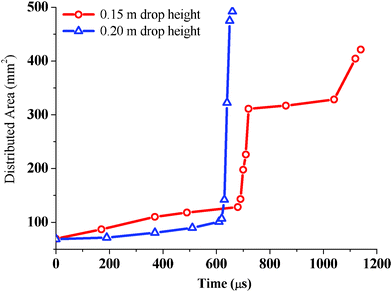 | ||
| Fig. 6 Plots of distributed area against time for 31.5–32.0 mg HMX granular explosives for two different drop heights. | ||
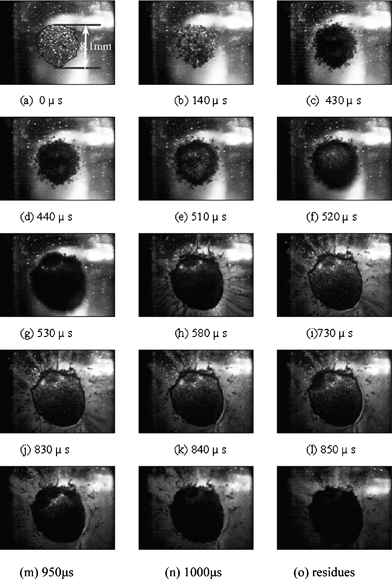 | ||
| Fig. 7 Selected high speed photographic frames showing responses of HMX particles with a mass of 30.0 mg under 20.0 cm-height impact. | ||
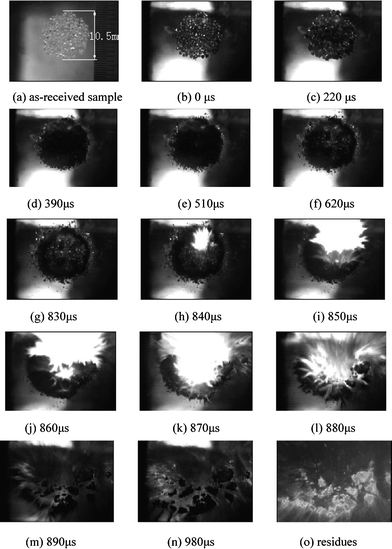 | ||
| Fig. 8 Selected high speed photographic frames showing responses of HMX particles with a mass of 50.0 mg under 20.0 cm-height impact. | ||
For the smaller amount of particles with 30.0 mg in Fig. 7, the compacted layer did not expand rapidly because most of the particles did not undergo severe plastic deformation till 440 μs. Several weak bright spots formed at the upper part of the sample by 510 μs. Minor transparency meant that weak hot spot ignition events took place. Accompanied by very weak hot-spot formation, at 580 μs, strong jetting first occurred at the periphery. No macroscopic observable burning front appeared till the final stage. We explain that burn seldom occurs after undergoing intense jetting. For 30.0 mg particles, localized hot spot ignition was rather feeble, leaving an appreciable quantity of residues.
In Fig. 8, for 50.0 mg particles, a very weak transparent region at the upper center was the sign of hot-spot formation during the period of 620 to 830 μs. By 840 μs, evidence of the burning front can be clearly observed as a result of coalescence of already existing hot spots. Following the formation of one burning site, burning develops rapidly from 840 μs to 870 μs. At 880 μs, although bright flame still existed, violent burning was quenched with the majority of sample consumed.
Figs. 7 and 8 present some evidence of the amounts of total particles influencing the violence of reaction when the loose extent remained mainly the same. The photographic frames implied that interaction among particles made the sample more sensitive. Transparency occurred for both 30.0 mg and 50.0 mg while the occurrence time was different. The most important difference was that the intense burning front could develop more easily from hot spots for 50.0 mg explosive charge than from 30.0 mg explosive particles. This means that enough particles are a necessary prerequisite for growth to burning because interactions among hot spots or hot spots coalescence will increase the probability of burn or explosion.
Radial expansion areas against time for both 30.0 and 50.0 mg particles under 0.20 m drop-heights are presented in Fig. 9. For the 30.0 mg sample, the area increased slowly and linearly with time prior to a sudden rise corresponding to transparency at 490 μs. The rapid rise in occupied area continued until the occurrence of strong jetting at 580 μs, after which it entered into a flat stage. For the 50.0 mg sample, sharp changes in expansion area curves appeared just prior to the moment of burning formation (at 830 μs). It has been noted that transparency, jetting and hot-spot growth may be a result of sharp changes in radial expansion.
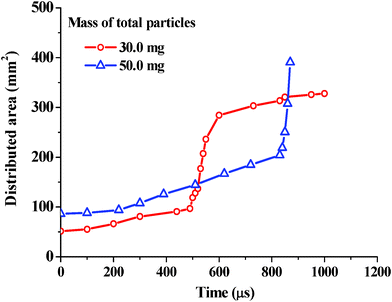 | ||
| Fig. 9 Plots of expansion area against time for HMX granular explosives with 30.0 and 50.0 mg, with the same distributed loose extent under 20.0 cm impacts. | ||
3. Model description
Impact initiation in HMX granular explosives can be divided into three phases: (1) upon being impacted, kinematic energy is partly absorbed by the sample; (2) ignition occurs at a localized area or cools by conduction if the energy density is low; (3) ignited hot-spots coalesce and grow to support self-sustained deflagration or quench due to heat losses.24 The first and the second phases will be the emphasis of the present model.When we chose 23 particles and arranged them with large spacing between any neighboring ones, the majority of the particles are broken into small fragments as shown in Fig. 10. More particles were crushed and then linked up with each other on their edges in frames (e)–(g). Some bright spots corresponded to substantial heating in local contact and friction regions. Although individual particles were compressed seriously, no visible burning appeared till the final stage because almost no mutual thermal interaction appeared in this case.
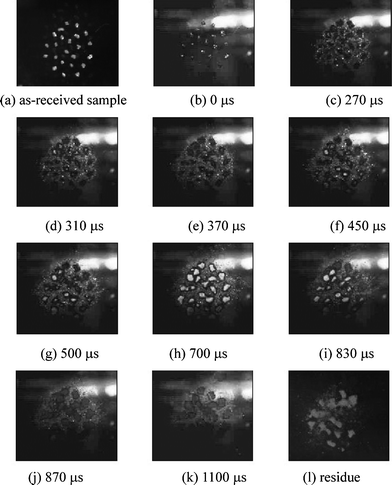 | ||
| Fig. 10 Selected high-speed photographic frames showing the responses of a small amount of individual HMX powders under a 20.0 cm-height impact. No serious mutual interactions exist among the particles and no visible burning sites are detected. | ||
3.1 Mechanical and thermal formulations
Fig. 11(a) described the approach for modeling a layer of widely-spaced particles between upper and below toughened glass anvils. An illustrative graph was presented in Fig. 11(b) to explain the contact deformation of an individual particle prior to breakage. When the maximum shear stress τmax along a fracture plane exceeds HMX fracture strength τ0, part of the strain energy will be transformed into fracture energy, as shown in Fig. 11(c).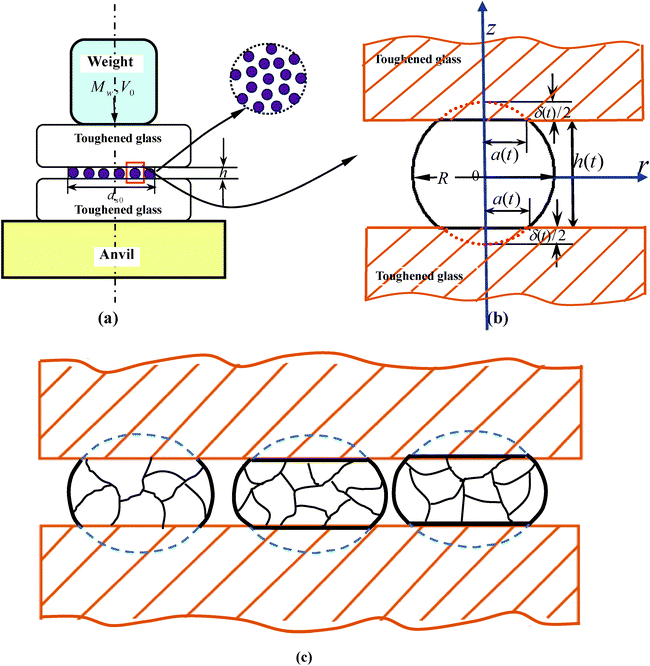 | ||
| Fig. 11 Simplified schematics of (a) global drop-weight impact system; (b) partially enlarged detail of deformation quantities of one particle; (c) fracture particle and fragments. | ||
To simplify the calculations, we assume that the sample consists of a small amount of equal-sized and widely-spaced spherical particles in which the localized ignited sites do not form any macroscopic burning fronts. The explosive charge was compressed by the upper falling striker, whose motion can be determined from momentum balance,
 | (1) |
| h(t) = d0 − δ(t) | (2) |
| δ(t) = zu − zb | (3) |
For establishing an analytical model, a one-dimensional wave is assumed to propagate along the loading direction and no reflection wave emerges.25,26 Acceleration of the bottom anvil can be estimated by,
 | (4) |
| Fc(t) = Fce(t) = N K[δ(t)/2.0]3/2 t ≤ telast | (5) |
| ptrc (t) = Fc(t)/(Nπa2(t)) | (6) |
 | (7) |
Application of the von Mises yield criterion to a thin layer between two rigid cylindrical punches gave a yield stress σy(t) taking into account strain hardening effects,23
 | (8) |
An individual particle's pressure pc(t) should satisfy,
 | (9) |
Radial expansion velocity vp (t) for each particle is assumed to be axisymmetric in motion and deformation during the pressure build-up phase.
 | (10) |
Considering the granular layer as an integrated pressed sample, a circular disc is formed. Posing the axis-symmetric stress analysis, stress components were given by,
 | (11) |
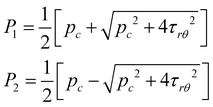 | (12) |
Thus, the maximum shear stress τmax can be calculated by,
 | (13) |
Experimental data have shown that sudden increases in area occurred as a result of mechanical failure or melting of the sample. Here, a sudden jump in the contact depth δ(t) was introduced when breakage occurred or localized sites melted completely.

| (14) |
 | (15) |
During the ignition process, the small heated contact zones were assumed to be independent, resulting in a simple thermal condition around the heated contact regions. Although failure of the material leads to internal surfaces rubbing against each other and generating heat, most of the heat will be dispersed by fragments. Temperature rise due to contact deformation, frictional heating27 and heat of chemical reaction can be obtained by,
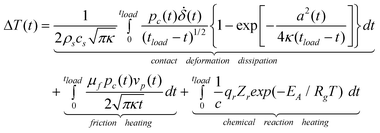 | (16) |
 | (17) |
To solve all the equations, similarity between the fraction of the input kinetic energy absorbed by the sample and total dissipation energies was a governing prerequisite,
 | (18) |
 , with the dropped weight of Mw. The parameter feff represents a certain fraction of the input kinetic energy to be absorbed by the sample. The dissipated energy rate in the sample was written by,
 | (19) |
 is the fracture energy rate and
  is the new surface production energy rate. γ is the surface energy. ȦF is the changing rate of fragmentation area. The determination of AF can refer to ref. 28 and vs(t) is evaluated by consulting ref. 29.
3.2 Calculated results
| HMX | PETN | |
|---|---|---|
| a Measured in our laboratory but not published. | ||
| Density ρs (kg m−3) | 1910.0a | 1760.030 |
| Specific heat cs (J kg−1 K−1) | 1250.031 | 1090.031 |
| Poisson's ratio νp | 0. 3232 | 0.2233 |
| Thermal diffusivity κ (m2 s−1) | 2.198e−734 | 1.303e−735 |
| Young modulus Ep (GPa) | 24.034 | 13.736 |
| Shear modulus (GPa) | 12.0a | 5.037 |
| Yield strength (MPa) | 125.038 | 60.038 |
| Critical shear stress τ0 (MPa) | 103.039 | 34.740 |
| Fracture surface energy γ (J m−2) | 0.0641 | 0.1141 |
| Radius of particles in calculation R (μm) | 200.0 | 200.0 |
| Drop weight in experiments Mw(kg) | 5.78a | |
| Friction coefficient between HMX and glass μf | 0.2a | — |
| Friction coefficient between PETN and glass μf | — | 0.197a |
| Reaction heat release per mass qr (J kg−1) | 5.84e642 | 2.35e644 |
| Pre-frequency factor Zr (s−1) | 5.0e1942 | 6.3e1944 |
| Activation energy EA (J mol−1) | 1.65e542 | 1.93e531 |
| Latent heat of fusion qλ (J kg−1) | 2.2e543 | 1.44e531 |
| Melting point Tm (K) | 552.045 | 414.046 |
| Young's modulus of toughened glass Eg (GPa) | 206.0a | |
| Poisson's ratio of toughened glass νg | 0.3a | |
| Fraction of absorbed energy feff | 0.213 | |
Parameter feff ranging from 0 to 1.0 needed to be determined since still no established data were provided about the fraction of the input kinetic energy absorbed by the specimen. Through least square optimizing calculations, the optimum value for feff is 0.213 for our particular machine systems. Using this value, we can obtain concurrent agreement for the calculated results and experimental data, covering loading time, time-to-ignition, and pressure at various loading conditions. Such a calibration method is mainly applicable to a small amount of explosive particles with weak lateral confinements.
Fig. 12(a) provided the calculated average pressure applied to distributed areas and experimental measured pressure below the base anvil, for samples consisting of 30.5 mg, 1.2 mm diameter particles impacted by a 5.78 kg drop weight falling from 0.2 m drop height. Both experimental and calculated curves presented approximately sinusoidal form and had sudden drops arising from particle fracture. Pressure–time curves measured by Heavens and Field23 also reflected the instantaneous pressure drop. It was noted that the half sine wave loading has been superimposed on an oscillation due to natural vibration of the striker.
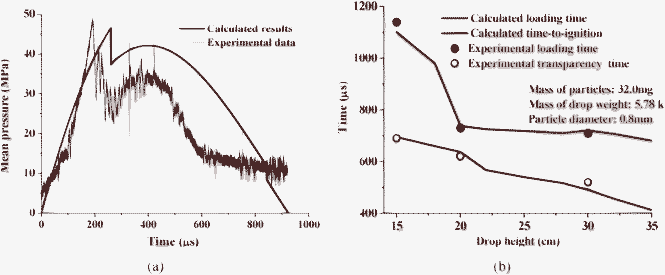 | ||
| Fig. 12 Comparisons between experimental and calculated (a) average pressure measured below the base anvil for HMX energetic particles with 1.2 mm diameter and 20.0 cm drop height; (b) loading time and time-to-ignition for different drop-height impacts. | ||
Fig. 12(b) compared the calculated and experimental loading time, as well as time-to-ignition. When the falling velocity of the drop weight decreased to zero, the loading phase is ended. With drop height increased, experiments and calculations obtained shorter loading time. From the experimental selected frames, occurrence time of transparency can be easily determined. We found that calculated time-to-ignition and transparency occurrence time agreed very well. This implies that a local bright spot may correspond to local weak hot-spot ignition. The model can predict to what extent the ignition process is promoted by increased drop heights.
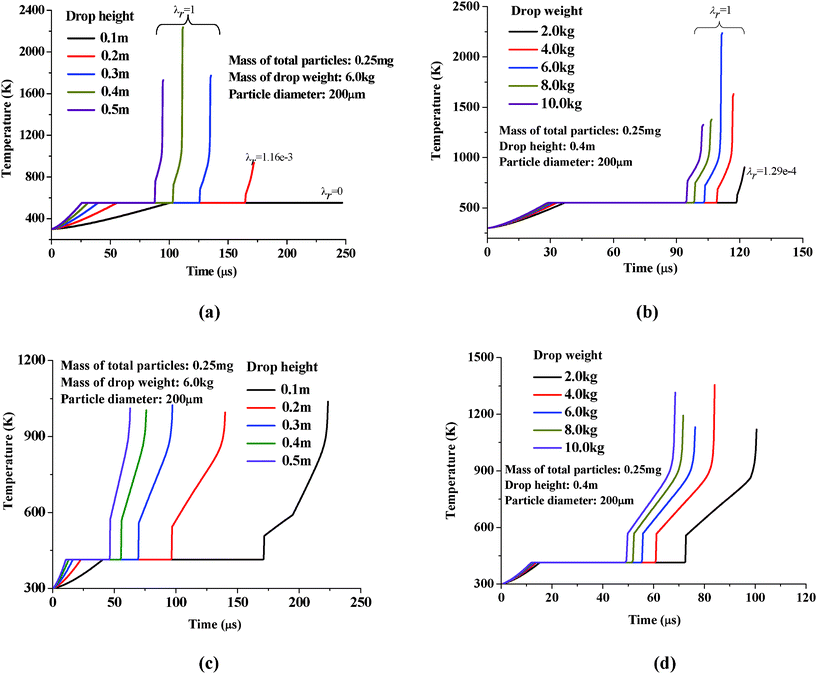 | ||
| Fig. 13 Effects of (a) drop heights, (b) drop weights for HMX particles and (c) drop heights, (d) drop weights for PETN particles on predicted temperature histories at localized contact zones when keeping other conditions unchanged. | ||
In addition to the drop height, mass of drop weight is also an important factor which should be taken into account in evaluation of impact sensitivity of explosives. The calculations are all performed under 0.4 m drop height for samples with 0.25 mg mass and 200 μm diameter particles. From Fig. 13(b), no ignitions occur for drop weights of 2.0 kg, where the maximum localized reaction fractions approach 1.29e−4. When the drop weights are 4.0, 6.0, 8.0, and 10.0 kg, times-to-ignition are 117.1, 111.7, 106.6, and 102.6 μs, respectively. It's evident that increases of the drop weight mass accelerate occurrence of ignition.
Similar studies were performed for a single layer of PETN granular explosives. Fig. 13(c) and (d) present the temperature histories of PETN subjected to impacts by different drop heights and different drop weights with all other conditions being kept the same. It has been found that ignition occurred more quickly in PETN than in HMX explosive particles. For example, when subjected to 0.1 m and 0.2 m drop-weight impact, ignition could not occur in HMX particles. However, for PETN explosive particles, the calculated times to ignition are 223.4 and 139.9 μs at 0.1 m and 0.2 m drop-height impacts. Comparing Fig. 13(b) with (d), it has also been noted that ignition could occur at 100.48 μs for PETN explosives but no ignition in HMX when subjected to 2.0 kg drop-weight impacts. For secondary explosives, the role played by gas phase can be neglected. The model can predict effects of sensitivity to ignition on drop height and drop weight.
Each temperature history curve has a flat stage at the melting point of the material, as the pressure-dependent melting point is not accounted for. The particle undergoes fracture in the time that local melting appears. Hence, breakage effects could not be manifested in temperature history curves, but can be revealed from particle pressure–strain curves in subsequent results.
From temperature history curves, time-to-ignition versus a range of amounts of explosive particles and frictional coefficients can be generated to provide ignition threshold. As shown in Fig. 14(a), for HMX granular samples of 0.04–0.4 mg mass with 200 μm diameter, time-to-ignition increases with increasing mass of total particles. Under 0.2, 0.4, and 0.6 m drop heights, ignition will not occur for samples above 0.263, 0.317, and 0.353 mg, respectively. The dashed lines mark the threshold value of the particle mass, above which the sample cannot be ignited.
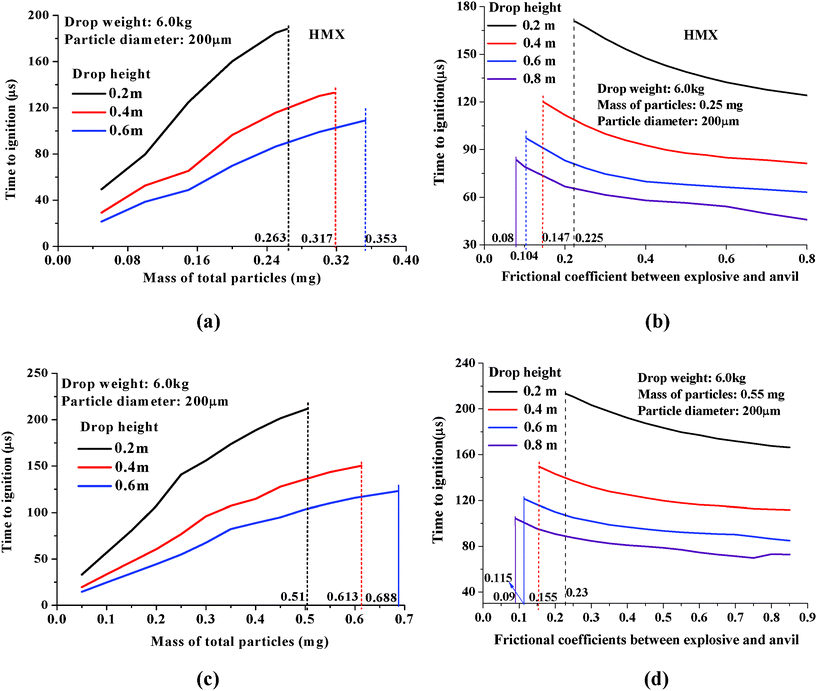 | ||
| Fig. 14 Predictions of dependence of time-to-ignition on (a) mass of total particles and (b) frictional coefficient between particle and anvil surfaces for HMX samples consisting of 0.25 mg, 200 μm diameter particles; (c) mass of total particles and (d) frictional coefficient between particle and anvil surfaces for PETN samples consisting of 0.55 mg, 200 μm diameter particles. | ||
Contributions of frictional coefficient between explosive and impacting surface to ignition is of particular interest but little work is done. Fig. 14 (b) presented times-to-ignition vs. frictional coefficients between HMX explosives and impacting surface subjected to different drop-height impacts, with the drop weight of 6.0 kg, and 0.25 mg particles of 200 μm in diameter. Each curve provides a threshold value of frictional coefficients below which ignition will never occur. The higher the drop height is, the lower the threshold frictional coefficients for ignition to occur.
Accordingly, calculations were performed for impacted PETN explosive particles for the case of 0.2, 0.4, and 0.6 m drop heights. Fig. 14(c) and (d) presented time-to-ignition versus amount of explosive particles and frictional coefficients between explosive and toughened glass. The calculated threshold value for ignition in PETN explosive crystals are 0.51, 0.613 and 0.688 mg for the case of 0.2, 0.4, and 0.6 m drop height impacts, respectively. In Fig. 14(d), we chose a larger amount of PETN (0.55 mg) than HMX explosive particles in Fig. 14(b) as it's very easy to ignite a 0.25 mg PETN sample. The threshold value of frictional coefficient that lead to ignition are very close for PETN and HMX although the quantity of PETN is much larger than HMX. The calculated results show that PETN is much more sensitive than HMX. A rough contact surface tends to promote ignition so as to greatly increase the probability of impact initiation.
When we calculate the temperature rise, the particle's pressure pc(t) needs to be determined and it is not easy to measure it. The stress–strain-like relationships between the calculated particle's pressure pcvs. strain measurement (δ/d0) are presented in Fig. 15. Each particle's pressure–strain curve has an ‘elastic-limit’ below which the particle’s pressure increases linearly with strain. Lower elastic strain is obtained for higher drop heights or heavier drop weights. Softening effects due to fragmentation, melting, or unloading dominate the later stage, which is different from conventional stress–strain curves, with softening caused by a drop in yield stress.
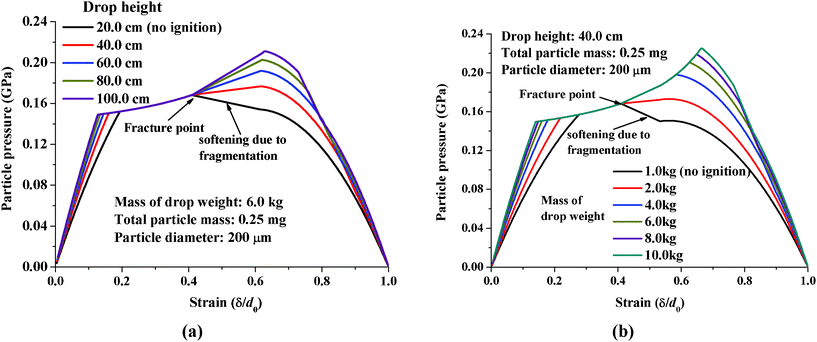 | ||
| Fig. 15 Curves of particle pressure (pc) vs. true strain measurement (pc∼δ/d0) for HMX explosives when subjected to (a) 20.0∼100.0 cm drop height impacts; (b) 1.0∼10.0 kg drop weights with other conditions unchanged. | ||
In Fig. 15(a), for different drop heights, the most evident distinction lies in the later stage after fracture occurs. For a 20.0 cm drop height, no ignition occurs and pc decreases after fracture occurs. But for those ignition cases, pc increases after fracture occurs. In Fig. 15(b), ignition will not occur if softening effects appear immediately after fracture. With heavier drop weights, strain-hardening exists longer after fracture occurs. The higher drop heights and heavier mass of drop weight, the more important part strain-hardening plays in the mechanical behavior.
4. Discussions and conclusions
A series of drop-height impacts indicated the existence of a critical drop-height below which no observable burning occurs. It also showed that strong jetting along the periphery is the main mechanism of heat loss in the case of no visible burning. For the visible burning case at higher drop-height impacts, very fine or even no jetting phenomena was observed. Sharp rise in distributed area always occurred at the instant of transparency, or strong jetting or severe plastic flow. The variability of layer area may explain the violence of reaction during the ignition or burning stage.Responses for different amounts of particles were compared while keeping distributed loose degree and drop height the same. For 30.0 mg particles, weak ignition events took place and no macroscopic observable burning occurs. Strong jetting appeared at the periphery and we explain that burning seldom occurs after undergoing intense jetting. The fastest radial flow speed is 36.0 m s−1 followed by a relatively flat change when no new jetting sites arose. For 50.0 mg particles, a weak transparent region as a sign of hot-spot formation was followed by the formation of one intense burning site and the burning front's rapid propagation. Rapid flow occurs and the expansion speed reaches 93.9 m s−1 in the final stage.
Enough particles are the necessary prerequisite for growth to burning, which implies that interactions among particles make the sample more sensitive. There should be a critical amount below which the thermal interactions among hot spots are not strong enough to be supportive of burning. If the amount of explosive is too small, it usually has weak ignition but it is rare to have burning following the ignition. But more particles may delay the ignition which is supported by our calculation results since the mechanical energy absorbed by each particle decreases.
Responses of 23 separated particles with large spacing provide some basis for modeling. Most of the powders deformed seriously and only link each other at their edges. However, mutual interaction among particles is not sufficient to achieve visible burning. The results highlighted that the initiation sensitivity of explosive particles not only depends on a single particle’s mechanical response but also their mutual interactions.
A thermal-mechanical model is established based on several assumptions, including a given absorbed input energy, equal-sized and spherical particles and one-dimensional wave propagation. This model takes no account of interactions among particles and is primarily appropriate for deformation and ignition stages. Calculated mean pressure, loading time and time-to-ignition agreed very well with the experimental observed quantities.
From the calculated temperature histories, it can be seen that a higher drop height and heavier drop weight accelerate the ignition. The delaying effects on the ignition of reduced frictional coefficients and increased amount of particles can be predicted by the model. It is possible to predict whether or not an explosive charge will be sensitized by other various factors. Threshold conditions for ignition of granular explosive can be directly predicted.
A particle's pressure–strain establishes a picture of the mechanical behavior accompanying the ignition process. For different drop heights, the most evident distinction lies in the stage after fracture occurs. No ignition occurs when a particle's pressure decreases following fracture; but for ignition cases, fracture points are followed by increasing the particle's pressure. Some theoretical understanding of the impact mechanical response related to ignition event can be established based on the particle pressure–strain curves.
Acknowledgements
The authors would like to express gratitude to the Chinese National Nature Science Foundation (Grant No.10902016 and No.10832003) and the support of Beijing Nature Science Foundation (project No. 2113051).References
- K. L. McNesby and C. S. Coffey, Spectroscopic determination of impact sensitivities of explosives., J. Phys. Chem. B, 1997, 101, 3097–3104 CrossRef CAS.
- P. J. Baker and A. M. Mellor, in Energetic materials impact initiation mechanisms, ed. F. L. Dryer, R. F. Sawyer, Physical and Chemical Aspects of Combustion: a tribute to Irvin Glassman, Gordon and Breach Science Publishers, New York, 1997, pp. 289 Search PubMed.
- S. S. Narayanan, Single particle breakage test: a review of principles and application to comminution modeling, Bull. Proc., Australas. Inst. Min. Metall., 1986, 291, 49–58 CAS.
- M. H. Keshavarz, J. Hazard. Mater., 2007, 148, 648–652 CrossRef CAS.
- X. S. Song, X. L. Cheng, X. D. Yang, D. H. Li and R. F. Linghu, Correlation between the bond dissociation energies and impact sensitivities in nitramine and polynitro benzoate molecules with polynitro alkyl groupings., J. Hazard. Mater., 2008, 150, 317–321 CrossRef CAS.
- M. H. Keshavarz and H. R. Pouretedal, Simple empirical method for prediction of impact sensitivity of selected class of explosives, J. Hazard. Mater., 2005, 124, 27–33 CrossRef CAS.
- M. H. Keshavarz and M. Jaafari, Investigation of the Various Structure Parameters for Predicting Impact Sensitivity of Energetic Molecules via Artificial Neural Network., Propellants, Explos., Pyrotech., 2006, 31, 216–225 CrossRef CAS.
- J. P. A. grawal, S. M. Walley and J. E. Field, A high-speed photographic study of the impact initiation of hexanitro-hexaaza-isowurtzitane and nitrotriazolone, Combust., Combust. Flame, 1998, 112, 62–72 CrossRef.
- J. E. Balzer, W. G. Proud, S. M. Walley and J. E. Field, High-speed photographic study of the drop-weight impact response of RDX-DOS mixtures, Combust., Combust. Flame, 2003, 135, 547–555 CrossRef CAS.
- V. S. Joshi, D. L. Budd, E. J. Cart and R. H. Guirguis, Measurement of ignition threshold of explosives using a hybrid hopkinson bar-drop weight test. In: Proc. 13th International Detonation Symposium.Sheraton Waterside Hotel, Norfolk, VA, 2006. pp. 1092–1100 Search PubMed.
- V. S. Joshi, in Recent developments in shear ignition of explosives using hybrid drop weight-hopkinson bar apparatus,Shock Compression of Condensed Matter, ed. M. L. Elert, M. D. Furnish, R. Chau, N. Holmes, J. Nguyen, Springer, New York, 2007, pp. 945–950 Search PubMed.
- V. S. Joshi, in A. novel method of : resolving ignition threshold in Steven test using hybrid drop weight-hopkinson bar, Shock Compression of Condensed Matter, ed. M. L. Elert, W. T. Buttler, M. D. Furnish, W. W. Anderson, W. G. Proud, Springer, New York, 2009, pp.703–706 Search PubMed.
- M. R. Baer, Modeling heterogeneous energetic materials at the mesoscale., Thermochim. Acta, 2002, 384, 351–367 CrossRef CAS.
- R. W. Armstrong, H. L. Ammon, W. L. Elban and D. H. Tsai, Investigation of hot spot characteristics in energetic crystals., Thermochim. Acta, 2002, 384, 303–313 CrossRef CAS.
- N. R. Barton, N. Winter and J. E. Reaugh, Defect evolution and pore collapse in crystalline energetic materials., Model. Sim. Mater. Sci. Eng., 2009, 17(035003), 1–19 Search PubMed.
- S. J. Ye, K. Tonokura and M. Kosh, Energy transfer rates and impact sensitivities of crystalline explosives., Combust. Flame, 2003, 132, 240–246 CrossRef CAS.
- C. Y. Zhang, Y. J. Shu, Y. G. Huang and X. F. Wang, Theoretical Investigation of the Relationship between Impact Sensitivity and the Charges of the Nitro Group in Nitro Compounds., J. Energ. Mater., 2005, 23, 107–119 CrossRef CAS.
- M. H. Keshavarz, H. R. Pouretedal and A. Semnani, Novel correlation for predicting impact sensitivity of nitroheterocyclic energetic molecules., J. Hazard. Mater., 2007, 141, 803–807 CrossRef CAS.
- K. P. Duffy, P. J. Baker, E. J. Barr and A. M. Mellor, Dynamic analysis of drop weight impact rocket propellant ignition, AIAA, SAE, ASME, and ASEE, Joint Propulsion Conference, 27th, Sacramento, CA. United States. 1991, pp. 24–26 Search PubMed.
- M. H. Friedman, A. correlation of impact : sensitivities by means of the hot-spot model, 9th Symposium International Combustion. Academic Press. New York. 1963, pp. 294–302 Search PubMed.
- E. C. Francis and B. M. Cuthbert, Dynamic analysis of impact sensitivity test., JANNAF Propulsion Systems Hazards Subcommittee Meeting, CPIA Publication, 1987, Vol. I. No.464, 257–264 Search PubMed.
- J. E. Field, N. K. Bourne, S. J. P. Palmer, S. M. Walley, J. Sharma and B. C. Beard, Hot-spot ignition mechanisms for explosives and propellants (and discussion), Phil. Trans., Philos. Trans. R. Soc. London, Ser. A, 1992, 339, 269–283 CrossRef CAS.
- S. N. Heavens and J. E. Field, The ignition of a thin layer of explosive by impact., Proc. R. Soc. London, Ser. A, 1974, 338, 77–93 CrossRef CAS.
- X. J. Gu, D. R. Emerson and D. Bradley, Modes of reaction front propagation from hot spots, Combust., Combust. Flame, 2003, 133, 63–74 CrossRef CAS.
- L. M. Tavares and R. P. King, Single-particle fracture under impact loading., Int. J. Miner. Process., 1998, 54, 1–28 CrossRef CAS.
- L. M. Tavares, Energy absorbed in breakage of single particles in drop weight testing, Miner., Eng, 1990, 12, 43–50 Search PubMed.
- H. S. Carslaw and J. C. Jaeger, Conduction of Heat in Solids.Clarendon Press, Oxford, 1959, pp.88 Search PubMed.
- A. W. Momber, The fragmentation of standard concrete cylinders under compression: the role of secondary fracture debris., Eng. Fract. Mech., 2000, 67, 445–459 CrossRef.
- Y. Q. Wu and F. L. Huang, A. microscopic model for predicting hot-spot ignition of granular energetic crystals in response to drop-weight impacts., Mech. Mater., 2011, 43, 835–852 CrossRef.
- A. K. Burnham, R. Gee, A. Maiti, R. Qiu, P. Rajasekar, B. Weeks and L. Zepeda-Ruiz, Experimental and modeling characterization of PETN mobilization mechanisms during recrystallization at ambient conditions. UCRL-TR-216963, 2005, 11 Search PubMed Nov. 9.
- G. M. Swallowe and J. E. Field, The ignition of a thin layer of explosive by impact, the effect of polymer particles., Proc. R. Soc. London, Ser. A, 1982, 379, 389–408 CrossRef CAS.
- B. Banerjee and D. O. Adams, Micromechanics-based determination of effective elastic properties of polymer bonded explosives., Phys. B, 2003, 338, 8–15 CrossRef CAS.
- P. M. Halleck and J. Wackerle, Dynamic elastic-plastic properties of single-crystal pentaerythritol tetranitrate., J. Appl. Phys., 1976, 47, 976–982 CrossRef CAS.
- R. Menikoff and T. D. Sewell, Consituent properties of HMX needed for mesoscale simulations. Combust., Combust. Theory Modell., 2002, 6, 103–125 CrossRef CAS.
- I. J. Dagley, R. P. Parker and D. A. Jones, Luciana Montelli. Simulation and moderation of the thermal response of confined pressed explosive compositions., Combust. Flame, 1996, 106, 428–411 CrossRef CAS.
- S. J. P. Palmer and J. E. Field, The deformation and fracture of (-HMX., Proc. Roy. Soc. Lond. A. Math & Phys. Sci., 1982, 383, 39–407 Search PubMed.
- J. J. Dick, Supercritical shear in shocked pentaerythritol tetranitrate., Applied Physics Letters., 1992, 60 Search PubMed.
- J. E. Field, G. M. Swallowe, P. H. Pope and S. J. P. Palmer, High strain rate properties of explosives. Inst Phys. Conf. Ser. No.70. 3rd Conf. Mech. Prop.High Rates of Strain. Oxford. 1984, 381–388 Search PubMed.
- N. R. Barton, N. W. Winter and J. E. Reaugh, Defect evolution and pore collapse in crystalline explosive materials., Modelling Simul. Mater. Sci. Eng., 2009, 17(035003), 1–19 Search PubMed.
- W. H. Andersen, Role of the friction coefficient in the frictional heating ignition of explosives., Propellants, Explos., Pyrotech., 1981, 6, 17–23 CrossRef CAS.
- S. J. P. Palmer and J. E. Field, The deformation and fracture of (-HMX., Proc. R. Soc. London, Ser. A, 1982, 383, 399–407 CrossRef CAS.
- K. A. Gonthier and V. Jogi, Multiscale shock heating analysis of a granular explosive., Transactions of the ASME., 2005, 72, 538–552 CrossRef CAS.
- V. Jogi, Predictions for multi-scale shock heating of a granular energetic material., PhD. Thesis. Search PubMed.
- A. V. Khaneft and E. V. Duginov, Mechanism of influence of substrate on the initiation of PETN by a laser pulse., http://www.hcei.tsc.ru/conf/2010/cat/proc_2010/cmm/183-186.pdf Search PubMed.
- W. C. McCrone, Crystallographic data. 36. Cyclotetramethylene Tetranitramine(HMX)., Anal. Chem., 1950, 22, 1225–1226 Search PubMed.
- D. M. Chambers, Perspectives on Pentaerythritol Tetranitrate (PETN) Decomposition. UCRL-JC-148956., 2002 Search PubMed July, 1.
| This journal is © The Royal Society of Chemistry 2012 |
