A cathodic electrogenerated chemiluminescence biosensor based on luminol and hemin-graphene nanosheets for cholesterol detection†
Meihe
Zhang
,
Ruo
Yuan
*,
Yaqin
Chai
,
Shihong
Chen
,
Xia
Zhong
,
Huaan
Zhong
and
Cun
Wang
Education Ministry Key Laboratory on Luminescence and Real-Time Analysis, College of Chemistry and Chemical Engineering, Southwest University, Chongqing 400715, PR China. E-mail: yuanruo@swu.edu.cn; Fax: +86 23 68254000; Tel: +86 23 68252277
First published on 20th April 2012
Abstract
A cathodic electrogenerated chemiluminescence (ECL) sensing platform utilizing hemin-graphene nanosheets as an ECL amplification and sensing element was developed for the detection of cholesterol with good specificity and excellent stability.
The estimation of cholesterol has attracted much interest since its level in the blood is an important parameter in the diagnosis and prevention of diseases. High cholesterol accumulation in blood results in a variety of diseases, such as hypertension, coronary heart disease, arteriosclerosis, coronary diseases, and lipid metabolism dysfunction.1,2 Various methods3,4 have been reported for the analysis of cholesterol in serum, including colorimetric, spectrometric, nonenzymatic, spectrophotometric, and electrochemical methods. The traditional methods of cholesterol determination suffer from poor specificity, instability, and standardization difficulties. However, the chemiluminescence (CL) or electrogenerated chemiluminescence (ECL) method is extremely attractive because of its simplified set-up, low background signal and high sensitivity.5 Recently, Willner's group used the peroxidase-mimicking DNAzyme as an amplifying label for an aptamer and combined it with the luminol-H2O2 CL system to detect low-molecular-weight substrates and proteins.6 Yuan's group developed a new ECL immunosensor for alpha-fetoprotein utilizing L-cysteine and gold nanoparticles to form a sensitized ECL sensing platform in a peroxydisulfate ECL system.7
Hemin (iron protoporphyrin IX, a well-known natural porphyrinatoiron) is the active center of the heme-protein family. Due to its small size, direct electron transfer, hemin can be established independently of the orientation on the electrode surface while higher surface coverages should lead to improved sensitivity when hemin is used in a sensor.8 In particular, hemin can be well used as electron media based on the reversible redox of Fe(III)/Fe(II), and exhibits excellent electrocatalytic properties towards the detection of many important analytes such as oxygen, nitrite, nitric oxide, trichloroacetic acid, and L-cystein.9 Ikarlyama10 developed a method termed CL catalytic immunoassay in which hemin is used as the labeling agent to label human serum albumin, which would catalyze the CL reaction between luminol and H2O2. What is more, it was also found that hemin could catalyze the ECL of lucigenin in a neutral solution in the presence of H2O2.11
Graphene is a novel one-atom-thick two-dimensional graphitic carbon system, which has recently emerged as a fascinating material owing to its large surface area (calculated value, 2630 m2 g−1), high thermal, and high conductivity (103–104 S m−1), and great mechanical strength.12,13 These unique characteristics hold great promise for potential applications in many technological fields such as nanoelectronics, nanocomposites, catalysis, and supercapacitors.14 Recently, graphene-based composites have triggered much attention due to the potential applications in transparent conductors, electrostatic dissipation, and Li-ion batteries.15,16 Graphene nanosheets (GNs) functionalized covalently with biocompatible poly-L-lysine were synthesized, and proved to be novel materials with promising biological applications.17 Shan reported polyvinylpyrrolidone-protected graphene had good electrochemical reduction toward O2 and H2O2.18 However, compared to the composites mentioned above, the hemin-graphene hybrid nanosheets provide excellent opportunities for applications in the fields of artificial enzyme mimetics, biosensors, electrocatalysis, and luminescence.19
Based on the above, hemin-graphene nanosheets (H-GNs) were synthesized with a simple wet-chemical strategy through the π–π interactions and used to detect cholesterol. To the best of our knowledge, there is no report on a cathodic ECL behavior of luminol based on H-GNs for the determination of cholesterol.
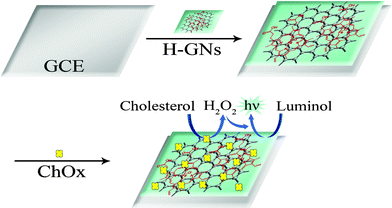
Scheme 1 shows the preparation process of the modified electrode and explains the principle of the biosensor toward the detection of cholesterol. First, H-GNs were dropped onto a bare glassy carbon electrode (GCE). Then it was allowed to dry at room temperature. Following this pretreatment, in virtue of the high porosity, huge surface areas, and strong adsorptive ability of H-GNs, cholesterol oxidase (ChOx) was modified onto the surface of the electrode to construct a cholesterol biosensor. As for the principle of the biosensor: cholesterol is oxidized by ChOx to form cholest-4-en-3-one and H2O2. Then, luminol reacted with H2O2 to produce the signal of ECL, and hemin could catalyze the cathodic ECL of luminol. The intensity of the ECL signal is directly proportional to the concentration of cholesterol. So cholesterol can be detected quantitatively on the modified electrode.
 | ||
| Scheme 1 Illustration of the preparation process and the principle of the biosensor. | ||
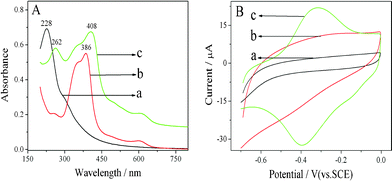
The evidence supporting the synthesis of H-GNs is supplied by UV-Vis. As shown in Fig. 1A, the spectrum of hemin solution contains a strong peak at 386 nm attributed to the Soret band, as well as a group of weak peaks between 550 and 700 nm ascribed to the Q-bands. The graphene oxide (GO) dispersion displays a maximum absorption at 228 nm which is due to the π–π* transition of aromatic C![[double bond, length as m-dash]](https://www.rsc.org/images/entities/char_e001.gif) C bonds and a shoulder at ca. 280–320 nm which corresponds to the n–π* transition of the C
C bonds and a shoulder at ca. 280–320 nm which corresponds to the n–π* transition of the C![[double bond, length as m-dash]](https://www.rsc.org/images/entities/char_e001.gif) O bond. The H-GNs exhibit an absorption at 262 nm which should be the corresponding reduced graphene oxide. An absorption at 408 nm is also observed, which corresponds to the Soret band of hemin with a large bathochromic shift (22 nm). These findings indicate the existence of the π–π interactions between GO and hemin, and are in good agreement with the previous report, that interactions of a cationic porphyrin derivative with chemically converted graphene result in a red shift of the porphyrin Soret band.20 This clearly confirms that hemin molecules are attached to GNs.
O bond. The H-GNs exhibit an absorption at 262 nm which should be the corresponding reduced graphene oxide. An absorption at 408 nm is also observed, which corresponds to the Soret band of hemin with a large bathochromic shift (22 nm). These findings indicate the existence of the π–π interactions between GO and hemin, and are in good agreement with the previous report, that interactions of a cationic porphyrin derivative with chemically converted graphene result in a red shift of the porphyrin Soret band.20 This clearly confirms that hemin molecules are attached to GNs.
 | ||
| Fig. 1 (A) UV-Vis spectra of (a) GO suspension, (b) hemin solution, and (c) H-GNs suspension. (B) CVs of (a) bare GCE, (b) GNs/GCE, and (c) H-GNs/GCE in 0.05 M PBS (pH 7.4), scan rate: 100 mV s−1. | ||
The attachment of hemin to the graphene surface was also characterized by an electrochemical method. As shown in Fig. 1B, cyclic voltammograms (CVs) of (a) the bare GCE, (b) the GNs modified GCE (GNs/GCE), and (c) H-GNs/GCE were recorded in a phosphate buffer solution (PBS). As expected, in the absence of hemin, no redox peaks were observed for either electrode in the potential range investigated. By contrast, a pair of well-defined redox peaks were clearly seen when the H-GNs were presented on the electrode surface. The redox peaks should be ascribed to hemin, which is the characteristic of a single electron transfer process of iron at the core of hemin for the heminox/heminred pair.21
On the basis of the above results, we can conclude that the H-GNs have been prepared successfully as expected.
CV is also used to investigate the interfacial changes of the electrode. Fig. 2 shows the CVs of differently modified electrodes in 5 mM [Fe(CN)6]4−/3− solution (0.1 M KCl). As can be seen, a well-defined oxidation and reduction peaks of [Fe(CN)6]4−/3− (curve a) were observed at the bare GCE. After the H-GNs were modified on the surface of GCE, the peak current of the modified electrode increased (curve b) for the reason that H-GNs could facilitate electron transfer between biomolecules and electrode surface, indicating that the H-GNs had been successfully immobilized. However, when the ChOx was adsorbed on the electrode (curve c), the peak current clearly decreased for the hindrance of non-conductive ChOx.
![CVs of different electrodes (a) GCE, (b) H-GNs/GCE, and (c) ChOx/H-GNs/GCE in 5.0 mM [Fe(CN)6]4−/3− solution (0.1 M KCl). Scan rate: 100 mV s−1.](/image/article/2012/RA/c2ra20374j/c2ra20374j-f2.gif) | ||
| Fig. 2 CVs of different electrodes (a) GCE, (b) H-GNs/GCE, and (c) ChOx/H-GNs/GCE in 5.0 mM [Fe(CN)6]4−/3− solution (0.1 M KCl). Scan rate: 100 mV s−1. | ||
To obtain an optimal ECL biosensor for cholesterol detection, the effect of concentration of luminol on the intensity of the ECL signal was investigated. The ECL intensity increased with the increasing luminol concentration. A further increase in the concentration of luminol (from 0.15 mM to 0.20 mM) did not cause any obvious enhancement on the intensity of the ECL of the biosensor (see Fig. S1, ESI†). Therefore, 0.15 mM was selected as the optimal concentration of luminol for further experiments.
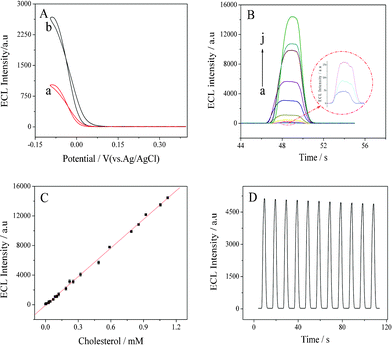
The catalytic activity of the hemin toward the ECL intensity of luminol-H2O2 system was investigated. As shown in Fig. 3A, the biosensor using hemin showed a much greater response to cholesterol. The enhanced ECL signals were ascribed to the possible catalysis from hemin, which is consistent with the conclusion of the literature.22 The reasons were as follows: hemin has excellent catalytic performance to directly enhance the ECL intensity of the luminol-H2O2 system as hemin facilitates electron transfer to the electrode surface; therefore the biosensor showed a much better response to cholesterol.
 | ||
| Fig. 3 (A) Cathodic ECL profiles of (a) ChOx/GNs/GCE and (b) ChOx/H-GNs/GCE. (B) Cathodic ECL responses of luminol (0.15 mM) at ChOx/H-GNs/GCE in the presence of (a) 0, (b) 0.00017, (c) 0.0078, (d) 0.038, (e) 0.10, (f) 0.25, (g) 0.49, (h) 0.79, (i) 0.92, and (j) 1.12 mM cholesterol. (C) The relationship of the response ECL intensity versus the cholesterol concentration. Error bars = ± standard deviation. (D) Reproducibility of ECL responses of luminol at ChOx/H-GNs/GCE. Conditions: 0.05 M PBS (pH 7.4) containing 0.15 mM luminol, scan rate: 100 mV s−1. | ||
The performance of the prepared biosensor was evaluated by detecting standard cholesterol solutions with the ECL technique under optimal experimental conditions. Fig. 3B shows the ECL behaviors of the ChOx/H-GNs/GCE at determining cholesterol. The biosensor responded quickly to the change of cholesterol concentration. As shown in Fig. 3C, the ECL signal shows a linear range covering from 0.17 μM to 1.12 mM with a low detection limit of 0.06 μM (S/N = 3). The regression equation was I (a.u.) = 1.29 × 10⁴C (mM)–71.8 with a correlation coefficient of 0.9984. These results are comparable with those previously reported in the literature (see Table S1, ESI†). The relative standard deviation (RSD) for repetitive measurements (n = 11) of the biosensor response to 0.38 mM cholesterol (Fig. 3D) was 5.6%.
The interfering species such as ascorbic acid, uric acid, dopamine, and glycine had almost no observable interference to the response to cholesterol (see Fig. S2, ESI†), which indicated the prepared biosensor showed a high selectivity and good anti-interference ability.
The stability of the biosensor was also determined. The developed biosensor was tested in the present of cholesterol solution, and the ECL intensity decreased 12.6% compared to the initial ECL intensity after two weeks, which showed the biosensor had long-term stability.
The analytical applicability of the biosensor was evaluated by standard addition method. The results (see Table S2, ESI†) listed the recovery of different cholesterol concentrations. The recovery rate was between 98.6% and 112.0%. The satisfying results demonstrated that the biosensor had a great potential for practical application.
In conclusion, we report a cathodic ECL of luminol on the H-GNs modified GCE. The resulted H-GNs modified electrode offers an excellent platform for high-performance biosensing applications. On the basis of the cathodic ECL signal of luminol on the H-GNs modified electrode, an ECL biosensor was developed for the detection of cholesterol. The amplification of the luminol ECL signals was achieved by the following reasons: (1) The H-GNs had superior electrical conductivity as they are able to promote electron transfer and increase the ECL response of luminol–H2O2. (2) The H-GNs possessed much larger surface areas and much more active sites to immobilize large amounts of ChOx. (3) The attached ChOx kept good biological activity and exhibited efficient catalysis towards cholesterol to generate H2O2 as coreactant for luminol. The experimental results demonstrated that the proposed biosensor had excellent performance for the detection of cholesterol with satisfying stability, selectivity, and simplicity. Moreover, the H-GNs can be a good potential candidate as a catalyst support for electrochemical oxidation.
This work was supported by National Natural Science Foundation of China (21075100), the Ministry of Education of China (Project 708073), the Nature Science Foundation of Chongqing City (CSTC-2011BA7003 and CSTC-2009BA1003) and Specialized Research Fund for the Doctoral Program of Higher Education (20100182110015), and Fundamental Research Funds for the Central Universities (XDJK2012A004).
References
- S. K. Arya, M. Datta and B. D. Malhotra, Biosens. Bioelectron., 2008, 23, 1083–1100 CrossRef CAS.
- J. P. Li, T. Z. Peng and Y. Q. Peng, Electroanalysis, 15, 1031–1037 CrossRef CAS.
- A. I. Gopalan, K. P. Lee and D. Ragupathy, Biosens. Bioelectron., 2009, 24, 2211–2217 CrossRef CAS.
- E. M. I. M. Ekanayake, D. M. G. Preethichandra and K. Kaneto, Biosens. Bioelectron., 23, 107–113 CrossRef CAS.
- H. Jiang and H. X. Ju, Chem. Commun., 2007, 4, 404–406 RSC.
- D. Li, B. Shlyahovsky, J. Elbaz and I. Willner, J. Am. Chem. Soc., 2007, 129, 5804–5805 CrossRef CAS.
- H. Niu, R. Yuan, Y. Q. Chai, L. Mao, Y. L. Yuan, Y. Zhuo, S. R. Yuan and X. Yang, Biosens. Bioelectron., 2011, 26, 3175–3182 CrossRef CAS.
- Y. Liu, Y. L. Yan, J. P. Lei, F. Wu and H. X. Ju, Electrochem. Commun., 2007, 9, 2564–2570 CrossRef CAS.
- L. H. Chen, F. Huang, L. Z. Liu and H. X. Shen, Chin. J. Anal. Chem., 2003, 31, 1237–1239 CAS.
- Y. Ikarlyama, S. Suzuki and M. Aizawa, Anal. Chem., 1982, 54, 1126–1129 CrossRef.
- G. N. Chen, L. Zhang, R. E. Lin, Z. C. Yang, J. P. Duan, H. Q. Chen and D. B. Hibbert, Talanta, 2000, 50, 1275–1281 CrossRef CAS.
- C. N. R. Rao, A. K. Sood, K. S. Subrahmanyam and A. Govindaraj, Angew. Chem., Int. Ed., 2009, 48, 7752–7777 CrossRef CAS.
- S. J. Guo, D. Wen, S. J. Dong and E. K. Wang, ACS Nano, 2010, 4, 3959–3968 CrossRef CAS.
- S. Park and R. S. Ruoff, Nat. Nanotechnol., 2009, 4, 217–224 CrossRef CAS.
- A. Ghosh, K. V. Rao, S. J. George and C. N. R. Rao, Chem.–Eur. J., 2010, 16, 2700–2704 CrossRef CAS.
- W. Tu, J. Lei, S. Zhang and H. Ju, Chem.–Eur. J., 2010, 16, 10771–10777 CrossRef CAS.
- C. S. Chen, H. F. Yang, D. X. Han, Q. X. Zhang, A. Ivaska and L. Niu, Langmuir, 2009, 25, 12030–12033 CrossRef.
- C. S. Shan, H. F. Yang, J. F. Song, D. X. han, A. Ivaska and L. Niu, Anal. Chem., 2009, 81, 2378–2382 CrossRef CAS.
- Y. J. Guo, L. Deng, J. Li, S. J. Guo, E. K. Wang and S. J. Dong, ACS Nano, 2011, 5, 1282–1290 CrossRef CAS.
- Y. X. Xu, L. Zhao, H. Bai, W. J. Hong, C. Li and G. Q. Shi, J. Am. Chem. Soc., 2009, 131, 13490–13497 CrossRef CAS.
- P. Bianco, J. Haladjian and K. Draoui, J. Electroanal. Chem., 1990, 279, 305–314 CrossRef CAS.
- W. W. Liu, W. Cao, W. H. Liu, K. Du and P. X. Gong, Spectrochim. Acta A, 2012, 85, 283–287 CrossRef CAS.
Footnote |
| † Electronic Supplementary Information (ESI) available. See DOI: 10.1039/c2ra20374j/ |
| This journal is © The Royal Society of Chemistry 2012 |
