Nitrogen-enriched multimodal porous carbons for supercapacitors, fabricated from inclusion complexes hosted by urea hydrates†
Young Soo
Yun
a,
Jinyong
Shim
b,
Yongsug
Tak
b and
Hyoung-Joon
Jin
*a
aDepartment of Polymer Science and Engineering, Inha University, Incheon 402-751, Korea. E-mail: hjjin@inha.ac.kr; Fax: +82-32-865-5178; Tel: +82-32-860-7483
bDepartment of Chemical Engineering, Inha University, Incheon 402-751, Korea.
First published on 16th March 2012
Abstract
In this study, we fabricated nitrogen-enriched multimodal porous carbons (NMPCs) from a self-assembled inclusion complex induced by the interaction between urea hydrates as host molecules and cellulose molecules as guest molecules for supercapacitors. The novel carbon material could be obtained on a gram-scale due to the simple synthetic process and widely available precursor, cellulose, from markets and had a three-dimensionally interconnected structure, as well as multimodal porous characteristics and a large amount of nitrogen (10.5 wt%). The NMPCs exhibited a high capacitance due to the pseudocapacitive behaviors of the nitrogen groups, and their multimodal structure facilitated the ideal capacitive behavior as a result of the fast ionic motion. Moreover, the NMPCs exhibited good cycle stability and a high degree of reversibility in repetitive charge/discharge cycling.
Introduction
Nanostructured carbon materials with superb electro-chemical performance are important in energy storage devices.1 Much attention has recently been focused on preparing porous carbon materials with uniform structures, especially those possessing interconnected macropores and well-defined micropores and/or mesopores, because these multimodal porous structures can provide highly efficient mass transport through the macropores and high surface areas from micro/mesopores, as well as selective accessibility of various sizes of species.2–4 Template-assisted synthesis methods have been used to achieve such porous carbonaceous materials.5 However, template-assisted synthesis requires either a tedious procedure during the preparation and removal of the templates, or a complicated synthetic approach. In addition, the application of porous carbons with uniform structure fabricated from template-assisted synthesis is limited by the small amounts yielded from such methods. Functional groups on the carbon surface containing hetero-atoms, such as nitrogen or oxygen, have been reported to give superior performance due to pseudocapacitive effects.6–8 The surface-functionalized carbons exhibited extraordinary supercapacitance and cycle stability. Therefore, using the surface-functionalized carbons can be an alternative strategy to increase the energy density of a supercapacitor with high power density. However, few studies have investigated carbon materials with uniform multimodal structure and numerous hetero-atoms. Cellulose is a sustainable, eco-friendly and cheap natural polymer that can be widely used to yield various useful products,9 but it is difficult to process in solution due to the numerous intra- and inter-molecular hydrogen bonds that interrupt the dissolution of the solid cellulose in solution. In a more interesting approach than traditional dissolution by heating, Cai et al. recently reported a novel NaOH/urea/water solvent system to regenerate cellulose at low temperatures (−5 to −12 °C).10,11 It has been demonstrated that a new hydrogen-bonding network structure between the solvent and cellulose macromolecules can form to destroy the inter- and intra-molecular hydrogen-bonding of cellulose at low temperatures, leading to good dissolution. This phenomenon is related to the inclusion complex (IC) hosted by urea hydrates. Interestingly, a complex composed of NaOH, water clusters and a cellulose chain is encaged in the channel IC hosted by urea hydrates.12,13 The nano-sized channel IC is able to form a three-dimensional (3-D) nanostructure through interactions between the host molecules and guest molecules. This phenomenon suggests the possibility of fabricating a new 3-D nanostructured material. In addition, the urea emits NH3 and CO2 gases and produces thermo-stable materials, such as ammeline and melamine, during thermal degradation.14 Therefore, the NH3 and CO2 gases that are emitted during the carbonization of channel ICs can induce a doping effect and activation of the products, respectively. In addition, the presence of the ammeline and melamine derivatives suggests that nitrogen-enriched carbons may have been fabricated by the carbonization of channel ICs. In this study, we fabricated nitrogen-enriched multimodal porous carbons (NMPCs) fabricated from channel ICs of cellulose hosted by urea hydrates and investigated their electro-chemical performance.Experimental
2.1 Fabrication of the NMPCs
Mixtures of various NaOH/urea/water solutions pre-cooled to −12 °C for 2 h were prepared, and different weight percentages of cotton cellulose (purchased from Aldrich) were immersed in the mixture solutions and then intensely stirred for approximately 5 min at ambient temperature (IC solution). The IC solutions were directly frozen at −196 °C and then freeze-dried for 3 days. These IC cryogels were carbonized from room temperature to 800 °C for 3 h. A heating rate of 5 °C min−1 and an Ar flow of 200 mL min−1 were applied. After the cryogel was carbonized, it was washed using distilled water and ethanol then dried in a vacuum oven at 30 °C.2.2 Electrochemical measurement
The working electrodes were prepared as follows. The electroactive materials and polytetrafluoroethylene as a binder were mixed in a mass ratio of 90![[thin space (1/6-em)]](https://www.rsc.org/images/entities/char_2009.gif) :
:![[thin space (1/6-em)]](https://www.rsc.org/images/entities/char_2009.gif) 10, dissolved in ethanol, coated onto a nickel mesh substrate (0.785 cm2) with a spatula, and dried at 110 °C for several hours in an oven. The amount of electroactive materials was kept constant for each electrode. Each electrode contained about 2.5 mg of the electroactive materials. All electrochemical measurements were performed in a three-electrode system. The nickel mesh containing the electroactive materials, platinum plate and saturated KCl were used as the working, counter and reference electrodes, respectively. The measurements were carried out in a 1 M H2SO4 acidic solution at room temperature. Then the cyclic voltammetry, electrochemical impedance spectroscopy (EIS), and galvanostatic charge/discharge results were measured by a potentiostat/galvanostat (PGSTAT302N, Autolab). Cyclic voltammetry (CV) tests were performed between 0 and 0.8 V (vs. SCE) at different scan rates. Galvanostatic charge/discharge tests were measured in the potential of 0 to 0.8 V (vs. SCE) at a current density of 10 mA cm−2. EIS was measured in the frequency range from 100 kHz to 0.1 Hz.
10, dissolved in ethanol, coated onto a nickel mesh substrate (0.785 cm2) with a spatula, and dried at 110 °C for several hours in an oven. The amount of electroactive materials was kept constant for each electrode. Each electrode contained about 2.5 mg of the electroactive materials. All electrochemical measurements were performed in a three-electrode system. The nickel mesh containing the electroactive materials, platinum plate and saturated KCl were used as the working, counter and reference electrodes, respectively. The measurements were carried out in a 1 M H2SO4 acidic solution at room temperature. Then the cyclic voltammetry, electrochemical impedance spectroscopy (EIS), and galvanostatic charge/discharge results were measured by a potentiostat/galvanostat (PGSTAT302N, Autolab). Cyclic voltammetry (CV) tests were performed between 0 and 0.8 V (vs. SCE) at different scan rates. Galvanostatic charge/discharge tests were measured in the potential of 0 to 0.8 V (vs. SCE) at a current density of 10 mA cm−2. EIS was measured in the frequency range from 100 kHz to 0.1 Hz.
2.3 Characterization
The morphologies of the NMPCs were observed by transmission electron microscopy (TEM, JEM2100F, JEOL, Japan) equipped with energy-dispersive X-ray spectroscopy (EDX). Elemental analysis was performed using an EA1112 (CE instrument, Italy). The porous properties of the NMPCs were analyzed using nitrogen adsorption and desorption isotherms that were obtained using the surface area and a porosimetry analyzer (ASAP 2020, Micromeritics, USA) at −196 °C. The surface areas (SBET) were calculated according to the Brunauer–Emmett–Teller (BET) theory. The micropore surface area (SMIC) was obtained using t-plot theory whereas the external surface area (SEXT) was calculated according to the Barrett–Johner–Halendar (BJH) theory. X-ray photoelectron spectroscopy (XPS, PHI 5700 ESCA) was performed using monochromated Al Kα radiation (hv = 1486.6 eV).Results and discussion
The novel NMPCs were easily prepared using an eco-friendly process with NaOH/urea/water solvents without any special technique such as template-assisted synthesis. Fig. 1(a) shows the simple three-step process of NMPC fabrication: preparation of the channel IC solution, freeze-drying and carbonization. The NMPCs could be obtained on a gram-scale due to the simple process and widely available precursors. Ten grams of cellulose precursors were converted to about 1.5 g of the NMPCs by laboratory-scale production. In Fig. 1(b), the TEM image exhibits the 3-D macroporous morphology of the NMPCs. The pores of NMPCs are totally opened and interconnected, which are advantageous in the mass transfer of reactants. In addition, micro/mesopores were well-developed in the wall of NMPCs. The micro/mesopores were induced by NaOH, which acted as a chemical activation agent,15,16 and CO2 gas emitted by a thermal degradation of the urea, which acted as a physical activation agent.17,18 The NMPC morphologies were strongly affected by their compositions in the first process to prepare the channel IC solution.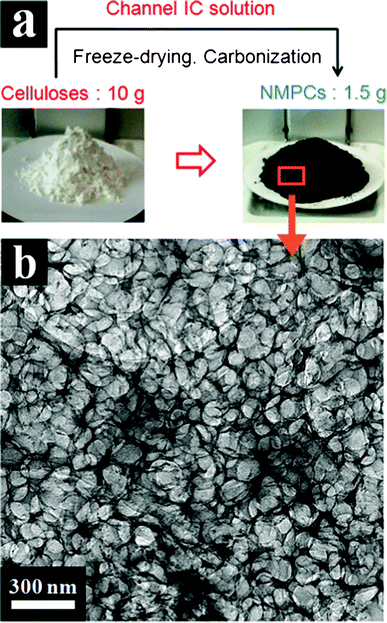 | ||
| Fig. 1 (a) Schematic processing image of gram-scale NMPCs fabricated from cellulose and (b) TEM image of NMPCs-6 wt%. | ||
Table 1 shows the nomenclatures of the samples with various compositions. The sample with a composition of 7 wt% NaOH/12 wt% urea/81 wt% water exhibited an optimal macroporous and uniform NMPC structure (Fig. 2(a)). The relatively high NaOH concentration of NMPC–NaOH-14 wt% induced the non-uniform porous structure due to its excessive activation ability (Fig. 2(b)) while the relatively high urea concentration of NMPC–urea-18 wt% produced a non-macroporous structure (Fig. 2(c)).
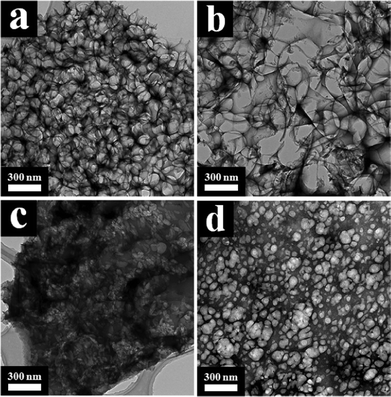 | ||
| Fig. 2 TEM images of (a) NMPC-4 wt%, (b) NMPC–NaOH-14 wt%, (c) NMPC–urea-18 wt% and (d) the pre-carbonization mixture composed of 4 wt% cellulose dissolved in 7 wt% NaOH/12 wt% urea/81 wt% water solvent. | ||
The macroporous structure of the NMPCs was induced by the disordered entanglement of the long channel IC chains. During the drying process, the long channel IC chains were entangled and then shrunk, leading to the formation of an interconnected structure and a macropore. However, the excessive urea content hampered formation of a macroporous structure. Fig. 2(d) shows the presence of a macropore in the pre-carbonization mixture and Fig. 3 depicts a schematic model of the channel IC.
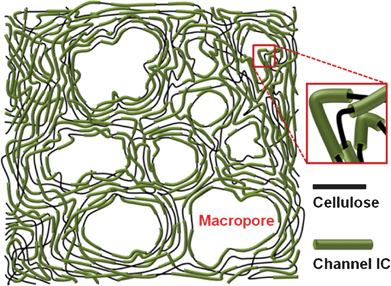 | ||
| Fig. 3 Schematic image of the freeze-dried channel ICs. | ||
TEM images of carbons fabricated from pristine cellulose, from cellulose![[thin space (1/6-em)]](https://www.rsc.org/images/entities/char_2009.gif) :
:![[thin space (1/6-em)]](https://www.rsc.org/images/entities/char_2009.gif) NaOH 1
NaOH 1![[thin space (1/6-em)]](https://www.rsc.org/images/entities/char_2009.gif) :
:![[thin space (1/6-em)]](https://www.rsc.org/images/entities/char_2009.gif) 2 weight ratio and from cellulose
2 weight ratio and from cellulose![[thin space (1/6-em)]](https://www.rsc.org/images/entities/char_2009.gif) :
:![[thin space (1/6-em)]](https://www.rsc.org/images/entities/char_2009.gif) urea 1
urea 1![[thin space (1/6-em)]](https://www.rsc.org/images/entities/char_2009.gif) :
:![[thin space (1/6-em)]](https://www.rsc.org/images/entities/char_2009.gif) 3 weight ratio, which were carbonized under the same conditions, were exhibited in Fig. 4. The carbon from cellulose
3 weight ratio, which were carbonized under the same conditions, were exhibited in Fig. 4. The carbon from cellulose![[thin space (1/6-em)]](https://www.rsc.org/images/entities/char_2009.gif) :
:![[thin space (1/6-em)]](https://www.rsc.org/images/entities/char_2009.gif) NaOH 1
NaOH 1![[thin space (1/6-em)]](https://www.rsc.org/images/entities/char_2009.gif) :
:![[thin space (1/6-em)]](https://www.rsc.org/images/entities/char_2009.gif) 2 weight ratio had a rougher surface than that of pristine cellulose because of the presence of micro/mesopores.
2 weight ratio had a rougher surface than that of pristine cellulose because of the presence of micro/mesopores.
 | ||
Fig. 4 TEM images of the carbons fabricated (a) from pristine cellulose, (b) from cellulose![[thin space (1/6-em)]](https://www.rsc.org/images/entities/char_2009.gif) : :![[thin space (1/6-em)]](https://www.rsc.org/images/entities/char_2009.gif) NaOH 1 NaOH 1![[thin space (1/6-em)]](https://www.rsc.org/images/entities/char_2009.gif) : :![[thin space (1/6-em)]](https://www.rsc.org/images/entities/char_2009.gif) 2 weight ratio and (c) from cellulose 2 weight ratio and (c) from cellulose![[thin space (1/6-em)]](https://www.rsc.org/images/entities/char_2009.gif) : :![[thin space (1/6-em)]](https://www.rsc.org/images/entities/char_2009.gif) urea 1 urea 1![[thin space (1/6-em)]](https://www.rsc.org/images/entities/char_2009.gif) : :![[thin space (1/6-em)]](https://www.rsc.org/images/entities/char_2009.gif) 3 weight ratio, which were carbonized under the same conditions. 3 weight ratio, which were carbonized under the same conditions. | ||
The carbon fabricated from cellulose![[thin space (1/6-em)]](https://www.rsc.org/images/entities/char_2009.gif) :
:![[thin space (1/6-em)]](https://www.rsc.org/images/entities/char_2009.gif) urea 1
urea 1![[thin space (1/6-em)]](https://www.rsc.org/images/entities/char_2009.gif) :
:![[thin space (1/6-em)]](https://www.rsc.org/images/entities/char_2009.gif) 3 weight ratio formed a slightly sketchy structures. However, contrary to the NMPCs fabricated from channel ICs, they didn't have an interconnected and uniform structure.
3 weight ratio formed a slightly sketchy structures. However, contrary to the NMPCs fabricated from channel ICs, they didn't have an interconnected and uniform structure.
Fig. 5 shows pore characteristics of the NMPCs. All of the nitrogen adsorption and desorption isotherms depict IUPAC type-I and IV hybrid shapes, respectively, which suggests the dual microporous and mesoporous structures of the NMPCs (Fig. 5(a), (c), (e) and (g)). In addition, the pore size distribution of the NMPCs calculated using the BJH theory exhibited multimodal pore characteristics (Fig. 5(b), (d), (f) and (h)). The multimodal pore characteristics were similar in all samples with only slight differences in degree. In the case of the NMPC–NaOH-14 wt%, the peak of the mesopore area is higher than that of the others due to an effect induced by crystals, which were formed by a relatively larger amount of extra NaOH. In the case of the NMPC–urea-18 wt%, the peak of the macropore area is relatively lower. The result coincides with the TEM image. The surface area of NMPC-6 wt% was very high (1149.8 m2 g−1) and, micropores (904.0 m2 g−1), mesopores and macropores (245.8 m2 g−1) were well-developed. Contrary to our expectation, the surface area of NMPC–NaOH-14 wt%, with its relatively high activation agent content, was lower than that of NMPC-4 wt%. This result suggested the absence of any linear relation between the activation agent content and the surface area. The surface area of the NMPC samples was the highest at the NaOH![[thin space (1/6-em)]](https://www.rsc.org/images/entities/char_2009.gif) :
:![[thin space (1/6-em)]](https://www.rsc.org/images/entities/char_2009.gif) cellulose weight ratio of around 1
cellulose weight ratio of around 1![[thin space (1/6-em)]](https://www.rsc.org/images/entities/char_2009.gif) :
:![[thin space (1/6-em)]](https://www.rsc.org/images/entities/char_2009.gif) 1.
1.
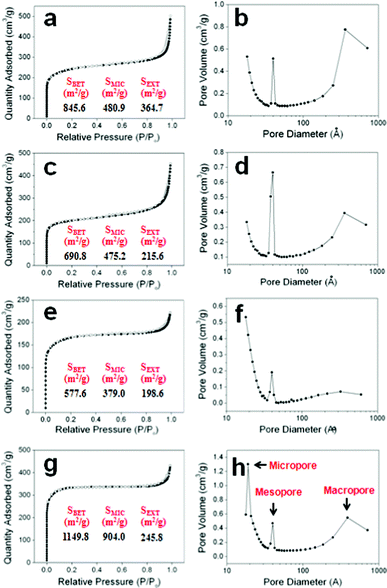 | ||
| Fig. 5 Nitrogen adsorption and desorption isotherms and pore size distributions: (a) and (b) NMPC-4 wt%, (c) and (d) NMPC–NaOH-14 wt%, (e) and (f) NMPC–urea-18 wt%, and (g) and (h) NMPC-6 wt%. | ||
Surface functional groups were analyzed by XPS (Fig. 6). Several distinct peaks (C–O and C–N centered at 286.2 eV, C![[double bond, length as m-dash]](https://www.rsc.org/images/entities/char_e001.gif) O and N–C
O and N–C![[double bond, length as m-dash]](https://www.rsc.org/images/entities/char_e001.gif) O centered at 287.8 eV and C(O)O centered at 289.4 eV) were exhibited in the C 1s spectra, including the main C–C peak at 284.5 eV (Fig. 6(a)).6,19 These functional groups were induced by the cellulose precursor and the thermal degradation of urea, which commences with emissions of NH3 and CO2 gases at around 150 °C, followed by the production of thermo-stable cyanuric acid, ammelide and ammeline from biuret as the temperature exceeded 190 °C.14 In the channel IC hosted by urea, the host molecules were attacked by the alkoxide group of the cellulose before thermal degradation, leading to the formation of carbamate groups, which were then transformed into thermo-stable formations containing a cyanuric ring during the carbonization process. In addition, the NH3 gas emitted during the thermal decomposition prompted nitrogen doping. The chemical atmosphere of the nitrogen atoms in NMPC-6 wt% was mostly in the form of amide groups and pyridinic nitrogen species, as indicated by the N 1s peaks centered at 400.1 and 398.1 eV, respectively (Fig. 6(b)).6,19 An additional peak in the N 1s spectrum suggests that some nitrogen atoms are tied in oxidized nitrogen-containing functional groups (403.0 eV).6,19 The two distinct peaks (531.4 and 533.5 eV) in the O 1s spectrum revealed the presence of oxygen atoms in the carbonyl groups and various other oxygen groups (Fig. 6(c)).20 The surface functional groups generate high performance carbons with extraordinary supercapacitance through Faradaic reactions,6–8 and their presence is advantageous for improving electrode wettability because of the increased number of hydrophilic polar sites. In particular, the pyridinic nitrogen species interact with the ions of the electrolytes to provide a lone electron pair for conjugation with the π-conjugated rings.7,21,22 The resulting NMPC is therefore electrochemically active and exhibits pseudocapacitive behavior which is not a rate-limiting factor.23
O centered at 287.8 eV and C(O)O centered at 289.4 eV) were exhibited in the C 1s spectra, including the main C–C peak at 284.5 eV (Fig. 6(a)).6,19 These functional groups were induced by the cellulose precursor and the thermal degradation of urea, which commences with emissions of NH3 and CO2 gases at around 150 °C, followed by the production of thermo-stable cyanuric acid, ammelide and ammeline from biuret as the temperature exceeded 190 °C.14 In the channel IC hosted by urea, the host molecules were attacked by the alkoxide group of the cellulose before thermal degradation, leading to the formation of carbamate groups, which were then transformed into thermo-stable formations containing a cyanuric ring during the carbonization process. In addition, the NH3 gas emitted during the thermal decomposition prompted nitrogen doping. The chemical atmosphere of the nitrogen atoms in NMPC-6 wt% was mostly in the form of amide groups and pyridinic nitrogen species, as indicated by the N 1s peaks centered at 400.1 and 398.1 eV, respectively (Fig. 6(b)).6,19 An additional peak in the N 1s spectrum suggests that some nitrogen atoms are tied in oxidized nitrogen-containing functional groups (403.0 eV).6,19 The two distinct peaks (531.4 and 533.5 eV) in the O 1s spectrum revealed the presence of oxygen atoms in the carbonyl groups and various other oxygen groups (Fig. 6(c)).20 The surface functional groups generate high performance carbons with extraordinary supercapacitance through Faradaic reactions,6–8 and their presence is advantageous for improving electrode wettability because of the increased number of hydrophilic polar sites. In particular, the pyridinic nitrogen species interact with the ions of the electrolytes to provide a lone electron pair for conjugation with the π-conjugated rings.7,21,22 The resulting NMPC is therefore electrochemically active and exhibits pseudocapacitive behavior which is not a rate-limiting factor.23
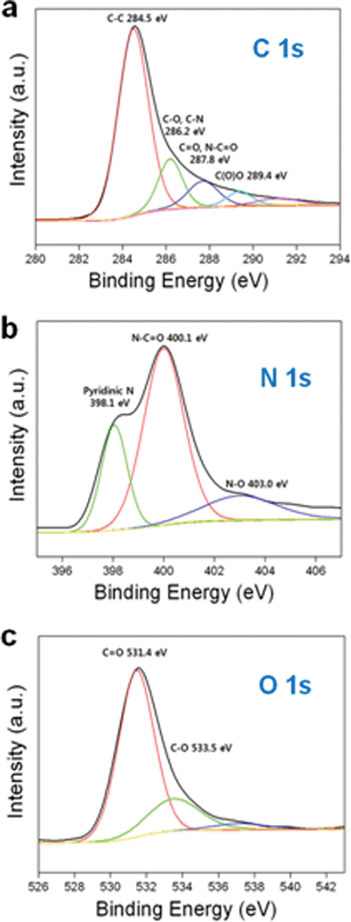 | ||
| Fig. 6 (a) XPS C 1s spectra of NMPC-6 wt%, (b) XPS N 1s spectra of NMPC-6 wt% and (c) XPS O 1s spectra of NMPC-6 wt%. | ||
Elemental analysis of NMPC-6 wt% revealed that a significant amount of oxygen and nitrogen remained in the carbon (Table 2). Even after thermal treatment at 1200 °C for 3 h (NMPC-6 wt% TT), the number of nitrogen atoms remained over half of those of NMPC-6 wt%, whereas most of the oxygen atoms in NMPC-6 wt% were removed by thermal treatment.
| Sample name | Carbon (wt%) | Nitrogen (wt%) | Oxygen (wt%) | Hydrogen (wt%) |
|---|---|---|---|---|
| NMPC-6 wt% | 71.8 | 10.5 | 16.3 | 1.4 |
| NMPC-6 wt% TT | 91.2 | 5.7 | 2.6 | 0.5 |
The electro-chemical performance of NMPC-6 wt% was analyzed using CV, galvanostatic charge/discharge and EIS. Fig. 7(a) shows the cyclic voltammograms of NMPC-6 wt%, NMPC-6 wt% TT and Ketjen Black. All the samples exhibited nearly rectangular shapes, indicating ideal capacitive behavior.
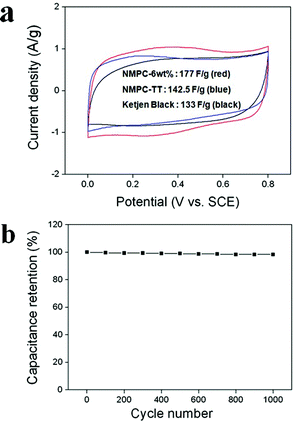 | ||
| Fig. 7 (a) Cyclic voltammogram of NMPC-6 wt% (red), NMPC-6 wt% TT (blue) and Ketjen Black (surface area: 1400 m2 g−1, black) at a scan rate of 5 mV s−1 over a potential range of 0 V to 0.8 V in a 1 M H2SO4 aqueous solution and (b) variation of the specific capacitance of NMPC-6 wt% as a function of the cycle number measured at 20 mV s−1 in a 1 M H2SO4 aqueous solution. | ||
The steep slope of NMPC-6 wt% in the current change at the switching potentials indicated a small mass-transfer resistance. The interconnected and opened meso/macroporous structure of NMPC-6 wt% facilitated the ideal capacitive behavior as a result of the fast ionic motion. The capacitance value (177 F g-1) of NMPC-6 wt%, having a surface area of 1149.8 m2 g−1, was higher than that (133 F g-1) of Ketjen Black, having a surface area of 1400 m2 g−1. This superior performance of NMPC-6 wt% was attributed to the pseudocapacitive behavior of the nitrogen and oxygen functional groups, as well as the small mass-transfer resistance. The capacitance of NMPC-6 wt% TT was reduced to 143 F g-1. Because NMPC-6 wt% TT lost most of its oxygen atoms and about half of its nitrogen atoms due to the thermal treatment, its capacitance was considerably decreased, although it remained higher than that of Ketjen Black. This result suggests that the charge storage induced by the pseudocapacitive behavior performs an important function in the performance of NMPC-6 wt%. Fig. S4 shows the specific capacitances of NMPC-6 wt%, NMPC-6 wt% TT and Ketjen Black at various current densities. The specific capacitance as a function of cycle number is presented in Fig. 7(b). NMPC-6 wt% exhibited a long cycle life over the entire range of cycle numbers. After 1000 cycles, the capacitance was decreased by only 1.64% of the initial capacitance, demonstrating that NMPC-6 wt% has good cycle stability and a high degree of reversibility in repetitive charge/discharge cycling. Generally, the high-frequency region of the Nyquist plot represents the sum of the internal resistance of the carbon material, electrolyte resistance, and contact resistance between the working electrode and the current collector. Under the same experimental conditions, the difference of the resistance depends on the internal resistance of the carbon material. The semicircle in Fig. 8(a) represents the charge transfer resistance of NMPC-6 wt%. The semicircle is associated with the pseudocapacitive interaction of NMPC-6 wt% and becomes smaller for NMPC-6 wt% TT, suggesting that the thermal treatment lowered the charge transfer resistance. This result means that the relatively larger semicircle of NMPC-6 wt% resulted from a Faradaic pseudocapacitive interaction to a greater extent than that of NMPC-6 wt% TT. In the low-frequency region, the imaginary part of the impedance plots represents the capacitive behavior. In the case of the electric double layer capacitor (EDLC), the impedance plot should theoretically be a vertical line, parallel to the imaginary axis. However, the impedance plots of NMPC-6 wt% and NMPC-6 wt% TT with pseudocapacitive interactions did not follow such a capacitive behavior. Fig. 8(b) shows the galvanostatic charge/discharge curve of NMPC-6 wt%. A sharp IR drop is observed due to the electro-resistivity of NMPC-6 wt% by numerous nitrogen and oxygen atoms. However, NMPCs carbonized over 800 °C have lower capacitance values than NMPC-6 wt% due to a decrease of the pseudocapacitive behavior of the hetero-atoms. If the degradation of the electrical performance by the IR drop is resolved under the same hetero-atom contents, the performance of NMPC-6 wt% will be much improved.
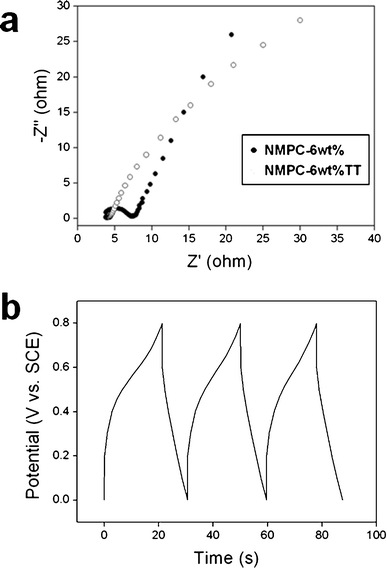 | ||
| Fig. 8 (a) Nyquist plots of the NMPC-6 wt% and the NMPC-6 wt% TT in the frequency range of 100 kHz–0.1 Hz measured during the cycle life testing and (b) galvanostatic charge/discharge curve of the NMPC-6 wt% in the potential window of 0 to 0.8 V at a current density of 10 mA cm−2. | ||
Conclusions
We fabricated a novel carbon material with a 3-D uniform and interconnected multimodal porous structure containing numerous nitrogen and oxygen atoms from channel ICs of cellulose hosted by urea hydrates. The channel ICs were prepared using an easy, cheap and eco-friendly process with NaOH/urea/water solvents, in different compositions. The NMPCs with uniform and interconnected structures were easily fabricated without any special technique such as a template-assisted synthesis and could be obtained on a gram-scale due to the simple process and cheap materials used. The high surface area of the NMPCs was induced by two activation agents: NaOH and the CO2 gas that was emitted during the thermal degradation of the urea. In addition, numerous nitrogen and oxygen atoms remained in the NMPCs after the carbonization process and, in NMPC-6 wt%, afforded a higher capacitance by pseudocapacitive behavior. In addition, the cyclic voltammogram plot of NMPC-6 wt% exhibited an almost rectangular shape, indicating ideal capacitive behavior, due to the interconnected and opened meso/macroporous structure. NMPC-6 wt% exhibited good cycle stability and a high degree of reversibility in the repetitive charge/discharge cycling. As well as supercapacitors, NMPCs have the potential for wide applications such as the electrodes of fuel cells and secondary batteries, hydrogen storage devices, sensors and adsorbents.Acknowledgements
This work was supported by the National Research Foundation of Korea Grant funded by the Korean Government (MEST) (NRF-2010-C1AAA001-0029018).References
- P. Simon and Y. Gogotsi, Nat. Mater., 2008, 7, 845–854 CrossRef CAS.
- N. Brun, S. R. S. Prabaharan, M. Morcrette, C. Sanchez, G. Pecastaings, A. Derre, A. Soum, H. Deleuze, M. Birot and R. Backov, Adv. Funct. Mater., 2009, 19, 3136–3145 CrossRef CAS.
- S. Zhang, L. Chen, S. Zhou, D. Zhao and L. Wu, Chem. Mater., 2010, 22, 3433–3440 CrossRef CAS.
- C. Liang and S. Dai, Chem. Mater., 2009, 21, 2115–2124 CrossRef CAS.
- S. Alvarez and A. B. Fuertes, Carbon, 2004, 42, 433–436 CrossRef CAS.
- S. W. Lee, N. Yabuuchi, B. M. Gallant, S. Chen, B. S. Kim, P. T. Hammond and Y. Shao-Horn, Nat. Nanotechnol., 2010, 5, 531–537 CrossRef CAS.
- D. Hulicova Jurcakova, M. Kodama, S. Shiraishi, H. Hatori, Z. H. Zhu and G. Q. Lu, Adv. Funct. Mater., 2009, 19, 1800–1809 CrossRef CAS.
- L. Zhao, L. Z. Fan, M. Q. Zhou, H. Guan, S. Qiao, M. Antonietti and M. M. Titirici, Adv. Mater., 2010, 22, 5202–5206 CrossRef CAS.
- J. Schurz, Prog. Polym. Sci., 1999, 24, 481–483 CrossRef CAS.
- J. Cai, L. Zhang, S. Liu, Y. Liu, X. Xu, X. Chen, B. Chu, X. Guo, J. Xu and H. Cheng, Macromolecules, 2008, 41, 9345–9351 CrossRef CAS.
- J. Cai and L. Zhang, Macromol. Biosci., 2005, 5, 539–548 CrossRef CAS.
- J. Cai, L. Zhang, C. Chang, G. Cheng, X. Chen and B. Chu, ChemPhysChem, 2007, 8, 1572–1579 CrossRef CAS.
- A. Lue, L. Zhang and D. Ruan, Macromol. Chem. Phys., 2007, 208, 2359–2366 CrossRef CAS.
- P. M. Schaber, J. Colson, S. Higgins, D. Thielen, B. Anspach and J. Brauer, Thermochim. Acta, 2004, 424, 131–142 CrossRef CAS.
- M. Evans, E. Halliop and J. Macdonald, Carbon, 1999, 37, 269–274 CrossRef CAS.
- M. Lillo-Rodenas, D. Lozano-Castello, D. Cazorla-Amoros and A. Linares-Solano, Carbon, 2001, 39, 751–759 CrossRef CAS.
- F. Rodriguez-Reinoso, A. Pastor, H. Marsh and M. Martinez, Carbon, 2000, 38, 379–395 CrossRef CAS.
- F. Rodriguez-Reinoso and M. Molina-Sabio, Carbon, 1992, 30, 1111–1118 CrossRef CAS.
- T. Ramanathan, F. Fisher, R. Ruoff and L. Brinson, Chem. Mater., 2005, 17, 1290–1295 CrossRef CAS.
- U. Zielke, K. Huttinger and W. Hoffman, Carbon, 1996, 34, 983–998 CrossRef CAS.
- D. Hulicova, J. Yamashita, Y. Soneda, H. Hatori and M. Kodama, Chem. Mater., 2005, 17, 1241–1247 CrossRef CAS.
- D. Hulicova, M. Kodama and H. Hatori, Chem. Mater., 2006, 18, 2318–2326 CrossRef CAS.
- G. Lota, B. Grzyb, H. Machnikowska, J. Machnikowski and E. Frackowiak, Chem. Phys. Lett., 2005, 404, 53–58 CrossRef CAS.
Footnote |
| † Electronic Supplementary Information (ESI) available. See DOI: 10.1039/c2ra20421e/ |
| This journal is © The Royal Society of Chemistry 2012 |
