Influencing the room temperature oxidative stability of nanoclusters by alloying with more oxophilic elements†
Ram
Subbaraman
a and
Subramanian K. R. S.
Sankaranarayanan
*b
aNuclear Engineering Division, Argonne National Laboratory, Argonne, IL 6043, USA
bCenter for Nanoscale Materials, Argonne National Laboratory, Argonne, IL 60439, USA. E-mail: skrssank@anl.gov
First published on 17th July 2012
Abstract
Oxidative stabilities of single component nanoclusters are studied in the presence of an oxophilic element. Atomistic simulations are used to study the early stages of heterogeneous oxidation of a representative binary alloy nanoclusters such as Ni–Al. The role of oxophilic Al atoms in enhancing the oxidation of Ni atoms in the Ni–Al alloy is highlighted. The simulated trajectories are used to better elucidate the mechanism of oxidation for two elements with distinct oxidation rates. Increased oxidation kinetics for particles with higher Al content is consistent with higher oxophilicity of Al atoms in comparison with Ni atoms. Ni rich alloys are found to be least oxidized with significant phase segregation between the Ni and Al phases. Furthermore, the oxides formed were found to be non-stoichiometric for Ni rich alloys and near stoichiometric for Al rich alloys. Phase segregation for the alloys is also found to be induced, resulting from the relative differences in the atom mobilities during the oxidation process. Thermodynamic and kinetic considerations are used to understand the higher degree of oxidation of Ni atoms in the presence of a higher composition of Al oxides. The simulations suggest a general strategy that allows for tuning the room temperature oxidative stability of single component nanoclusters by alloying with a higher oxophilic element.
I. Introduction
Oxides of metals and alloys offer unique physical and chemical properties and hence have found a niche as functional materials for various technological applications such as information storage, catalysis, hydrogen storage, permanent magnets, optoelectronics and ferrofluids.1,2 With the vastness in applications for metal oxides and composite oxides, both on the nano- and macro scale, the synthesis of such oxides has garnered a lot of momentum recently. Subtle variations in stoichiometry, composition, defect density and structure of such oxides can provide significant alteration of properties thus providing a wide range of possibilities for applications.1,2 Particularly of interest is the ability to tune the stoichiometry, and the morphology of oxides both in the elements' native form as well in an alloyed state. Alloying has long been identified as a key method to alter the electronic properties of materials, either for catalysis or for mechanical stability. In this work, using molecular dynamics simulations, we demonstrate how alloying can also be used as a means to “synthesize” and “stabilize” nanoscale complex oxides, particularly oxides of highly oxidation resistant element such as Ni in the presence of Al in varying compositions.Ni–Al alloys, also known as aluminides, are regarded as promising candidates for the next generation of high temperature and high-performance structural materials because of their high melting points, relatively low densities, good strength and high temperature corrosion and oxidation resistance.3 As important intermetallics, they showed great potential applications in automobile engines, aircraft, and electricity generation and energy conversion equipment.4 The corrosion properties of such materials are crucial in these applications, and as a result understanding the oxidation of these nanomaterials is critical. Furthermore, nanoscale oxides formed on Ni–Al alloys are regarded as promising candidates for the next generation of high-temperature and high-performance structural materials because of their high-melting points, relatively low densities, good strength and high-temperature corrosion and oxidation resistance.5,6 Additionally, NiO/Al2O3 mixed oxides are used in several interesting magnetic and catalytic applications.7,8 These applications require precise control of the oxide structure, composition and quality. Besides being able to control the microstructure of these oxides, controlling the stoichiometry and composition of these mixed oxides is of utmost importance.
Although the oxidation of metal nanoparticle is of significant practical value, very little is known about them.9 Tuning the oxidation characteristics and stability of the growing oxide layer, especially in low dimensional systems, remains a major challenge. Given the substantial contribution from the surface energy term (work function) to the overall Gibbs energy, it is expected that the oxidation of nanoparticles will behave significantly differently from their bulk counterparts.10 This is in line with other experimental and computational efforts.11,12 Further complications arise when studying alloy nanoparticles, resulting from the significant compositional variations during the oxidation. For example, the nanoscale oxidation of Ni–Al alloys can result in a complex structure consisting of a mixture of Al2O3, NiO, and NiAl2O4 oxides.8 The structure and composition of this oxide layer depends on the alloy composition, oxygen pressure, and oxidation temperature.13 Gaining a theoretical insight into the low temperature formation and growth mechanism of mixed oxides has seldom been addressed. Specifically, processes related to controlling the composition of binary oxides are extremely difficult due to microstructural changes brought about by phenomena such as surface segregation and micro-mixing of dopants.14 Furthermore, differences in the oxidation kinetics of the alloy constituents can also result in the formation of either a singular oxide layer (for the element with higher oxophicility),15 or result in the formation of equimolar mixed oxides.16 Phase stability of the binary oxides is another critical issue limiting the compositional control to high temperatures.17,18
Given these complexities, developing a methodology to better treat/understand the mechanism of low temperature oxidation and oxide growth at the atomic scale over a range of alloy compositions will be vital for the progress of development strategies for synthesizing complex oxides. Besides treating the mechanism, such methodologies should be able to answer the questions regarding microstructural and compositional changes that occur during the early stages of alloy oxidation, which are particularly poorly understood thus far.13,19 While low-temperature oxidation of pure metal surfaces and thin films such as Al(100) and Ni(100) as well as nanomaterials of Ni (primarily experimentally) and Al have been thoroughly investigated using experimental and computational techniques,20–23 very little effort has been dedicated toward understanding the Ni–Al alloys, most definitely on the nanoscale level. Given the great practical importance of such materials,24 obtaining insights on a molecular level into the processes occurring during the oxide growth on the complex Ni–Al alloy nanoparticle systems is the main focus of the work presented here.
Here, we demonstrate, using a variable charge molecular dynamics simulation study, the ability to tune the atomic scale oxidative stability of a metal nanocluster by alloying it with a more oxophilic element. We specifically report on the early stages of oxidation and dynamics of oxide growth on Ni–Al alloy nanoclusters, with a focus on temperature as well as size effects. Formation of the oxide scale, and its role in stabilizing/destabilizing the surface segregation/mixing of the alloy materials were investigated. The dependence of the composition of the alloy on the overall oxidation stability of the alloys as well as the resulting morphologies is evaluated using dynamical correlation functions. The valence states of the oxide constituents are characterized using the simulated trajectories. Finally, the atomistically simulated evolution of charges and atomic diffusivities for various alloy compositions is used to clearly explain the observed differences in the oxide composition and the stoichiometry of the grown oxide layer.
II. Computational details
A. Monte Carlo simulations
Monte-Carlo (MC) simulations, in combination with the EAM formulation, were used to predict the structure of clusters containing two different kinds of atoms for various cluster compositions.25,26 The detailed description of the EAM formalism utilized here has been documented in ref. 27–29.The state of the system was characterized by the energy of the system as given by eqn (2.1): | (1) |
In the above equation, ρj is the electron density due to atom j. The first term is the embedding energy for atom i which is embedded into the background electron density, and the second term is the core–core pair repulsion between atoms i and j separated by a distance rij. The force field parameters used to model Al and Ni were obtained from the correlations developed by Neurock et al.30 which is the same as that used for modeling the metallic interactions in the charge transfer ionic potential used for subsequent oxidation simulations.
The standard Metropolis MC method was used to generate the minimum energy configuration at 300 K. Monte Carlo (MC) simulation methods based on the Metropolis algorithm have been successfully been used in previous surface segregation calculations for various alloys to generate equilibrium alloy configurations and provide an average thermodynamic profile over a thermodynamic equilibrium ensemble. The MC simulations were carried out in a canonical ensemble where the total number of atoms of each element and the temperature are held constant. In the MC approach, starting from an initially randomly distributed atomic configuration of the alloy, the successive configurations are generated in proportion to the probabilities of a configuration occurring in the equilibrium ensemble. During each of the MC step, one of the following two configurational transformations is tried out with an equal probability:
(1) We displace a randomly selected atom from its original position in a random direction. The magnitude of the displacement is chosen to be in the range of (0, rmax]. At a given temperature, the maximum displacement rmax is selected such that the acceptance rate of new configurations is about 0.5 during the equilibrated part of the simulations.
(2) Two randomly selected atoms with different element types are exchanged and the atoms are switched in the lattice.
Event (1) accounts for the relaxation and vibration processes whereas event (2) accounts for the inter-diffusion process in the model system. The transition probability is based on the Boltzmann distribution and is given by:31
 | (2) |
Here, kB is the Boltzmann constant and T is the temperature and ΔE is the change in system energy when an event is executed. If P ≥1 (decrease in energy), the new configuration is always retained, while if P < 1 (increase in energy), the new configuration is accepted with probability P. The procedure is repeated for multi-million MC steps and the convergence was obtained when the minimum energy obtained during the simulation steps becomes constant (ΔE < 0.01 eV), and the state of the system corresponding to that minimum energy was retained as shown in Fig. 1. A large number of simulations (100), with random initial configurations, each having (1000 times the total number of atoms) steps were performed to ensure convergence.
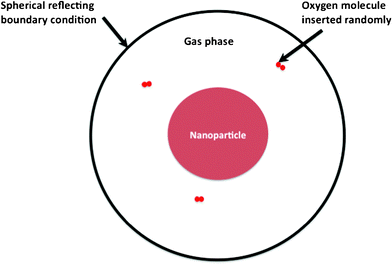 | ||
| Fig. 1 Schematic showing the simulation cell of alloy nanoparticle and the vacuum surrounding it. The nanoparticle of radius R is at the center of the simulation cell. A spherical reflecting wall located at 2.5R holds the gas phase oxygen atoms. | ||
It is important to note that the alloying of two elements with a significant size mismatch (lattice constants for Ni and Al are 3.5 and 4.05 Å, respectively) leads to the formation of a defective nanoparticle. Besides the lattice mismatch, other factors such as surface energy differences and mixing entropies of the alloying elements dictate the final crystal structure and composition. All of these can lead to the crystallographic facets being not well-defined, which justifies the use of MC simulations to generate the initial configuration for MD simulations. Also, given the relatively small sizes of the particle, MC equilibration at 300 K can also influence the “crystallinity” of the facets.
Thus, the main purpose of the MC equilibration is to identify the energetically optimized structure, both in terms of surface segregation properties as well as relative bond distances. Given the large lattice mismatch between Ni and Al, and the large surface energy differences, randomly filling the nanoparticle co-ordinates with Ni and Al atoms, can lead to a non-equilibrium structure. Our purpose here is to understand the role of surface segregation and the objective of the MC is to mimic a simulated annealing process, where the atoms are placed in the most energetically favorable positions. In the absence of such equilibration, at relatively large compositions of Al, there might be significant phase segregation and/or very defective oxide structures. Also, using the energetically optimized structures helps us avoid any ambiguities related to variations in the starting configurations for various alloys.
Here, we study oxidation of Ni–Al alloy nanoparticle having 2.5 nm diameter over a range of alloy composition (15–75% Al). For each of the starting metal alloy compositions, the initial minimum energy configuration was generated using Monte-Carlo simulations and consisted of a surface segregated structure with Al atoms segregating and preferentially locating themselves at the exposed faces (Fig. 2).13 The potential model and MD simulation details are further discussed below.
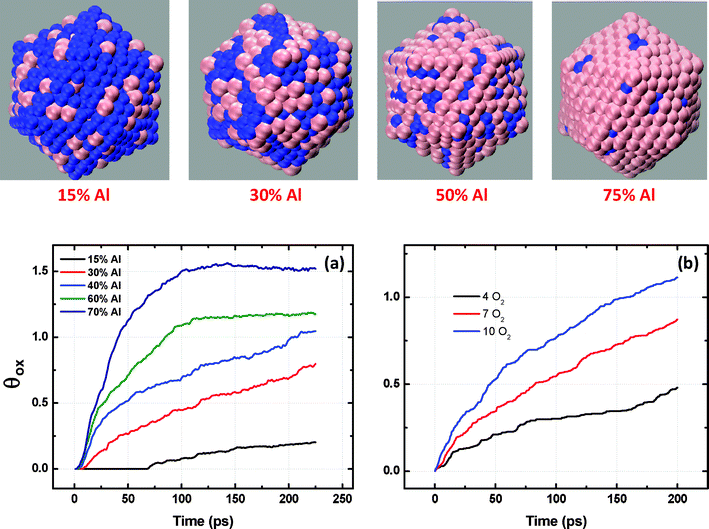 | ||
| Fig. 2 Initial configurations of alloy nanoparticles after 1M MC simulation steps. Increasing Al composition leads to Al (pink) segregation on the surface in lieu of Ni (blue). Room temperature oxidation kinetics of Ni–Al nanocluster having 2.5 nm diameters as a function of (a) alloy composition; (b) pressure for 50%Ni–Al. | ||
B. Potential model and simulation details
To simulate the alloy nanoparticle oxidation, we utilize molecular dynamics (MD) simulations employing a charge transfer ionic potential model that allows for variable and dynamic charge transfer between the atoms.13,19,32 It is capable of treating both metallic and ceramic systems as well as the bond formation and bond breakage involved in oxidation processes. Additionally, it can take into account the presence of multiple oxidation states as well as partial oxides in the oxide film. The oxidation set-up (Fig. 1) and computational details are similar to that discussed in ref. 13 and 19 and are summarized below. These are also provided in detail in the ESI.†C. Set-up of the oxidation simulations
The minimum energy configurations obtained using the Monte-Carlo simulations are first equilibrated at room temperature. The equilibration run for each alloy configuration comprised of 100![[thin space (1/6-em)]](https://www.rsc.org/images/entities/char_2009.gif) 000 equilibration steps ignoring the dynamic charge transfer between the metal atoms. The temperature was maintained constant at 300 K using a Nose-Hoover thermostat.33 The particles are allowed to freely relax during these equilibration runs. The equilibrated samples are then simulated in a NVT ensemble for 1 ps with dynamic charge transfer using the modified CTIP potential model to generate the final 300 K relaxed configuration. The atomic charges in the alloy metal samples were found to fluctuate around zero with a magnitude of ± 0.06e at the outermost layers and ± 0.02e in the bulk alloy. Similar charge fluctuation was observed in the simulations of Hasnaoui et al.34
000 equilibration steps ignoring the dynamic charge transfer between the metal atoms. The temperature was maintained constant at 300 K using a Nose-Hoover thermostat.33 The particles are allowed to freely relax during these equilibration runs. The equilibrated samples are then simulated in a NVT ensemble for 1 ps with dynamic charge transfer using the modified CTIP potential model to generate the final 300 K relaxed configuration. The atomic charges in the alloy metal samples were found to fluctuate around zero with a magnitude of ± 0.06e at the outermost layers and ± 0.02e in the bulk alloy. Similar charge fluctuation was observed in the simulations of Hasnaoui et al.34
The oxidation of the alloy nanoparticles is initiated by introducing O2 molecules in the vacuum with their radial positions chosen randomly (Fig. 1). The velocities of the O2 are chosen from a Maxwell-Boltzmann distribution corresponding to the required temperature. Additionally, spherical reflecting boundary conditions are imposed to the molecules that might reach the simulation box limit. The gas pressure is maintained constant during the simulation by introducing a new O2 molecule only when the previous molecule dissociates and forms bonds with the metal atoms. The equations of motion are integrated using a leapfrog scheme with time steps of 1 fs. The charge relaxation procedure used to minimize the electrostatic energy subject to the electro-neutrality principle is very time consuming. Hence, the atomic charges were updated every 10th MD step. The influence of a more frequent charge update was found to have no influence on the observed simulation results.
III. Results and discussion
A. Oxidation kinetics
Our simulation of Ni–Al nanoparticles indicates that the oxidation kinetics and oxide growth are strongly dependent on the composition of the alloy. Fig. 2(a) shows the room temperature oxidation kinetics of Ni–Al nanoclusters having 2.5 nm diameters as a function of Ni–Al alloy composition. The oxidation is characterized by faster initial kinetics followed by a slower growth phase. The rate of oxide growth is found to decrease with increasing composition of Ni in the Ni–Al alloys. For higher Ni composition in the Ni–Al alloy (15% Al), the surface of the exposed nanoparticle surface is predominantly comprised of Ni atoms. Hence the surface sites available for oxidation reduce with increasing Ni composition in the Ni–Al alloy. It is well known that the oxidation kinetics of Ni is much slower as compared to Al.35 The oxidation of Ni rich alloys requires a higher activation energy barrier to be overcome and thus results in slower oxidation kinetics when compared to Al-rich alloy particles.35 For nanoparticles higher in Al composition (60–75%), the kinetics of oxidation is much faster, as a result of which the entire particle is oxidized within 200 ps of the simulation time. However, with increasing composition of Ni, especially at longer simulation times, the oxygen diffusion into the substrate is impeded resulting in the reduced oxidation rates for Ni rich nanoalloys; the rates of oxidation with increasing Al composition are shown in Fig. 2(a).We have also modeled the oxidation of pure Ni nanoparticles. Ni has much slower oxidation kinetics than Al and hence the final oxide structure in the case of pure Ni comprises of discontinuous surface oxide formation as shown in the ESI.† The oxide formation and oxidation kinetics are similar to those observed for low-Al content Ni–Al alloy.
To investigate the effect of gas pressures on the binary oxide growth, we simulated oxidation of 50% Ni–Al alloy particle with 2.5 nm diameter at three different pressures (4, 7 and 10 O2). The temperature is kept constant at 300 K. Pressure is controlled in the MD box by maintaining the gas phase number for oxygen molecules constant. Gas phase molecules were characterized by a lower negative charge (typically <−0.2), i.e. non-adsorbed oxygen atoms. The kinetic curves showing the effect of gas pressure on the oxide growth on 50% Ni–Al alloy particles are shown in Fig. 2(b). As expected, the oxidation kinetics is found to increase with increasing gas pressure. This is consistent with the enhanced diffusion as well as the number density of oxygen atoms available for the oxidation process. Experimental observations of oxidation of Al surfaces have been shown to follow such trends with partial pressure of oxygen.36–39 The effect of pressure is complemented by studying the effect of particle size for a given composition at constant temperature and pressure. This is shown in Fig. 3. The oxygen uptake is defined in terms of the ratio of the oxygen/metal atoms in the growing oxide particle. With an increase in particle size, the ratio of surface area to volume goes down. Hence, the surface area with respect to the total number of metal atoms is expected to go down with size, which explains the observed decrease in the oxophilic character. Therefore, the relative oxophilicity of the particles decreases with increasing particle size, and as a result, the largest particles considered here are found to exhibit a very low degree of oxidation at the same time in comparison with the smaller particles. This can be associated with the lower values of the metal atom/oxygen ratio. This clearly indicates that the oxidation kinetics for an infinite surface will be a lot slower in comparison with nanoparticles, further confirming that the rate of oxidation is a strong function of particle size, partial pressure of oxygen as well as the relative composition of oxophilic elements. Having established the dependence of oxidation kinetics on particle size, composition and partial pressure of oxygen, we then focus on the role of temperature on the activation energy and hence the kinetics of oxidation.
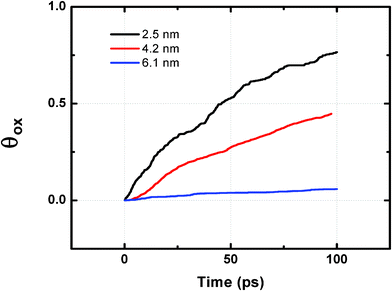 | ||
| Fig. 3 Size effect on the oxidation kinetics of 50% Ni–Al nanocluster. The particles were maintained under 7 O2 molecules gas pressure. | ||
We have also evaluated the effect of temperature on the binary oxide growth. We simulated oxidation of 50% Ni–Al alloy particle with 2.5 nm diameter at three different temperatures (300, 400 and 500 K). The oxygen gas pressure was kept constant at 2 O2. For each of the simulation runs, the temperature was kept constant using a Nose-Hoover thermostat. The kinetic curves showing the effect of temperature on oxide growth on 50% Ni–Al alloy particles are shown in Fig. 4. The oxidation kinetics at any given temperature exhibits an initial stage of fast oxide growth followed by a low growth rate. As expected, the kinetics of oxide growth becomes faster at higher temperatures. This can be attributed to the increased mobility of the atoms of both the metal and oxygen, as a result of which the overall activation energy for the process is lowered. We refrain from any detailed kinetic analysis at this juncture and so we will not discuss the variation in activation energies as a function of temperature. At the end of 300 ps of simulation time, the oxygen uptake increased from θox = 0.5 at 300 K to θox = 0.75 at 500 K.
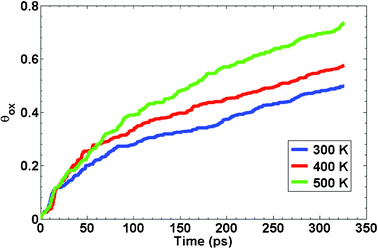 | ||
| Fig. 4 Temperature dependence of the oxidation kinetics of 50% Ni–Al nanocluster having diameters of 2.5 nm. | ||
It is worth noting that the Ni–Al alloys have potential high-temperature applications (T > 1000 K). It is well known that the nanoparticles undergo melting point depression when compared to their bulk counterparts. Therefore, at these high temperatures, the nanoparticles are likely to undergo a significant change in their structure during their operation. The crystal structure is likely to be more amorphous and one would expect to see higher inter-mixing between the alloying components. The oxidation kinetics and oxide growth will be expected to be different from those reported at low temperatures (Fig. 4).
B. Oxygen molecule interaction with Ni–Al(100) surface and nanoparticles
To study the mechanism of the initial oxidation of Ni–Al nanoparticles and surfaces, it is necessary to first understand the dynamics of oxygen impingement from the gas phase onto the Ni–Al(100) alloy substrate. Fig. 5(a) shows the simulated trajectory of the oxygen molecule as it approaches the alloy substrate for four independent simulation runs. The adsorption and dissociation of oxygen molecules on the Ni–Al(100) surface with a (30 × 30) Å 2 exposed surface area and a film thickness of 10 Å was investigated. Fig. 5(a) shows the mean separation distance between the atoms of each oxygen molecule as it approaches the surface. Fig. 5(a) shows that dissociation starts effectively when the center of mass of the molecule is located at a position that ranges between 2 and 3 Å above the surface. In the oxidation simulations of the alloy surface, we find that the molecule on reaching the substrate surface rotates to make an angle that varies from 10 to 60° with the vertical. The oxygen molecule rotation acts as a precursor to the dissociation when the separation distance begins to significantly exceed the bond length. This is typical of the behavior reported for other metal surfaces such as Al and Ni.13,34 We note that the separation distance immediately after the complete dissociation process ranges from 5 to 9 Å. It should be noted that the molecular dissociation was observed only when both atoms were bound to the surface. Our analysis of the charge distribution profile of the atoms corroborates this argument. The charges on the oxygen atoms indicated that they attain valence values only after they are bound to the substrate surface. In our simulations of Ni–Al surfaces, we do not observe an abstractive adsorption process where one oxygen atom remains on the surface and the second emerges to the gas phase. The dissociated oxygen atoms have positions, which vary between 1 Å above, and 1 Å below the substrate surface plane. This indicates that the adsorbed and dissociated oxygen molecules remain at the surface. The dissociative chemisorption of oxygen on Ni–Al(100) is in agreement with previously reported experimental and theoretical studies.35,40,41 Several UHV studies have also focused on studying the dissociative adsorption of oxygen on various metal surfaces, ranging from Pt, Ni, Al, etc.42–44 The presences of defects and impurities, as well as the surface coverage of adsorbed species (either dissociated oxygen along with un-dissociated but strained oxygen molecules) have all been known to enhance the dissociative adsorption process. As we move from such ordered surfaces to the nanoclusters, the presence of edges, vertices and low coordinated defect sites on the surface of these particles, the activation energy for dissociative adsorption is expected to be far lower. This could explain the lack of clear evidence of molecular oxygen adsorption. Also, the oxophilicity of the metal atom and its local environment plays a major role in the adsorption process as well.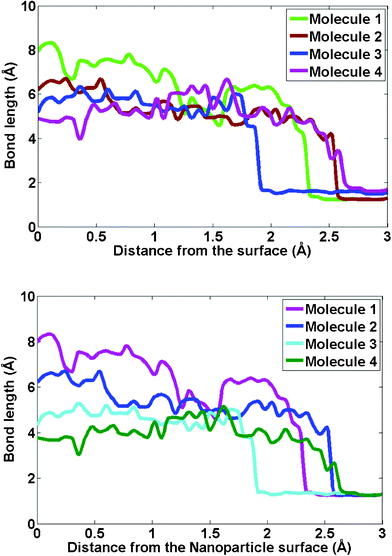 | ||
| Fig. 5 Bond length defined as the separation distance of the two atoms of the oxygen molecule plotted versus the distance of the center of mass of the pair from the Ni–Al surface. (a) Simulated trajectories of four typical runs of oxygen molecules approaching the Ni–Al(100) surface are shown to illustrate the dissociative chemisorption of oxygen molecules. (b) Comparison with the trajectories of the oxygen molecule approaching the Ni–Al alloy nanoparticle is also shown. | ||
As a result, in the case of nanoparticle oxidation, our analysis of the simulation trajectories (Fig. 5(b)) suggests that the oxygen molecule undergoes a dissociative adsorption onto the nanoparticle surface. As seen in Fig. 5(b), the oxygen molecule dissociation starts effectively when the center of mass of the molecule is located at a position that ranges between 1.8 and 3 Å above the particle. Interestingly, we find that the nanoparticle oxidation is initiated at the low coordination sites such as vertex and edges as shown in Fig. 6. Closer examination of the MD simulation trajectories indicated that nanoparticle oxidation is favored on low co-ordinated sites such as the vertex of icosahedra. We also find that prior to adsorption on these low coordinated sites, the oxygen molecule undergoes rotation which acts as a precursor before the separation distance begins to significantly exceed the bond length. This is in contrast with surfaces, where at relatively low surface coverages the adsorption of oxygen molecule can proceed via a bridge bonding or a two-site process. In contrast, at the vertex and edges of the nanoparticles, the adsorption seems to proceed via an atop adsorption step followed by a relatively fast re-orientation and dissociation on the surface. This can be again attributed to the difference in surface energy as well as the relative inter-atomic strain that exists between the atoms in the nanoparticle.
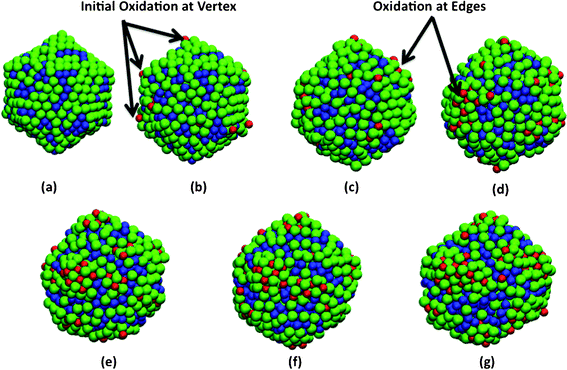 | ||
| Fig. 6 Snapshots showing initial oxidation of 2.5 nm diameter Ni–Al alloy nanoparticles at 300 K and 2O2 pressure. Configurations at (a) initial (b) 1 ps (c) 5 ps (d) 10 ps (e) 20 ps (f) 30 ps (g) 40 ps. Oxidation is initiated at the low coordinated sites such as corners and edges. The Al atoms are shown in green, Ni in blue, and oxygen in red. | ||
C. Structural and dynamical analysis of oxide growth
The oxide scale formed on Ni–Al alloy nanoparticles is amorphous in nature for all the simulated alloy compositions. Fig. 3 shows the partial pair distribution function (PDF) of both Al–O and Ni–O computed over a composition range of 15–75% Ni–Al alloy. The Al–O PDF (Fig. 7) shows a peak at around 1.8–1.9 Å for exposure times beyond 10 ps i.e. the early oxide nucleation stage. These distances correspond to the bond lengths reported for amorphous aluminum oxides that range from 1.8–1.9 Å.45 The peak intensity in the calculated RDF for Al–O increases with Al composition in the Ni–Al alloy, which suggests an increase in the number of Al ions bonded to O.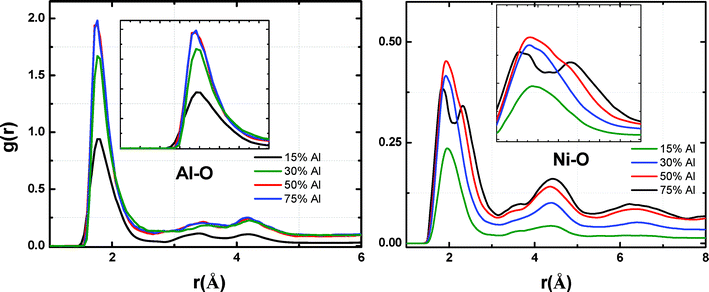 | ||
| Fig. 7 Radial distribution functions (Al–O) and (Ni–O) in the Ni–Al–O system (4 nm diameter) taken at 200 ps of exposure time for room temperature oxidation of Ni–Al alloys over a range of compositions and 4O2 pressure. | ||
Similarly, the calculated Ni–O PDF for various alloy compositions is shown in Fig. 7. The experimentally reported bond lengths of Ni–O by Caputi et al. correspond to a value of around 1.94 Å.46 Hence, formation of a nickel oxide phase should result in a sharp peak in Ni–O PDF at that distance. At higher Ni compositions (>85% Ni), the peaks in the Ni–O RDF are not well-defined and show a distribution which indicates a lower degree of formation of nickel oxide at low temperatures. The appearance of such broad and shifted peak positions suggests the existence of both non-stoichiometric as well as amorphous oxides. This could possibly arise from oxide induced surface segregation of the Ni and Al atoms that can lead to alteration of the Ni–Ni as well as Ni–O distances within the nanocluster. Interestingly, as suggested by the peak intensities in Fig. 7, the extent of formation of Ni oxide also increases when the Al composition is increased from 15 to 30% and appears to saturate for Al composition higher than 30%. For Al rich alloy particles, the oxide scale is predominantly rich in AlxOy type oxides. This is in agreement with the experimental studies of low temperature oxygen adsorption on Ni–Al surfaces by Jaeger et al. and Franchy et al.40,47
To further investigate the chemical nature of the oxide, we analyzed the ionic charge distribution of oxygen ions across the radius of the Ni–Al nanoparticle for various alloy compositions at the end of 200 ps of simulation time (Fig. 8). We find that in the case of 15% Al alloy, the nanoparticle is only partially oxidized and the core of the particle (<7 Å), which is Ni rich in composition, remains in metallic form. The average charge values of the oxygen ions in the oxidized near surface region are still significantly below the valence value of −2.0, which suggests that the oxide skin is highly non-stoichiometric and it is predominantly comprised of weakly bound oxide anions. As the Al composition of the alloy is changed to 30%, the depth of oxidation is found to increase, resulting in shrinking of the metallic core (<2.5 Å). For higher Al compositions (≥50% Al), we observe that the entire particle is oxidized and the average charges on the oxygen ions tend to approach their valence values, which is indicative of the formation of a more stoichiometric oxide.
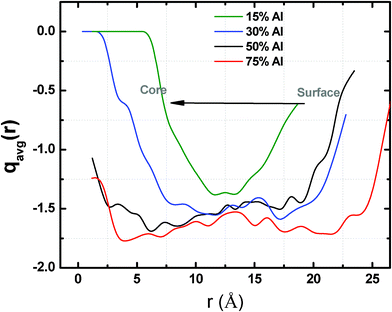 | ||
| Fig. 8 Spatial distribution of the average charges on the oxygen atoms as a function of alloy composition in the Ni–Al–O system (4 nm diameter) at room temperature and 4O2 pressure. | ||
The reduced oxygen stoichiometry and oxidation characteristics of Ni rich alloys are also supported by thermodynamic considerations. Comparison of the standard enthalpy of formation of the respective oxides, Hf(NiO) = −489.5 kJ mol−1 and Hf(Al2O3) = −1675.7 kJ mol−1 suggests that it is more favorable to form the Al–O bond.48 This manifests itself in the form of reduced extent of nickel oxide formation shown in the pair distribution for Ni rich alloys calculated by averaging over many such configurations.
To further evaluate the differences in the oxide stoichiometry, we calculate the average valence state of metal ions as a function of alloy composition (% Al) at the end of the oxidation process (Fig. 9). For the Ni–Al alloy compositions lower than 50%, it can be seen that neither Al nor Ni atoms assume full valence values. The Ni atoms are weakly charged and the charge transfer takes place primarily between the O atom and the nearest Al atoms. Interestingly, for higher Al in the alloy composition (≥50% Al), we observe that a significant fraction of both Al and Ni atoms oxidizes and attains a charge value close to their valence values of “3+” and “2+”, respectively. Increasing the Al composition in the alloy is expected to enhance the oxygen uptake for these nanoparticles. It appears that the increased uptake of O atoms into the matrix, along with the presence of more oxophilic element such as Al, increases the oxidizability of Ni atoms. Clearly then, we have enhanced the oxidizability of Ni atoms in the presence of Al atoms. This could be explained either with the variation in the electronic properties of Ni in the presence of Al-oxides or with the local increase in oxygen partial pressure experienced by Ni atoms due to the enhanced oxygen uptake by the Al atoms. For example, owing to the faster oxidation kinetics, the oxygen species acting as electron acceptors for electrons from the metal will be more and hence generate stronger bonding chemisorption ions leading to Ni oxidation. We will refrain from discussing these details in this manuscript and instead will focus on the intrinsic phase segregation behavior of Ni and Al atoms during the oxidation process. Simply, our simulations suggest that the fraction of Ni oxidized in the Ni–Al alloy nanoparticles is strongly correlated with the intake of oxygen atoms. Thus, kinetic considerations play an important role in dictating the overall oxide composition for Al-rich alloy particles.
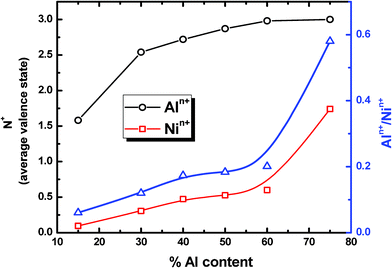 | ||
| Fig. 9 Average valence state of metal ions as a function of alloy composition (% Al) at the end of the oxidation process for the Ni–Al–O system (4 nm diameter) at room temperature and 4O2 pressure. | ||
To further evaluate the compositional variation of the growing oxide layer on the binary alloy nanoparticle, we analyze the radial atomic density distributions of Al and Ni atoms in 50% Ni–Al alloy as a function of the exposure time (Fig. 10(a)–(b)). The initial Ni–Al metal alloy nanocluster is comprised of Al rich surface and a Ni rich core. However, as seen in initial density profiles at 1 ps (Fig. 10(a), (b)) and the snapshots in Fig. 10, the segregation is not complete. There are Al atoms that are located in the cluster core and Ni occupies a small fraction of the surface sites. As seen in Fig. 10(a), the outward movement of Al atoms characterizes the early stage oxidation and oxide growth on 50% Ni–Al alloy nanoparticle. Simultaneously, as seen in Fig. 10(b), there is an inward movement of surface Ni atoms to the cluster core. The opposite movement of the constituent cations upon oxidation of the bimetallic nanoparticle is attributed to the differences in the oxidation kinetics of Al and Ni. Such a diffusion phenomenon can lead to a phase separation of the oxidized species from the unoxidized one and might lead to a segregation profile that is more pronounced than that in the starting bimetallic alloy particle. As seen from the snapshots in Fig. 6, the oxidation of Ni–Al alloys at longer times indeed leads to phase separation of aluminum oxide from metallic Ni. Even in the case of Ni–Al(100) thin films, oxidation proceeds with the formation of surface oxide, comprised primarily of aluminum oxide, with an accompanying phase segregation of Ni atoms as seen in Fig. 11.
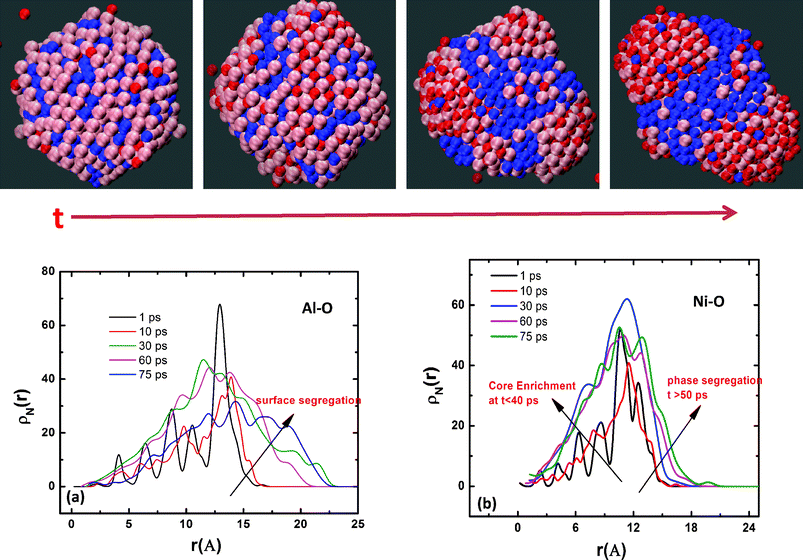 | ||
| Fig. 10 Temporal evolution of oxide composition during the nanocluster oxidation. (a) Variation of Ni composition in the nanocluster during the oxide growth process. (b) Variation of Al composition in the nanocluster during the oxide growth process. The evolution of the density profile of Ni and Al indicates phase segregation of metallic Ni from the growing aluminum oxide. The snapshots shown provide a visual evidence of oxidation induced phase segregation phenomena in Ni–Al inter-metallic alloy. Aluminum is shown in pink, Ni in blue and oxygen in red. | ||
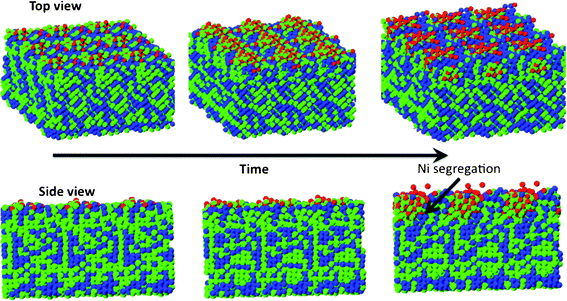 | ||
| Fig. 11 Snapshots showing oxidation induced phase segregation in Ni–Al(100) thin films. Oxidation results in the formation of a surface oxide comprised primarily of alumina. Ni segregation to the oxide metal interface is also seen at longer simulation times (>100 ps). Aluminum is shown in green, Ni in blue and oxygen in red. | ||
The phase separation of the oxidized aluminum species from the unoxidized metallic nickel can be explained based on thermodynamic and kinetic considerations. As mentioned earlier, comparison of the standard enthalpy of formation of the respective oxides, Hf(NiO) = −489.5 kJ mol−1 and Hf(Al2O3) = −1675.7 kJ mol−1 suggests that it is more favorable to form Al–O bond.48 Also, ab initio studies of oxygen adsorption on Ni–Al surfaces also indicate the preference of O atoms to have Al as a neighbor rather than Ni.41 The presence of O atom on a Ni–Ni bridge site was found to push the Ni atoms away, while the neighboring Al atoms moving towards it, following along the lines of stronger oxophilicity of Al as compared to Ni atoms. Previous ab initio as well as experimental investigations suggest much lower Ni–O bond formation for low temperature oxide grown on Ni–Al alloys and do not rule out the presence of metallic Ni on the oxide scale.35 Our MD simulations also suggest that the diffusivity of Al and O is at least an order of magnitude higher than the Ni atoms that further contributes to the observed phase segregation. It is worth noting that the phase separation of mixed oxide grown on inter-metallic alloys is a rather complicated dynamical process and is typically involved with multi-phase transformation and competition among the various phases, which would require further investigation.
IV. Conclusions
In summary, we have employed molecular dynamics simulations and investigated the early stages of oxidation and oxide growth on Ni–Al nanoparticles over a range of alloy compositions and oxidation conditions (for e.g. pressure, temperature and particle sizes). The simulated trajectories are used to elucidate the mechanism of oxidation on binary alloy nanoparticles, where the kinetics of oxidation of the constituent atoms is widely different. The MD simulations suggest increased oxidation kinetics with increasing composition of Al in the Ni–Al alloy particles; the rate of increase being higher for Al-rich alloys. Al-rich alloy particles are completely oxidized whereas there remains a large fraction of unoxidized particle for Ni-rich alloys. Structural analysis suggests formation of mixed aluminum and nickel oxide over the composition range simulated; the fraction of aluminum oxide being significantly higher for Al-rich alloys (>30% Al). Analysis of the charged states suggests significant non-stoichiometry in Ni-rich alloys whereas the oxide formed on Al-rich alloys has oxygen composition, which is closer to the stoichiometric value. Thermodynamic considerations suggest an increased and preferential oxidation of Al over Ni. This influences the dynamics of oxide growth on the Ni–Al alloy particles, which is characterized by rapid outward diffusion of Al and a simultaneous inward diffusion of Ni atoms. Such a diffusion pathway is shown to result in phase separation of the oxidized aluminum species from the unoxidized Ni metal. These simulation results could be of broader relevance to atomic scale understanding of oxide growth processes on nanoalloys that are of interest in a range of electronics and catalysis applications. The simulations demonstrate an alloying mechanism that allows for influencing the oxidative stability of mixed oxides based on the oxophilicity of the constituent metallic elements. These results also lay the groundwork for further experimental and theoretical studies on oxidation of multi-component alloy nanoparticles.Acknowledgements
This work was performed at the Center for Nanoscale Materials, a U. S. Department of Energy, Office of Science, Office of Basic Energy Sciences User Facility under Contract No. DE-AC02-06CH11357. The authors also thank the computational facilities provided by CNM-ANL.References
- H.-J. Freund, H. Kuhlenbeck and V. Staemmler, Rep. Prog. Phys., 1996, 59, 283 CrossRef CAS.
- A. Paracchino, V. Laporte, K. Sivula, M. Grätzel and E. Thimsen, Nat. Mater., 2011, 10, 456 CrossRef CAS.
- K. Morsi, Mater. Sci. Eng., A, 2001, 299, 1 CrossRef.
- Z. Wang, A. L. Fan, W. H. Tian, Y. T. Wang and X. G. Li, Mater. Lett., 2006, 60, 2227 CrossRef CAS.
- A. Rahman, R. Jayaganthan, S. Prakash, V. Chawla and R. Chandra, J. Alloys Cmpd., 2009, 472, 478 CrossRef CAS.
- C.-L. Chang, S. K. R. S. Sankaranarayanan, D. Ruzmetov, M. H. Engelhard, E. Kaxiras and S. Ramanathan, Phys. Rev. B, 2010, 81, 085406 CrossRef.
- G. R. Rao and C. N. R. Rao, J. Phys. Chem., 1990, 94, 7986 CrossRef CAS.
- A. Arranz and C. Palacio, Langmuir, 2002, 18, 1695 CrossRef CAS.
- P. A. Chernavskii, N. V. Peskov, A. V. Mugtasimov and V. V. Lunin, Russ. J. Phys. Chem. B, 2006, 1, 394 CrossRef.
- T. L. Hill, Thermodynamics of Small Systems, 1963, Benjamin, New York Search PubMed.
- A. Schmidt-Ott, P. Schurtenberger and H. C. Siegmann, Phys. Rev. Lett., 1980, 45, 1284 CrossRef CAS.
- D. M. Wood, Phys. Rev. Lett., 1981, 46, 749 CrossRef CAS.
- S. K. R. S. Sankaranarayanan and S. Ramanathan, Phys. Rev. B, 2008, 78, 085420 CrossRef.
- M. Hirsimaeki, M. Lampimaeki, K. Lahtonen, I. Chorkendorff and M. Valden, Surf. Sci., 2005, 583, 157 CrossRef CAS.
- V. Maurice, G. Despert, S. Zanna, P. Josso, M.-P. Bacos and P. Marcus, Surf. Sci., 2005, 596, 61 CrossRef CAS.
- M. Paljevića and M. Tudjab, Corrosion Sci., 2008, 50, 818 CrossRef.
- J. Klöwer, U. Brill and U. Heubner, Intermetallics, 1999, 7, 1183 CrossRef.
- D. E. Mencer Jr., D. L. Cocke and C. Yoon, Surf. Interface Anal., 1991, 17, 31 CrossRef.
- S. K. R. S. Sankaranarayanan, E. Kaxiras and S. Ramanathan, Phys. Rev. Lett., 2009, 102, 095504 CrossRef.
- T. J. Campbell, G. Aral, S. Ogata, R. K. Kalia, A. Nakano and P. Vashishta, Phys. Rev. B, 2005, 71, 205413 CrossRef.
- R. Karmhag, G. A. Niklasson and M. Nygren, J. Mater. Res., 1999, 14, 3051 CrossRef CAS.
- R. Karmhag, G. A. Niklasson and M. Nygren, J. Appl. Phys., 1999, 85, 1186 CrossRef CAS.
- K. Park, D. Lee, A. Rai, D. Mukherjee and M. R. Zachariah, J. Phys. Chem. B, 2005, 109, 7290 CrossRef CAS.
- A. Stierle, F. Renner, R. Streitel, H. Dosch, W. Drube and B. C. Cowie, Science, 2004, 303, 1652 CrossRef CAS.
- R. Subbaraman and S. K. R. S. Sankaranarayanan, Phys. Rev. B., 2011, 84, 075434 CrossRef.
- R. Subbaraman and S. K. R. S. Sankaranarayanan, Surf. Sci., 2011, 605, 1595 CrossRef CAS.
- G. Wang, M. A. Van Hove, P. N. Ross and M. I. Baskes, Progress in Surface Science, 2005, 79, 28 CAS.
- G. Wang, M. A. Van Hove, P. N. Ross and M. I. Baskes, J. Chem. Phys., 2005, 122, 024706 CrossRef.
- G. Wang, M. A. Van Hove, P. N. Ross and M. I. Baskes, J. Chem. Phys., 2004, 121, 5410 CrossRef CAS.
- X. W. Zhou, H. N. G. Wadley, J.-S. Filhol and M. N. Neurock, Phys. Rev. B, 2004, 69, 35402 CrossRef.
- N. Metropolis, A. W. Rosenbluth, M. N. Rosenbluth, A. H. Teller and E. Teller, J. Chem. Phys., 1953, 21, 1087 CrossRef CAS.
- X. W. Zhou, H. N. G. Wadley, J.-S. Filhol and M. N. Neurock, Phys. Rev. B, 2005, 68, 065402 Search PubMed.
- D. J. Evans and B. L. Holian, J. Chem. Phys., 1985, 83, 4069 CrossRef CAS.
- A. Hasnaoui, O. Politano, J. M. Salazar, G. Aral, R. K. Kalia, A. Nakano and P. Vashishta, Surf. Sci., 2005, 579, 47 CrossRef CAS.
- M. W. Finnis, A. Y. Lozovoi and A. Alavi, Annu. Rev. Mater. Res., 2005, 35, 167 CrossRef CAS.
- H. L. Yu, M. C. Munoz and F. Soria, Surf. Sci. Lett., 1980, 94, L184 CrossRef CAS.
- J. L. Erskine and R. L. Strong, Phys. Rev. B, 1982, 25, 5547 CrossRef CAS.
- L. P. H. Jeurgens, W. G. Sloof, F. D. Tichelaar and E. J. Mittemeijer, J. Appl. Phys., 2002, 92, 1649 CrossRef CAS.
- L. P. H. Jeurgens, W. G. Sloof, F. D. Tichelaar and E. J. Mittemeijer, Thin Solid Films, 2001, 418, 89 CrossRef.
- R. Franchy, J. Masuch and P. Gassmann, Appl. Surf. Sci., 1996, 93, 317 CrossRef CAS.
- A. Y. Lozovoi, A. Alavi and M. W. Finnis, Phys. Rev. Lett., 2000, 85, 610 CrossRef CAS.
- J. M. Hawkins, J. F. Weaver and A. Asthagiri, Phys. Rev. B: Condens. Matter Mater. Phys., 2009, 79, 125434/1 CrossRef CAS.
- J. Hinojosa, H. H. Kan and J. F. Weaver, J. Phys. Chem. C, 2008, 112, 8324 CAS.
- H. H. Kan and J. F. Weaver, Surf. Sci., 2008, 602, L53 CrossRef CAS.
- A. J. Bourdillon, R. G. Jones and A. J. Forty, Philos. Mag. A, 1984, 49, 341 CrossRef CAS.
- L. S. Caputi, S. L. Jiang, A. Amoddeo and R. Tucci, Phys. Rev. B, 1990, 41 Search PubMed.
- R. Jaeger, H. Kuhlenbeck, H. Freund, M. Wuttig, W. Hoffmann, R. Franchy and H. Ibach, Surf. Sci., 1991, 259, 235 CrossRef CAS.
- M. W. Finnis, A. Y. Lozovoi and A. Alavi, Annu. Rev., 2005, 35, 167 CAS.
Footnote |
| † Electronic Supplementary Information (ESI) available. See DOI: 10.1039/c2ra20464a/ |
| This journal is © The Royal Society of Chemistry 2012 |
