DOI:
10.1039/C2RA20500A
(Paper)
RSC Adv., 2012,
2, 5877-5884
3-D self-assembly of flower-like particles via microwave irradiation for water treatment
Received
25th January 2012
, Accepted 20th April 2012
First published on 29th May 2012
Abstract
Three-dimensional (3-D) flower-like shape (FLS) Fe3O4 and Fe particles were successfully synthesized using FLS precursor particles that are prepared through a facile microwave-assisted reaction. The mechanism underlying the self-assembly process and shape evolution of FLS particles was systematically investigated by changing reaction parameters such as reaction temperature, reaction time and reaction pressure. During the reaction, iron alkoxide, α-Fe2O3 and FeOOH nanoparticles are formed first and are subsequently transformed to 3-D hierarchical FLS particles by the self-assembly of the primary nanoparticles. Reaction temperature and pressure play critical roles in the formation of the hierarchical flower-like superstructure. There is an optimum window of the reaction temperature (∼180 °C) for the formation of 3-D FLS particles, which is attributed to the competition between the self-assembly process and growth process of the nanoparticles. Also, since FeCl3, ethylene glycol, and urea are used together as raw materials, the appearance of FLS particles is strongly dependent on the reaction pressure. As the reaction pressure becomes larger than 1 MPa, the flake type particles become more thermodynamically favorable than the FLS particles, due to the limited decomposition of urea. Brunauer–Emmett–Teller (BET) analysis shows that FLS particles have a large surface area (>40 m2 g−1). Because of their high specific surface area and intrinsic reactivity, FLS particles efficiently remove sulfur ions in aqueous solution. This suggests that these flower-like particles can be promising materials to treat toxic gas such as H2S in an environment-friendly way.
Introduction
Synthesis of intricate 3-dimensional (3D) hierarchical nanostructure materials with controlled morphology and orientation has attracted intense interest owing to their potential application in catalysis, drug delivery, energy storage, water treatment, and sensors.1–15 Many kinds of hierarchical superstructured materials such as nano-flowers, snowflakes, and dendrites have been successfully synthesized and examined to explore their physical and chemical characteristics with respect to morphology.16–18 In general, the simplest synthetic route to a 3-dimensional hierarchical structure is the oriented assembly of nanoparticles to decrease their surface energy by stacking nanoparticle building blocks. Therefore, it is important to develop simple and reliable synthetic methods for hierarchically ordered architectures with desired morphology, which greatly acts on the properties of the final product.
Recently, a microwave reaction has been applied to chemically synthesize nanomaterials. This technique offers several advantages over other conventional techniques, such as vapor–liquid–solid (VLS), vapor phase, hydrothermal and solvothermal synthesis.19–22 Microwave irradiation reduces reaction time and temperature, which is due to the molecular level interaction of the microwave with the reagent species.23,24 This has allowed the preparation of highly crystalline nanomaterials with tailored shapes and sizes, such as uniform Ag nanoparticles, microporous SnO2, TiO2 nanowires, CdTe nanocrystals, Cu3Se2 nanoplates, and iron oxide nanorings.25–30
Fe-based magnetic nanomaterials have been intensively studied for applications of magnetic data storage devices, magnetic resonance imaging, biomedical markers, wireless sensors, water treatments, and ferrofluids.31–40 In addition to their outstanding magnetic properties, a very unique intrinsic property of Fe-based nanomaterials is their sulfidation ability. Fe-based materials are easily converted to iron sulfide, which is used to decompose hydrogen sulfide (H2S). Due to its toxic and flammable nature, H2S needs to be removed from waste gas streams of chemical plants or from byproducts of oil/gas drilling operations.41,42 Various transition metal oxide materials with high catalytic activity have been utilized in H2S removal.43–45 Among these materials, Fe-based materials are widely reported as strong oxidation reagents for H2S treatment.46,47
Several methods have been developed to synthesize Fe3O4 and Fe particles, which include thermal decomposition, co-precipitation, hydrothermal processing, reverse micelle, and sol–gel processing.48–52 In comparison, the effect of microwaves on the growth of Fe3O4 and Fe particles with a hierarchical superstructure has not been studied yet. Herein, we demonstrate a facile microwave-assisted method to fabricate flower-like Fe3O4 and Fe particles. The effect of reaction parameters and annealing conditions on the morphology and phase of the particles were examined. A growth mechanism of hierarchical particles in ethylene glycol (EG)-mediated solution was proposed. Moreover, the reaction of flower-like particles with S2− ions was tested to evaluate their efficacy as a H2S absorbent in water.
Experimental section
Synthesis of flower-like shape particles
The fabrication of flower like shape (FLS) iron oxide particles was achieved by the ethylene glycol (EG) mediated self-assembly process of nanoparticles, which has been adapted to the synthesis of several nanomaterials.53–55 1.3 g of FeCl3·6H2O, 7.2 g of tetrabutylammonium (TBAB), and 2.7 g of CO(NH2)2 (urea) were mixed homogeneously in 180 ml of EG at room temperature for 1 h. A mixture precursor with a red color was loaded into a Teflon vessel. The solution in a sealed Teflon vessel was reacted at 120–210 °C for 30 min under microwave irradiation (CEM-Marsxpress, USA). Pressure inside the vessel was controlled to be between 0.2 MPa and 1 MPa. Reaction temperature and pressure were independently controlled by changing the input of microwave power and the solution content in the vessel. The resulting particles were collected by centrifugation, washed out with ethanol several times and subsequently dried in a vacuum oven at room temperature for 18 h. As-grown particles with green color were crystallized at 400 °C in N2 or forming gas (N2 + 5%H2) for 2 h.
Sample characterization
The crystal structure of the thermally-annealed FLS-iron oxide particles was examined by the X-ray diffraction (XRD) method (Philips, PW-1810 diffractometer, Cu-Kα radiation, λ = 1.54 Å). The Raman spectroscopy of particles was carried out at room temperature with an incident beam wavelength of 633 nm (Renishaw, inVia Raman microscope). The Fourier transform infrared (FTIR, Bruker VERTEX-70LS) spectra was recorded in a transmission geometry. Particles were mixed with KBr and the mixed particles were pressed into to pellets. The morphology of FLS iron oxide particles was probed by field emission-scanning electron microscope (FE-SEM, Philips XL-30) and transmission electron microscope (TEM, JEOL 200CX). Magnetic properties were measured at room temperature by vibrating sample magnetometer (VSM, Lake Shore 7400). Nitrogen adsorption and desorption isotherm of the particles were also measured at liquid nitrogen temperature to analyze the surface structure. Before the adsorption measurement, the samples were outgassed under vacuum for 3 h at 100 °C. In order to confirm the sulfidation ability of FLS particles, 0.1 g of the particles was introduced into 100 ml of 12.5 mM sodium sulfide (Na2S) aqueous solution in a 200 ml glass. Then, the concentration of sulfur ion in water was monitored by measuring the ionic conductivity of S2− (Denver instrument, 250 conductivity meter) at every 10 min.
Results and discussion
Crystal structure analyses
XRD patterns of the as-grown and annealed particles are presented in Fig. 1. In the XRD pattern of the as-grown FLS-precursor particles (Fig. 1a), broad peaks indicate a co-existence of α-Fe2O3 and α-FeOOH. Nucleation of α-FeOOH is known to compete with that of α-Fe2O3 below 80 °C.56 Reflections of the as-grown particles at 26.4°, 33.0°, 44.8°, 53.7°, and 61.3° are indexed as (012), (104), (202), (116), and (214) of α-Fe2O3 (JCPDS 80-2377). Fig. 1(b) and Fig. 1(c) show XRD patterns of the samples that were annealed at N2 and N2+5%H2 atmosphere. To make the particles magnetically active, particles were annealed only in a reducing atmosphere. After being annealed at 400 °C in a N2 atmosphere, the XRD pattern of the FLS particles matches well with the diffraction pattern of Fe3O4 (magnetite, JCPDS 85-1436). In comparison, annealing in N2+5%H2 resulted in the appearance of an Fe phase (JCPDS 87-0721).
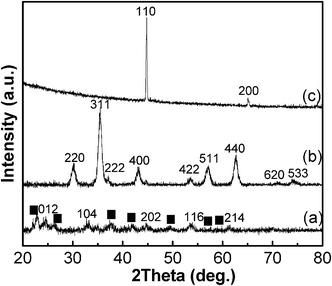 |
| | Fig. 1 XRD patterns of fabricated FLS particles; (a) as-grown FLS-precursor, (b) FLS–Fe3O4, and (c) FLS–Fe particles. (■ : α-FeOOH) | |
There are several polymorphs of iron oxide and oxyhydroxide (e.g., α-Fe2O3, α-FeOOH, γ-FeOOH) and each phase exhibits a distinctive Raman spectrum. The Raman investigation, therefore, is regarded as one of the reliable methods to discern phases of the particles which do not have a long range order.58 In addition, Raman spectroscopy is complementary to XRD analysis, which does not differentiate Fe3O4 from γ-Fe2O3 clearly.59 To accurately identify the crystal phase of each product, Raman spectroscopy is used and the Raman spectra of the as-grown and N2-annealed particles are displayed in Fig. 2. For the as-grown precursor particles (Fig. 2a), Raman peaks represent the coexistence of α-FeOOH (227, 262, 324, and 432 cm−1) and α-Fe2O3 phases (388, 494, 616, 652, 826, 914, 1064, and 1103 cm−1), which are in agreement with reported studies.60–62 The Raman spectra of N2-annealed FLS particles are presented in Fig. 2b. A relatively strong band centered at 661 cm−1 and two broad peaks at 306, and 530 cm−1 exhibit in the results, confirming the formation of the Fe3O4 phase for FLS–Fe3O4 particles.63,64 This indicates that the as-grown particles consisting of α-Fe2O3 and α-FeOOH phases are fully transformed to Fe3O4 in N2-annealing.
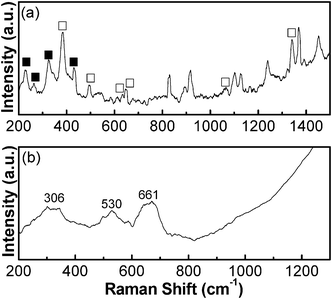 |
| | Fig. 2 Raman spectra of (a) as-grown FLS particles and (b) N2-annealed FLS particles (■ = α-FeOOH, □ = α-Fe2O3). | |
When FeCl3 meets with EG, a series of reactions occur and nanoparticles are formed in the precursor solution. First, FeCl3 first meets with EG (HOC2H4OH) and a partial reduction occurs to generate iron alkoxide.57 Then, Fe2O3 primary nanoparticles are formed by a reaction between iron alkoxide and oxygen.22 In addition to the precipitation of Fe2O3 nanoparticles, Fe3+ from FeCl3 can directly react with OH− and produce FeOOH. To validate the reaction mechanism of primary nanoparticles, the FTIR spectra of the as-grown and thermally-annealed FLS particles were investigated. The FTIR spectrum of the as-grown FLS particles is shown in Fig. 3. The strong absorption band lying in the 2500–3000 cm−1 range is characteristic of the C–H stretching mode and all the peaks located below 1750 cm−1 are Fe–O, C–O, C–C, and CH2 bonds that are the main moieties of Fe-alkoxide.65 With Raman spectra and XRD patterns, the FTIR spectra clearly supports that the Fe-alkoxide is formed from the EG-mediated reaction of FeCl3 and a significant amount of Fe-alkoxide is still left in the as-grown particles.
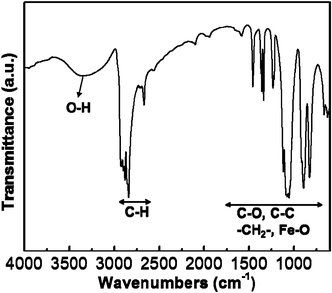 |
| | Fig. 3 FTIR spectra of the as-grown FLS particles. | |
Morphology of the superstructured particles
Changes in the morphological characteristics were examined by SEM and TEM. Fig. 4 shows SEM and TEM micrographs of the as-grown FLS particles. When raw materials were reacted at 180 °C and below 0.2 MPa, the product of the reaction was FLS particles with a size of 2∼3 μm. The surface of the petal-like plates was very smooth and their thickness was smaller than 100 nm (Fig. 4a and 4b). A detailed microstructure of FLS particles is shown in the inset of Fig. 4c. The selected area diffraction (SAD) patterns of as-grown FLS-particles exhibit diffraction rings confirming polycrystalline nature of the as-grown FLS particles. This is consistent with XRD patterns. Grain boundaries of nanoparticles are not observed even in a TEM micrograph with higher magnification (Fig. 3d). Fig. 5 shows SEM and TEM micrographs of the particles after thermal annealing. The morphology of Fe3O4 nanoparticles crystallized by N2 annealing is similar to that of as-grown FLS particles (Fig. 5a). This suggests that FLS particles maintain their unique shape during N2 treatment at 400 °C. TEM images of Fe3O4 (Fig. 5b and 5c) indicate that each petal-like plate of FLS particles is polycrystalline and porous. Appearance of pores in the petals of FLS particles is ascribed to the decomposition of iron alkoxide and α-FeOOH and the removal of residual organic species during annealing. The SAD patterns (the inset of Fig. 5b) clearly reveal polycrystalline nature. High magnification TEM micrograph in Fig. 5c shows that the individual petal consists of small nanoparticles with a size of 10∼15 nm. This value is in consistent with the particle size that is determined by analyzing XRD patterns via Debye-Scherrer equation. In comparison, Fe particles crystallized by N2+5%H2 annealing display a moderate change in the shape during the annealing process (Fig. 5d). Though the hierarchical superstructure was found and the pores were created, FLS particles partially collapsed and the petals warped more after N2+5%H2 annealing than N2 annealing.
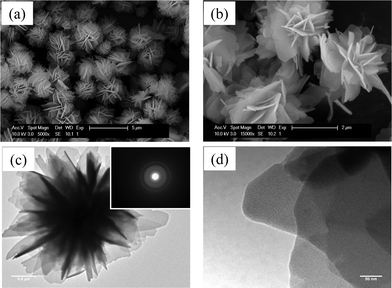 |
| | Fig. 4 SEM and TEM micrographs of as-grown FLS-precursor particles. (Inset: selected area diffraction (SAD) patterns.) | |
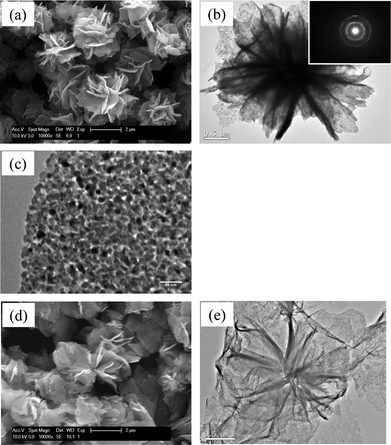 |
| | Fig. 5 SEM and TEM micrographs of (a), (b), (c) FLS–Fe3O4 and (d), (e) FLS–Fe particles. (Inset: selected area diffraction (SAD) patterns of FLS–Fe3O4 particles.) | |
Effects of reaction parameters on primary particles and self-assembly
The morphology of the superstructured particles is sensitive to experimental parameters such as reaction temperature, reaction time, reagent concentration, solvent types, and solution pH.66–68 In the present work, we systematically investigated the evolution of the hierarchical structures during the microwave-assisted reaction. There is an optimum range of reaction temperature and reaction pressure, which is suitable for the formation of hierarchically structured FLS-particles. Among the experimental variables, the reaction temperature is critical in the self-assembly of the nanoparticles. As shown in Fig. 6a, the reaction at 120 °C leads to irregular aggregates of nanoparticles. When the reaction temperature was increased to 150 °C (Fig. 6b), the nanoparticles assemble to form 3-dimensional (3-D) frameworks of nanoplates. However, the binding strength between the nanoplates is not strong enough to make the surface of the nanoplates smooth. The surface is rough and the individual nanoparticle are still identified. At the reaction temperature of 180 °C (Fig. 6c), the 3-D hierarchical architecture with a very smooth surface is achieved. However, further increase of the reaction temperature to 210 °C (Fig. 6d) results in random aggregates of nanoparticles with diameters of 90–100 nm. Self-assembly of the nanoparticles is not observed. This implies that the self-assembly process of the nanoparticles competes with the growth process of the nanoparticles and that there is an optimum window of the reaction temperature for the formation of 3-D FLS particles.
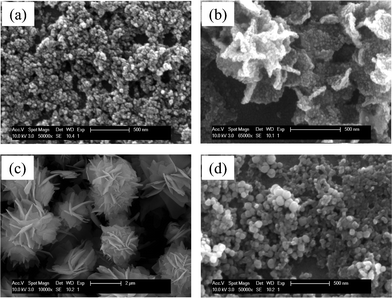 |
| | Fig. 6 SEM micrographs of the as-grown particles obtained at different reaction temperatures; (a) 120 °C, (b) 150 °C, (c) 180 °C, and (d) 210 °C. | |
The other parameter that was examined in this study is the reaction pressure. Since the precursors were reacted in a sealed Teflon vessel, the increase in the reaction temperature is accompanied by the increase in the reaction pressure. To separate the effect of the reaction temperature from that of the reaction pressure, the reaction temperature was fixed at 180 °C and only the reaction pressure was controlled by varying the volume of the precursor solution inside a sealed Teflon reactor. SEM micrographs in Fig. 7 show the change in the morphology of the reaction products as a function of the pressure. When the pressure in the reactor is below 0.2 MPa (Fig. 7a), well-structured hierarchical FLS particles were obtained. While, when the pressure was between 0.3 and 1 MPa (Fig. 7b), the petal-like plates consisting of the nanoparticles were observed. A part of the particles have the microstructure of stacked plates and a part of them show the 3-D FLS structure. When the pressure was higher than 1 MPa (Fig. 7c), the particles turned to large flakes. The change from the FLS structure to the flake structure is explained by the role of urea. In the EG-mediated reaction of FeCl3, HCl is produced as a byproduct.69 However, an increase in HCl concentration decreases pH and prohibits further conversion of FeCl3 to the iron alkoxide. This, in turn, decreases the yield of the EG-mediated reaction. To prevent the side effect of HCl, urea is added to the precursor solution as a neutralizing agent that is decomposed to provide counter ions, OH−. In the previous study, Chen et al. suggested that the decomposition of urea is sensitive to the pressure of a reaction solution.70
| | | CO(NH2)2 → NH4+ + CON− (T ≥ 80 °C) | (1) |
| | | CON− + 3H2O → NH4+ + 2OH− + CO2 | (2) |
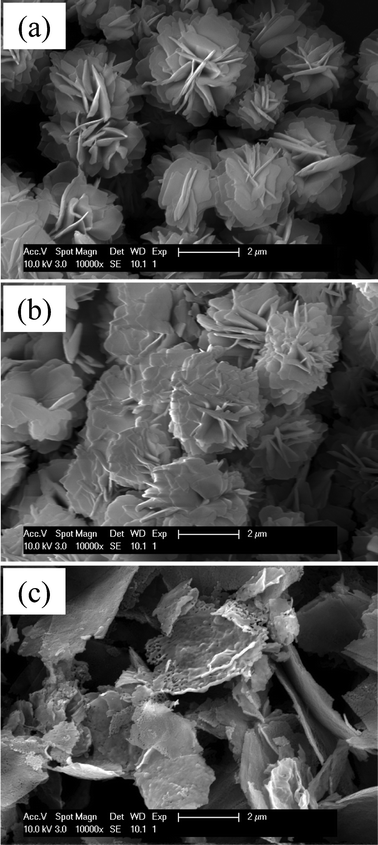 |
| | Fig. 7 Change in the morphology of the reaction products as a function of the pressure; (a) ∼0.2 MPa, (b) 0.3 ∼ 1 MPa, and (c) 1 MPa. | |
As described in eqn (1) and (2), the decomposition of urea releases CO2 gas as well as OH− ions. Therefore, the increase in the reaction pressure restricts the decomposition of urea by preventing the release of CO2 from the solution. The urea decomposition starts to be limited at the pressure of 0.5 MPa. When the reaction pressure reaches 0.9 MPa, only a small portion of urea is decomposed. This indicates that the conversion of FeCl3 to iron alkoxide is negligible at high pressure and the amount of primary nanoparticles from iron alkoxide is not large enough to develop the 3-D hierarchical superstructure. As a result, only 2-D flake type particles are produced in the high pressure environment.
Mechanism of the self-assembly of 3-D FLS particles
To understand the self-assembly process of 3-D FLS particles, the reaction process was monitored as a function of reaction time. As seen in Fig. 8a, the product at the early stage of the reaction, at 180 °C and below 0.2 MPa, was nanoparticles with a diameter of about 50 nm. A large amount of the nanoparticles was formed within 20 s in the precursor solution. After the microwave-assisted reaction continued for 1 min (Fig. 8b), a small portion of the nanoparticle gather to form microspheres with a diameter of 1-2 μm. The microspheres coexist with the nanoparticles. As the reaction proceeded (Fig. 8c), most of the nanoparticles is consumed to form the microspheres. Simultaneously, 3-D hierarchical structures started to appear. When the reaction time continued for 5 min, all nanoparticles turn to fully developed FLS particles, as shown in Fig. 8d. From this point, the morphology and size of FLS particles were maintained. It is worth noting that the growth of fully developed FLS particles under the microwave irradiation was completed within 5 min, which is much faster than conventional methods. This means that the ‘hot-spots’ effects induced by the microwave irradiation may create an environment suitable for the fast nucleation of nanoparticles and their accelerated growth to FLS-precursor particles.71
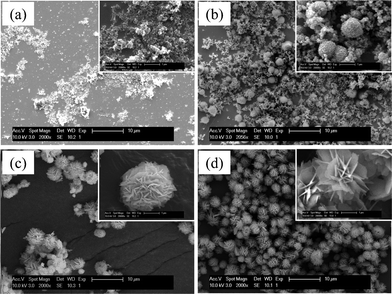 |
| | Fig. 8 SEM micrographs of as-grown particles as a function of reaction time; (a) 20 s, (b) 60 s, (c) 2 min, and (d) 5 min (a scale bar in the inset is 1 μm). | |
On the basis of experimental observations in the above, a three-step growth mechanism is proposed. This is composed of i) a fast nucleation of amorphous primary nanoparticles, ii) an aggregation of nanoparticles into the microspheres with rough surface, and iii) the self-assembly of thin plates onto the microspheres.72–74 Oriented assembly of the nanoparticles has been considered as a key step in producing the hierarchical superstructure.75 Various factors influence the oriented assembly of the nanoparticles, such as surface energy, electrostatic and dipolar fields, van der Waals forces, hydrophobic interactions, and hydrogen bonds. Given that the surfactants are not added to the precursor solution in this study, the surface energy is speculated to play a major role in the formation of FLS particles. Penn et al. and Li et al. propose that a main driving force to develop such hierarchical particles is a tendency to reduce the high surface energy via self-assembly of adjacent particles.76,77 In addition, the chelating ability of EG may contribute to the formation of FLS particles. Li et al. suggests that the generation of self-assembly of nanosheets is caused by the anchored polyol molecules. The strong chelating ability of the EG with iron ions makes it anchor to the surface and edges of nanosheets.78 This gives rise to edge-to-edge attachment and edge-to-surface conjunction among the nanoparticles, leading to the formation of hierarchical FLS superstructure.
Magnetic property of FLS oxide particles
Magnetization is one of the important parameters to evaluate the structure and property of Fe-based materials.79 To investigate the magnetic properties of the FLS–Fe3O4 and Fe particles, the magnetic properties of the particles were measured at room temperature using VSM. M–H curves are shown in Fig. 9. The saturation magnetization (Ms) of the FLS–Fe3O4 particles (Fig. 9a) was 45.0 emu g−1. The inset (a) of Fig. 9 shows that the coercivity (Hc) for the Fe3O4 was 23.6 Oe. The Ms value for FLS–Fe3O4 was lower than the value of bulk Fe3O4 (92 emu g−1). This is attributed to the non-stoichiometric defects in Fe3O4 which discontinue superexchange bonds among Fe cations.80 In contrast, Ms of FLS–Fe particles (Fig. 9b) was about 193.8 emu g−1, and the Hc value was about 23.6 Oe (Fig. 9, inset (b)). FLS-Fe particles had slightly lower Ms than bulk Fe (217.6 emu g−1). This small difference in saturated magnetizations between FLS–Fe particles and Fe bulk indicates that the shape anisotropy and the surface pinning do not have a significant impact on the magnetic properties of the petal-like plates in FLS particles
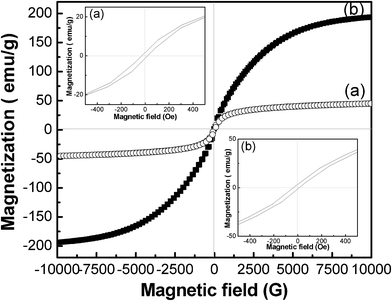 |
| | Fig. 9 Magnetic hysteresis loops of (a) FLS–Fe3O4 and (b) FLS–Fe particles. | |
Surface characteristics
Fig. 10 shows the nitrogen adsorption–desorption isotherms and corresponding pore size distribution of as-grown particles, Fe3O4 and Fe particles, respectively. The Brunauer–Emmett–Teller (BET) surface area of as-grown FLS particles (Fig. 10a) was 15.7 m2 g−1, while the FLS–Fe3O4 (Fig. 10b) and FLS–Fe (Fig. 10c) particles had specific surface areas of 71.1 m2 g−1 and 41.9 m2 g−1, respectively. The increased surface area of thermally-annealed FLS particles is attributed to the formation of internal pores. The adsorption and desorption isotherms of the as-grown particles in Fig. 10a are close to type II isotherms that do not show the hysteresis loop. Given that the type II isotherm is typical for non-porous or macroporous materials, the isotherms in Fig. 10a indicate that the as-grown FLS particles do not have mesopores.81 In contrast, the isotherms of thermally-annealed FLS particles (Fe3O4 and Fe) exhibit the hysteresis loops that result from different adsorption and desorption in the mesopores. The isotherm of FLS–Fe3O4 displays the features of H3 type hysteresis loops. This indicates that both slit-like mesopores and micropores are formed during the annealing. The coexistence of mesopores and micropores is confirmed in the pore size distribution curve, shown in the inset of Fig. 10b. Though the hysteresis loop is also observed, the isotherm curve of FLS–Fe particles is close to H4 type hysteresis loop in that the adsorption and desorption branches remain nearly horizontal over a wide range of p/po. This H4 type hysteresis loop shows that the phase transition to metallic Fe during the annealing in reducing environment develops the slit-like mesopores with a well-defined size and shape. The results of the BET analysis are consistent with TEM micrographs of Fig. 5, showing that the decomposition of iron alkoxide and α-FeOOH and the removal of organic species during the thermal annealing create mesopores in the FLS–Fe3O4 and FLS–Fe particles. The large surface area of thermally-annealed FLS particles suggests that these hierarchical structured particles would be utilized as efficient catalysts and absorbents.
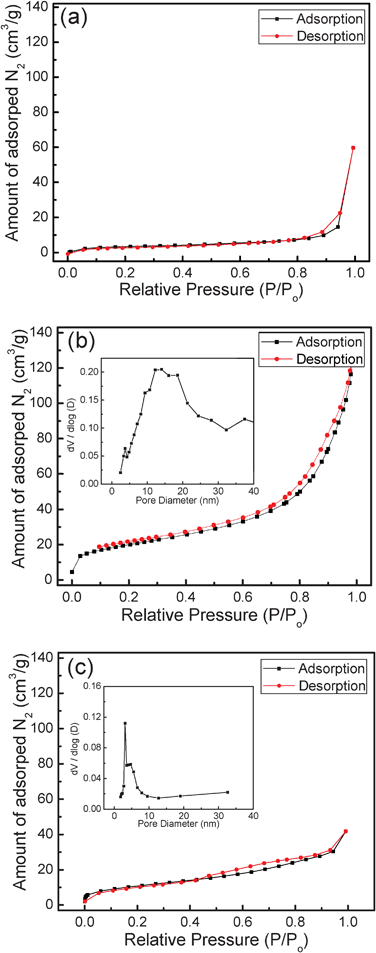 |
| | Fig. 10 Nitrogen adsorptioin–desorption isotherms and pore size distribution curves of (a) as-grown FLS-precursor, (b) FLS–Fe3O4, and (c) FLS–Fe particles. (Inset: pore size distribution curve.) | |
Application to water treatment
Hydrogen sulfide (H2S) has been reported as a malodorous toxic gas which could spread out through water.82 To remove H2S from water, several sorbents containing metal elements such as Fe, Zn, Ti, V, and Al, have been intensively explored.46,83–85 In this study, we tested the capability of FLS particles to remove H2S from water. To simulate H2S dissolved in water, Na2S was added to water. When sodium sulfide (Na2S) is exposed to moist environment, Na2S and its hydrates emit hydrogen sulfide. In the solution, as summarized in eqn (3), the dianion S2− does not exist in perceivable amounts in water since S2− is excessively strong base which may not be favorable for coexistence with water. Dissolution of Na2S in the water is expressed as follow:| | | Na2S(s) + H2O(l) → 2Na+ + HS− + OH− | (3) |
After FLS particles were added to the solution, the relative concentration of HS− in water was examined by measuring the electrical conductivity of the solution. Fig. 11 shows the concentration of sulfur ion as a function of reaction time. Both FLS–Fe3O4 and Fe removed most of the sulfur ions from the solution within 10 min. When the aqueous solution of 3000 ppm Na2S was reacted for 50 min, less than 2% of the sulfur ions were left in solution. It is known that the reaction between Fe and S gives FeS2 or Fe3S4, depending on their thermodynamic stability in the reaction conditions. Fast removal of H2S, shown in Fig. 11, indicates that the large surface areas of the FLS–Fe and FLS–Fe3O4 particles provide plenty of active sites for the sulfidation reaction. Almost similar HS− removal rates by FLS–Fe and FLS–Fe3O4 particles imply that the activation energy for the reaction with HS− may be lower for Fe than for Fe3O4 and that the different reaction kinetics may compensate for the difference in surface area.
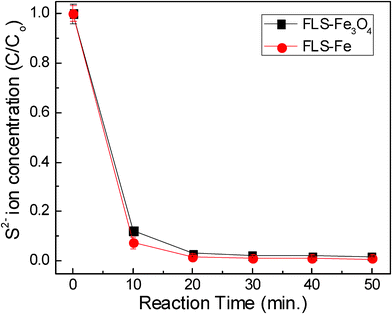 |
| | Fig. 11 Concentration of residual sulfur ions as a function of reaction time. | |
Conclusions
In this work, we have demonstrated the facile and fast synthesis of FLS–Fe3O4 and FLS–Fe particles. Hierarchical precursor particles have been successfully prepared by a microwave-assisted reaction of FeCl3·6H2O, TBAB, urea, and EG at 180 °C for 30 min. FLS particles with a hierarchical structure are formed through the self-assembly of iron alkoxide, α-Fe2O3 and FeOOH nanoparticles. The appearance of FLS particles is sensitive to reaction temperature and reaction pressure. Due to the competition between the self-assembly process and growth process of the nanoparticles, there is an optimum window of the reaction temperature for the formation of 3-D FLS particles. Also, the combined use of FeCl3, EG, and urea as raw materials makes the reaction of FLS particles strongly dependent on the pressure. Since urea is not decomposed well at high pressure (>1 MPa), FLS particles are synthesized at pressures lower than 1 MPa. The surface area of the as-grown FLS particles is 15.7 m2 g−1, while the FLS–Fe3O4 and FLS–Fe particles exhibit specific surface areas of 71.1 m2 g−1 and 41.9 m2 g−1, respectively. The decomposition of iron alkoxide, α-FeOOH and the removal of organic species during the thermal-annealing leaves micro- and mesopores in the FLS particles. Because of their high specific surface area, mesoporosity, and intrinsic reactivity, FLS–Fe3O4 and Fe particles exhibit an excellent ability to remove sulfur ions from aqueous solution. 0.1 g of both FLS–Fe3O4 and Fe remove most of the sulfur ions (∼ 90%) in 12.5 mM Na2S aqueous solution within 10 min. This suggests that the FLS particles are good absorbers of toxic H2S in aqueous solution.
Acknowledgements
This work was supported by National Science Foundation (grant no. DMR-0847319).
References
- X. Song and L. Gao, J. Phys. Chem. C, 2008, 112, 15299 CAS.
- X. Fu, H. Feng and K. Ng, Nanotechnology, 2009, 20, 375601 CrossRef.
- S. K. Mohapatra, S. E. John, S. Banerjee and M. Misra, Chem. Mater., 2009, 21, 3048 CrossRef CAS.
- S. Liu, R. Xing, F. Lu, R. Rana and J. Zhu, J. Phys. Chem. C, 2009, 113, 21042 CAS.
- S. Guo, L. Wang and E. Wang, Chem. Commun., 2007, 3163 RSC.
- B. Liu and H. C. Zeng, J. Am. Chem. Soc., 2004, 126, 8124 CrossRef CAS.
- B. B. Kale, J. O. Baeg, S. M. Lee, H. Chang, S. J. Moon and C. W. Lee, Adv. Funct. Mater., 2006, 16, 1349 CrossRef CAS.
- Y. Hou, H. Kongdoh and T. Ohta, Chem. Mater., 2005, 17, 3994 CrossRef CAS.
- L. S. Zhong, J. S. Hu, H. P. Liang, A. M. Cao, W. G. Song and L. J. Wan, Adv. Mater., 2006, 18, 2426 CrossRef CAS.
- X. M. Sun, J. F. Liu and Y. D. Li, Chem.–Eur. J., 2006, 12, 2036 Search PubMed.
- J. Zhang, S. Wang, M. Xu, Y. Wang, B. Zhu, S. Zhang, W. Huang and S. Wu, Cryst. Growth Des., 2009, 9, 3532 CAS.
- X. Yin, C. Li, M. Zhang, Q. Hao, S. Liu, Q. Li, L. Chen and T. Wang, Nanotechnology, 2009, 20, 455503 CrossRef.
- C. Li, L. Li, Z. Du, H. Yu, Y. Xiang, Y. Li, Y. Cai and T. Wang, Nanotechnology, 2008, 19, 35501 CrossRef.
- F. Zhang, H. Yang, X. Xie, L. Li, L. Zhang, J. Yu, H. Zhao and B. Liu, Sens. Actuators, B, 2009, 141, 381 CrossRef.
- F. Song, H. Su, J. Han, D. Zhang and Z. Chen, Nanotechnology, 2009, 20, 495502 CrossRef.
- L.-S. Zhong, J.-S. Hu, H.-P. Liang, A.-M. Cao, W.-G. Song and L.-J. Wan, Adv. Mater., 2006, 18, 2426 CrossRef CAS.
- M. Cao, T. Liu, S. Gao, G. Sun, X. Wu, C. Hu and Z. Wang, Angew. Chem., Int. Ed., 2005, 44, 4197 CrossRef CAS.
- J. Gu, S. Li, E. Wang, Q. Li, G. Sun, R. Xu and H. J. Zhang, J. Solid State Chem., 2009, 182, 1265 CrossRef CAS.
- G. Shen, Y. Bando, C. Tang and D. Golberg, J. Phys. Chem. B, 2006, 110, 7199 CrossRef CAS.
- Y. Huang, K. Yu and Z. Zhu, Curr. Appl. Phys., 2007, 7, 702 CrossRef.
- F. Zhou, X. Zhao, C. Yuan and L. Li, Cryst. Growth Des., 2008, 8, 723 CAS.
- S.-W. Cao, Y.-J. Zhu, M.-Y. Ma, L. Li and L. Zhang, J. Phys. Chem. C, 2008, 112, 1851 CAS.
- R. G. Deshmukh, S. S. Badadhe and I. S. Mulla, Mater. Res. Bull., 2009, 44, 1179 CrossRef CAS.
- X. Hu, J. C. Yu and J. Gong, J. Phys. Chem. C, 2007, 111, 11180 CAS.
- B. Hu, S. B. Wang, K. Wang, M. Zhang and S. H. Yu, J. Phys. Chem. C, 2008, 112, 11169 CAS.
- G. Xi, Y. He, Q. Zhang, H. Xiao, X. Wang and C. Wang, J. Phys. Chem. C, 2008, 112, 11645 CAS.
- L. Xu, Y.-S. Ding, C.-H. Chen, L. Zhao, C. Rimkus, R. Joesten and S. L. Suib, Chem. Mater., 2008, 20, 308 CrossRef CAS.
- A. L. Washington and G. F. Strouse, II, J. Am. Chem. Soc., 2008, 130, 8916 CrossRef CAS.
- X. Cao, C. Zhao, X. Lan, G. Gao, W. Qian and Y. Guo, J. Phys. Chem. C, 2007, 111, 6658 CAS.
- Z. Li, B. Tan, M. Allix, A. I. Cooper and M. J. Rosseinsky, Small, 2008, 4, 231 CrossRef CAS.
- F. Caruso, M. Spasova, A. Susha, M. Giersig and R. A. Caruso, Chem. Mater., 2001, 13, 109 CrossRef CAS.
- T. Hyeon, S. S. Lee, J. Park, Y. Chung and H. B. Na, J. Am. Chem. Soc., 2001, 123, 12798 CrossRef CAS.
- S. Yu and M. Yoshimur, Adv. Funct. Mater., 2002, 12, 9 CrossRef CAS.
- G. Zou, K. Xiong, C. Jiang, H. Li, T. Li, J. Du and Y. Qian, J. Phys. Chem. B, 2005, 109, 18356 CrossRef CAS.
- D. Yu, X. Sun, J. Zou, Z. Wang, F. Wang and K. Tang, J. Phys. Chem. B, 2006, 110, 21667 CrossRef CAS.
- Z. Sun, H. Yuan, Z. Liu, B. Han and Z. Zhang, Adv. Mater., 2005, 17, 2993 CrossRef CAS.
- D. Zhang, Z. Liu, S. Han, C. Li, B. Lei, M. P. Stewart, J. M. Tour and C. Zhou, Nano Lett., 2004, 4, 2151 CrossRef CAS.
- R. Abu-Reziq, H. Alper, D. Wang and M. L. Post, J. Am. Chem. Soc., 2006, 128, 5279 CrossRef CAS.
- G. Lv, F. He, X. Wang, F. Gao, G. Zhang, T. Wang, H. Jiang, C. Wu, D. Guo, X. Li, B. Chen and Z. Gu, Langmuir, 2008, 24, 2151 CrossRef CAS.
- Z. Liu, J. Wang, D. H. Xie and G. Chen, Small, 2008, 4, 462 CrossRef CAS.
-
A. L. Kohl and F. S. Riesenfeld, Gas Purification, Gulf Publishing Co., Houston, 4th edn, 1985, ch. 4, pp. 278–329 Search PubMed.
- B. G. Cox, P. F. Clarke and B. B. Pruden, Int. J. Hydrogen Energy, 1998, 23, 531 CrossRef CAS.
- L. M. Al-Shamma and S. A. Naman, Int. J. Hydrogen Energy, 1989, 14, 173 CrossRef CAS.
- F. Bandermann and K. -B. Harder, Int. J. Hydrogen Energy, 1982, 7, 471 CrossRef CAS.
- M. Yumura and E. Furimsky, Appl. Catal., 1985, 16, 157 CrossRef CAS.
- A. Davydov, K. T. Chuang and A. R. Sanger, J. Phys. Chem. B, 1998, 102, 4745 CrossRef CAS.
- J. Wieckowska, Catal. Today, 1995, 24, 405 CrossRef CAS.
- L. Zhang, S. Z. Qiao, Y. G. Jin, H. G. Yang, S. Budihartono, F. Stahr, Z. F. Yan, X. L. Wang, Z. P. Hao and G. Q. Lu, Adv. Funct. Mater., 2008, 18, 3203 CrossRef CAS.
- M. Mikhaylova, D. K. Kim, C. C. Berry, A. Zagorodni, M. Toprak, A. S. G. Curtis and M. Muhammed, Chem. Mater., 2004, 16, 2344 CrossRef CAS.
- T. J. Daou, G. Pourroy, S. Bégin-Colin, J. M. Grenéche, C. Ulhaq-Bouillet, P. Legaré, P. Bernhardt, C. Leuvrey and G. Rogez, Chem. Mater., 2006, 18, 4399 CrossRef CAS.
- Y. Lee, J. Lee, C. J. Bae, J.-G. Park, H.-J. Noh, J.-H. Park and T. Hyeon., Adv. Funct. Mater., 2005, 15, 503 CrossRef CAS.
- Z. B. Huang, Y. Q. Zhang and F. Q. Tang, Chem. Commun., 2005, 342 RSC.
- A. M. Cao, J. S. Hu, H. P. Liang and L. J. Wan, Angew. Chem., Int. Ed., 2005, 44, 4391 CrossRef CAS.
- Y. L. Wang, X. C. Jiang and Y. N. Xia, J. Am. Chem. Soc., 2003, 125, 16176 CrossRef CAS.
- X. C. Jiang, Y. L. Wang, T. Herricks and Y. N. Xia, J. Mater. Chem., 2004, 14, 695 RSC.
- N. Kijima, M. Yoshinaga, J. Awaka and J. Akimoto, Solid State Ionics, 2011, 192, 293 CrossRef CAS.
- T. Fan, D. Pan and H. Zhang, Ind. Eng. Chem. Res., 2011, 50, 9009 CrossRef CAS.
- V. M. Aroutiounian, V. M. Arakelyan, G. E. Shahnazaryan, H. R. Hovhannisyan and J. A. Turner, Sol. Energy, 2007, 81, 1369 CrossRef CAS.
- M. Zhu and G. Diao, J. Phys. Chem. C, 2011, 115, 18923 CAS.
- E. K. Nyutu, W. C. Conner, S. M. Auerbach, C. -H. Chen and S. L. Suib, J. Phys. Chem. C, 2008, 112, 1407 CAS.
- L. Chen, X. Yang, J. Chen, J. Liu, H. Wu, H. Zhan, C. Liang and M. Wu, Inorg. Chem., 2010, 49, 8411 CrossRef CAS.
- X. Su, C. Yu and C. Qiang, Appl. Surf. Sci., 2011, 257, 9014 CrossRef CAS.
- D. L. A. de Faria, S. Venâncio Silva and M. T. de Oliveira, J. Raman Spectrosc., 1997, 28, 873 CrossRef CAS.
- N. Pinna, S. Grancharov, P. Beato, P. Bonville, M. Antonietti and M. Niederberger, Chem. Mater., 2005, 17, 3044 CrossRef CAS.
- D. Larcher, G. Sudant, R. Patrice and J. M. Tarascon, Chem. Mater., 2003, 15, 3543 CrossRef CAS.
- D. Wang, T. Xie and Y. Li, Nano Res., 2009, 2, 30 CrossRef CAS.
- X. Hu and J. Yu, Adv. Funct. Mater., 2008, 18, 880 CrossRef CAS.
- M. Casula, Y. Jun, D. Zaziski, E. Chan, A. Corrias and A. Alivisatos, J. Am. Chem. Soc., 2006, 128, 1675 CrossRef CAS.
- G. Zhang and M. Liu, J. Mater. Sci., 1999, 34, 3213 CrossRef CAS.
- C. Chen, Z. Huang, W. Yuan, J. Li, X. Cheng and R. Chi, CrystEngComm, 2011, 13, 1632 RSC.
- Z. Ai, K. Deng, Q. Wan, L. Zhang and S. Lee, J. Phys. Chem. C, 2010, 114, 6237 CAS.
- Y. Cheng, Y. S. Wang, Y. H. Zheng and Y. Qin, J. Phys. Chem. B, 2005, 109, 11548 CrossRef CAS.
- R. L. Penn, J. Phys. Chem. B, 2004, 108, 12707 CrossRef CAS.
- J. Park, V. Privman and E. Matijevic, J. Phys. Chem. B, 2001, 105, 11630 CrossRef CAS.
- Y. Cheng, Y. Wang, D. Chen and F. Bao, J. Phys. Chem. B, 2005, 109, 794 CrossRef CAS.
- R. L. Penn and J. F. Banfield, Science, 1998, 281, 969 CrossRef CAS.
- M.-L. Li, Q.-Z. Yao, G.-T. Zhou, X.-F. Qu, C.-F. Mu and S.-Q. Fu, CrystEngComm, 2011, 13, 5936 RSC.
- M.-L. Li, Q.-Z. Yao, G.-T. Zhou and S.-Q. Fu, CrystEngComm, 2010, 12, 3138 RSC.
- G. Sun, B. Dong, M. Cao, B. Wei and C. Hu, Chem. Mater., 2011, 23, 1587 CAS.
- B. Jia and L. Gao, J. Phys. Chem. C, 2008, 112, 666 CAS.
- K. S. W. Sing, D. H. Everett, R. A. W. Haul, L. Moscou, R. A. Pierotti, J. Rouquerol and T. Siemieniewska, Pure Appl. Chem., 1985, 57, 603 CrossRef CAS.
- W. H. Tao and C. H. Tsai, Sens. Actuators, B, 2002, 81, 237 CrossRef.
- M. A. Sayyadnejad, H. R. Ghaffarian and M. Saeidi, Int. J. Environ. Sci. Tech., 2008, 5, 565 CAS.
- L. Li and D. L. King, Catal. Today, 2006, 116, 537 CrossRef CAS.
- M. M. Husein, L. Patruyo, P. Pereira-Almao and N. N. Nassar, J. Colloid Interface Sci., 2010, 342, 253 CrossRef CAS.
|
| This journal is © The Royal Society of Chemistry 2012 |
Click here to see how this site uses Cookies. View our privacy policy here. 


