Interactive metal ion–silicon oxidation/reduction processes on fumed silica†
J.
Wang
a,
B.
Mao
a,
M. G.
White
*b,
C.
Burda
a and
J. L.
Gole
c
aDepartment of Chemistry, Case Western Reserve University, Cleveland, OH, USA. E-mail: cxb77@case.edu; Tel: +1 216 368 5918
bEnergy Institute at Mississippi State University, 205 Research Boulevard, Starkville, MS, USA. E-mail: white@che.msstate.edu; Fax: +1 662 325 2482; Tel: +1 404 451 1233
cSchool of Physics, Georgia Institute of Technology, Atlanta, GA, USA. E-mail: James.Gole@physics.gatech.edu.; Fax: +1 404 894 9958; Tel: +1 404 894 4029
First published on 14th September 2012
Abstract
Fumed silica is shown to represent an active oxidation/reduction site. Arresting results demonstrate that the average oxidation state of silicon, at least at the surface of fumed silica, is +1 in contrast to the assumed value of +4, thus allowing the preparation of silica with desired reduced silicon surface oxidation states without post-synthesis treatment. The nature of this silica interface is demonstrated by preparing Fe/silica and Cu/silica materials with unprecedented control of the transition metal oxidation state. Supported iron or copper catalysts were prepared by contacting anhydrous iron(III) chloride, iron(III) nitrate nonahydrate, or hydrated copper(II) chloride with fumed, amorphous silica (CAB-O-SIL®) in dry methanol at room temperature. Subsequently, the solids were vacuum-dried (∼10−3 Torr) at room temperature for two hours. These solids, and in particular the iron-silica interface, were examined by X-ray photoelectron spectroscopy (XPS), Fourier transform infra-red (FTIR) spectroscopy, UV-vis diffuse reflectance spectroscopy (DRS), X-ray diffraction (XRD), transmission electron microscopy (TEM), colour analysis, and water contact angle analysis. No discernible evidence was found that indicated the formation of large crystallites of the transition metals. The products of iron(III) interaction at the interface with amorphous silica were also investigated using phenanthroline complexation to confirm the presence of Fe(II) ions. This body of data showed compelling evidence that a portion of the transition metal ions in contact with the fumed silica were reduced to lower oxidation states while some of the silicon ions were observed to be “oxidized” to higher oxidation states. The ratio of Fe(II) over Fe(III) found by XPS deconvolution for the chloride spectra matches well with theoretical prediction based upon a simple surface reaction between the Fe(III) ions and the lower valent Si ions. The Fe doping was deduced to be more likely at the axial position of the Si–O bond rather than the equatorial. It is remarkable that these observed transitions in the metal ion oxidation states occurred at room temperature. The inherent simplicity of this technique is general to many reducible metal oxides, and thus, its use in preparations may provide a new way of controlling the ratio of various oxidation states of metal elements.
Introduction
Recently, we reported on the surprising oxidation state of fumed silica and the nature of water binding to the silicon oxides and hydroxides.1 XPS data were used to suggest that the average oxidation state of silicon, at least at the surface of fumed silica, was +1 in contrast to the assumed value of +4, which has not been questioned for many years. These data suggested a less hydrophilic character for CAB-O-SIL® than the hydrated oxides of silicon in an average formal oxidation state of +3 or +4. This result was further supported by FTIR analysis and elemental analysis. Molecular electronic structure calculations,1 as they describe the binding of water to the silicon oxides and hydroxides, demonstrate the likelihood of a slow initial hydration of the +1 and +2 oxidation states of silicon followed by the more rapid formation of the +3 oxidation state. The nature of the +1 oxidation state and the nature of water binding to the +1 and +4 oxidation states can influence the observed isotherms for water uptake and can have important implications for oxidation/reduction processes and the expanded use of such silica-based materials2,3 in catalytic applications. Preliminary electron paramagnetic resonance (EPR) data on CAB-O-SIL® supported iron oxide systems suggested to us that some of the Fe(III) species might have been reduced to Fe(II) as a result of a redox couple with surface Si cations in the lower oxidation state. However, because the cross section for Fe(II) in EPR is diffusely distributed, it is not possible to definitively deduce the presence of Fe(II).4 If such surface redox processes do occur between Si and supported transition metal cations, then post synthesis treatments of supported mixed/metal oxide catalysts, such as reduction in hydrogen-rich gas, may be eliminated as a means to develop catalytically active/selective metal oxidation state(s). The results obtained in this study demonstrate that this process might be subverted as we prepare Fe/silica and Cu/silica materials having unprecedented control of the transition metal oxidation state. The existence of a +1 oxidation state1,5 on the surface of fumed silica therefore has potential important implications.In contrast to the silicon oxide surfaces which are described6 as resulting from different mixtures of Si(I) to Si(IV), we have obtained evidence for distinct Si(I) sites. The existence of the Si(I) sites thus implies the potential for an active oxidation/reduction chemistry at the surface of silica. In this study, we detail experiments to demonstrate that these lower oxidation states of silica undergo charge transfer with supported metal ions in an oxidation/reduction coupled reaction. We combine X-ray and valence band photoelectron (XPS, UPS) spectroscopy, DRS and FTIR spectroscopy, Colour Analysis, XRD, and TEM to provide convincing evidence to demonstrate that Fe(III) metal ions in contact with the Si(I) and Si(II) ions are reduced at room temperature to form the Fe(II) ion while the Si ions are oxidized to higher oxidation states. Further, we obtain similar results for the Cu(II)/Cu(I) couple. The significance of these results in catalytic processes is considered.
Experimental
CAB-O-SIL® powder was obtained from Aldrich (surface area: 390 ± 40 m2 g−1). The fumed silica in methanol was exposed in a vacuum hood to Fe(III) (FeCl3–Alfa Aesar anhydrous 98%, Fe(NO3)3 nonahydrate-Alfa Aeasar 98+%) and Cu(II) as the chloride (CuCl2 dihydrate-Alfa Aesar 99%). The Fe(III) nitrate nonahydrate was used separately from the chloride. The subsequent samples were then vacuum-dried at ∼10−3 Torr for two hours. It is these samples that have been characterized. Phenanthroline mono-hydrate (Alpha Aeasar 98%) was also used to characterize the Fe(III) samples.XPS data for the Fe(III)-(CAB-O-SIL®) and Cu(II)-(CAB-O-SIL®) were obtained using a PHI-VERSAPROBE XPS scanning microprobe, as a focused, highly monochromatic X-ray beam was used to scan the complex surfaces. XPS peak analysis was performed using both Origin 8.0 SR 4 V8.0951 (B951) (© 1991–2008, licensed to Case Western Reserve University) and XPSpeak41 (free version downloaded from http://www.uksaf.org/software.html). Spectra were collected under ultrahigh vacuum (5 × 10⁻⁸ Pa) without further cleaning steps7 since Ar–ion sputtering or high temperature ramping can cause undesirable changes including the reduction or oxidation of the sample as well as changes in the composition of the nanoparticles.8 The reported binding energies were calibrated with respect to the carbon 1s energy centred at 284.6 eV.
DRS spectra were determined by a Varian Cary Bio50 UV–vis spectrometer with a Barrelino remote diffuse reflection probe (reference material: MgO).
FTIR spectra were obtained using a Thermo Nexus 870 FTIR spectrometer with an attenuated total reflection (ATR) accessory.
XRD analysis of the prepared samples was performed on a Scintag X−1 Advanced X-ray powder diffractometer (XRD, 2°/min, Cu-Kα radiation) using a nickel filter.
TEM analysis was performed using a transmission electron microscope (JEOL 1200CX) with an accelerating voltage of 80 kV.
Results
Interaction of Fe(III) with fumed silica—X-ray photoelectron data
Fig. 1 depicts the treated Fe(III)-(CAB-O-SIL®) samples after vacuum drying. Here the anhydrous FeCl3 is seen as a dark black powder and the Fe–Cab samples are shown in various ratios by weight from 1![[thin space (1/6-em)]](https://www.rsc.org/images/entities/char_2009.gif) :
:![[thin space (1/6-em)]](https://www.rsc.org/images/entities/char_2009.gif) 1 to 1
1 to 1![[thin space (1/6-em)]](https://www.rsc.org/images/entities/char_2009.gif) :
:![[thin space (1/6-em)]](https://www.rsc.org/images/entities/char_2009.gif) 4. It is these samples that we have characterized by XPS.
4. It is these samples that we have characterized by XPS.
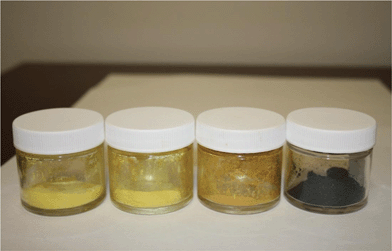 | ||
Fig. 1 From right to left, anhydrous FeCl3 (black), 1![[thin space (1/6-em)]](https://www.rsc.org/images/entities/char_2009.gif) : :![[thin space (1/6-em)]](https://www.rsc.org/images/entities/char_2009.gif) 1, 1 1, 1![[thin space (1/6-em)]](https://www.rsc.org/images/entities/char_2009.gif) : :![[thin space (1/6-em)]](https://www.rsc.org/images/entities/char_2009.gif) 3, and 1 3, and 1![[thin space (1/6-em)]](https://www.rsc.org/images/entities/char_2009.gif) : :![[thin space (1/6-em)]](https://www.rsc.org/images/entities/char_2009.gif) 4 by weight FeCl3 on CAB-O-SIL®. The samples change in colour from light orange to bright yellow. 4 by weight FeCl3 on CAB-O-SIL®. The samples change in colour from light orange to bright yellow. | ||
Fig. S1 (ESI†) depicts the full XPS spectra for the three Fe–Cab samples studied. The existence of Fe, Cl, and Si is apparent in the spectra. However, in order to understand better the interrelationship between the Fe(III) deposition and its transformation on the fumed silica surface which acts as a support for this metal ion, higher resolution XPS spectra are necessary.
These higher resolution spectra provide more detailed information on the chemical environment of the metal ion. Fig. 2 depicts the XPS spectra obtained for the Fe 3p transition. It is well known that a stronger band for Fe lies in the 2p region; however, for quantitative analysis of the Fe(II)/Fe(III) ratio the satellite peaks in the Fe 2p region add considerable complexity to the analysis. Although weaker than Fe 2p, the Fe 3p region has been used to quantitatively analyse the Fe(II)/Fe(III) ratios in the pioneering work of Mekki et al.9 and the validity of this approach has been further investigated by Yamashita et al.10–12 and Paparazzo.13 A detailed set of fitting parameters has been given to achieve the best fit by the Yamashita group.10–12 Mekki et al.9 and Yamashita et al.10–12 identified a peak at ∼54 eV to be Fe(II) and a peak at ∼56 eV to be Fe(III). Fig. 3 demonstrates the similar positions for which we have obtained XPS spectra for Fe(II) and Fe(III) in FeCl2 and FeCl3 controls.
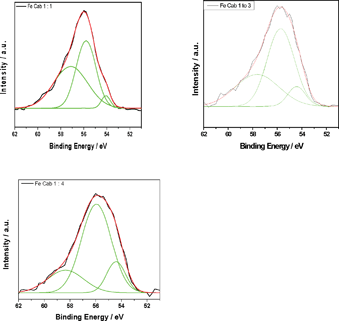 | ||
| Fig. 2 De-convoluted Fe 3p XPS spectra for Fe-CAB-O-SIL® samples with various Fe to Cab ratios. | ||
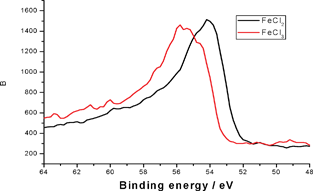 | ||
| Fig. 3 Fe 3p XPS spectra for FeCl2 and FeCl3 | ||
Table 1 lists the de-convoluted peaks used to fit the Fe 3p XPS spectra for the Fe/CAB-O-SIL® samples given in Fig. 2 for various Fe to Cab ratios. We find that the larger the ratio of fumed silica in the sample, the larger the percentage of Fe(II) in the sample. This indicates that CAB-O-SIL® is reducing the Fe(III). This reducing property of silicon is consistent with our earlier work on the oxidation states of Si in CAB-O-SIL®5 and with our recent theoretical calculations.1
| Sample | Temp. assignment | Area (%) | Centre/eV | Width/eV | Height/a.u. |
|---|---|---|---|---|---|
| a X indicates the shoulder that corresponds to the tail caused by electron exchange interaction effects and electron correlation effects.14n = 3 and standard deviation <5%” for the % Fe analysis. | |||||
| Fe Cab 1 to 1 | Xa | 49.4 | 57.1 | 2.9 | 116.9 |
| Fe(III) | 46.7 | 55.8 | 1.7 | 189.6 | |
| Fe(II) | 3.9 | 54.1 | 0.8 | 35.6 | |
| Fe Cab 1 to 3 | X | 36.1 | 57.6 | 3.6 | 75.5 |
| Fe(III) | 54.8 | 55.7 | 2.2 | 183.6 | |
| Fe(II) | 9.1 | 54.4 | 1.4 | 47.1 | |
| Fe Cab 1 to 4 | X | 20.2 | 58.3 | 2.8 | 40.5 |
| Fe(III) | 65.3 | 55.9 | 2.3 | 159.3 | |
| Fe(II) | 14.4 | 54.4 | 1.5 | 56.1 | |
Table 2 shows the Si 2p XPS peak positions for the Fe-CAB-O-SIL® samples. After the incorporation of FeCl3, the silicon 2p XPS binding energy shifts toward higher binding energy (BE) significantly for all three samples, which implies the occurrence of Si oxidation. There is a weak trend to a decreasing value of the binding energy when the relative amount of CAB-O-SIL® in the sample increases. This seems reasonable as the more CAB-O-SIL® in the sample, on average, the less oxidation will occur on average at silicon.
The fit of the experimental data given in Fig. 2 suggests a third feature at ∼58 eV. It was to understand better the origin of this higher binding energy component that the XPS spectra for FeCl2 and FeCl3 (Fig. 3) were taken. Interestingly, both FeCl3 and FeCl2 show a similar broad feature in the same 58 eV region, although there is a clear difference in the position of the major peaks for FeCl3 and FeCl2. To determine whether this feature arises from the chloride or iron ions, we tested the Fe 3p XPS of FeSO4 and found the same shoulder at ∼58 eV. Because no chloride peaks have been reported at 58 eV, it is unlikely that this ion is responsible for the 58 eV feature. To rule out an artefact associated with CAB-O-SIL® itself, we analysed the same region to obtain the spectrum shown in Fig. 4. There appears to be no peak at ∼58 eV. Therefore, we conclude that the feature indicated at ∼58 eV does come from iron. Here, we must ask whether this is a real shoulder or simply an artefact of the fitting procedure in concert with the asymmetrical tail, intrinsic to many of the first row transitional metals. Paparazzo13 has carefully noted, in discussing the studies of Yamashita et al.,10,11 that the XPS 2p and 3p spectra of the 1st row transitional metal paramagnetic ions all possess a complex line shape that originates from both electron exchange interaction effects and electron correlation effects. Electron exchange interaction effects are responsible for the so-called “multiplet splitting” states; whereas, electron correlation effects produce “shake-up” and/or “shake-off” states. As a result, the XPS spectra always contain a broad leading signal that is usually accompanied by an asymmetric tail to the higher BE side of the peak region. This may include some high-BE satellite signals as well. This is corroborated by the Co 2p XPS spectra shown in Fig. 5. Furthermore, if we translate the Fe 3p XPS spectrum of FeCl2 so that it overlaps with that of FeCl3, we find that the high binding energy tails of these two are almost identical, suggesting that it is less likely that these features emanate from a specific chemical environment of iron.
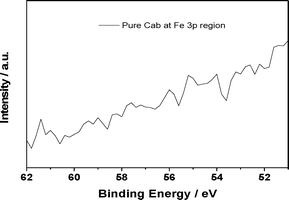 | ||
| Fig. 4 High resolution XPS of CAB-O-SIL® at 50–62 eV. | ||
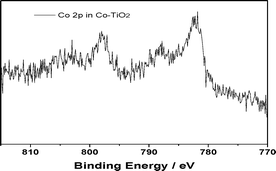 | ||
| Fig. 5 XPS spectra of Co 2p in a Co–TiO2 sample. | ||
With these considerations, we suggest that the higher binding energy feature at ∼58 eV results from an asymmetrical tail. That being said, we focus on the remaining two de-convoluted peaks. The lower BE corresponds to the lower oxidation states. As there are only two major oxidation states for iron ions, namely Fe(II) and Fe(III), it is reasonable, especially in conjunction with Fig. 3, to ascribe the lower BE de-convoluted peak as Fe(II) and the higher BE de-convoluted peak as Fe(III). The peak positions correspond well to the database values.14
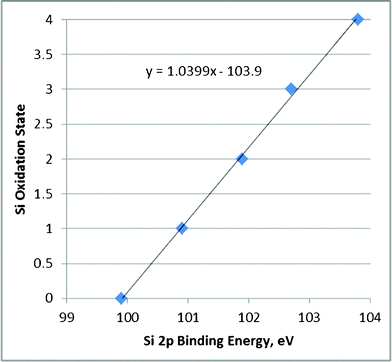
Table 2 reports the Si 2p binding energies for these three Fe–Cab samples. The sample most rich in silica shows the lowest BE (102.8 eV); whereas, the sample richest in Fe shows the highest BE (103.2 eV). A silica sample having no Fe was reported to show a binding energy of 100.3 eV. These data suggest that the Fe influences the Si 2p BEs. To understand better these results, one may use literature XPS data of non-equilibrium silica that show Si oxidations states of 0 to 4 (Fig. 6 , Ref. 7 and citations therein). These data may be correlated to show the relationship between the observed Si 2p BE and the Si oxidation state. This correlation shows that the Fe–Cab 1![[thin space (1/6-em)]](https://www.rsc.org/images/entities/char_2009.gif) :
:![[thin space (1/6-em)]](https://www.rsc.org/images/entities/char_2009.gif) 4 sample demonstrates a Si oxidation state of near 3; whereas, the Fe–Cab 1
4 sample demonstrates a Si oxidation state of near 3; whereas, the Fe–Cab 1![[thin space (1/6-em)]](https://www.rsc.org/images/entities/char_2009.gif) :
:![[thin space (1/6-em)]](https://www.rsc.org/images/entities/char_2009.gif) 1 samples shows a Si oxidation state of 3.4. The Fe–Cab 1
1 samples shows a Si oxidation state of 3.4. The Fe–Cab 1![[thin space (1/6-em)]](https://www.rsc.org/images/entities/char_2009.gif) :
:![[thin space (1/6-em)]](https://www.rsc.org/images/entities/char_2009.gif) 3 sample shows an average oxidation state of 3.2. The undecorated CAB-O-SIL® shows an average Si oxidation state near 1. Thus, one may interpret the Si XPS data to show that the Fe(III) ions interact with the Si lower valent ions to undergo redox so that Fe(II) ions are produced as the Si ions are oxidized. When silica is in great excess, the average oxidation of the Si is lower (∼3) compared to a value of 3.4 when equal amounts of Fe and Si were present initially.
3 sample shows an average oxidation state of 3.2. The undecorated CAB-O-SIL® shows an average Si oxidation state near 1. Thus, one may interpret the Si XPS data to show that the Fe(III) ions interact with the Si lower valent ions to undergo redox so that Fe(II) ions are produced as the Si ions are oxidized. When silica is in great excess, the average oxidation of the Si is lower (∼3) compared to a value of 3.4 when equal amounts of Fe and Si were present initially.
Surface reaction model
A simple model was proposed to simulate the interaction between the iron species and the CAB-O-SIL® surface. The MeOH source solution of FeCl3 can be assumed to show a variety of Fe(III) species: Fe(III)Cl3·nH2O; Fe(III)(OH)mCl3−m·nH2O, m = 1–3; Fe(III)O(OH)mCl1−m·nH2O, m = 0–1. The CAB-O-SIL® shows Si species terminated by silanol groups, hydrated silanol groups, siloxane bridging oxygens, and hydrated siloxane bridging oxygens. We have proposed a diverse distribution of Si ion oxidation states to include zero-valent Si up to tetravalent Si.1This model may be used to estimate the fraction of the total iron ions that come in contact with the CAB-O-SIL® surface. The model assumes that the Fe(III) species becomes associated with surface silanols (Si–OH) to form the surface bound Fe species: [Fe(III)(HO–Si)3]. The number of surface bound Fe species is just 1/3 of the number of surface silanols in the CAB-O-SIL® by assuming a value of 1.3 OH per nm2 for the silanol density. The assumed silanol density of 1.3 OH/nm2 is less than the customary number15 of 2–4 OH/nm2 since a dry MeOH solvent is used and we expect this solvent to reduce the silanol density found on the CAB-O-SIL®. Next, we assume that each of these surface Fe ion species is reduced from 3+ to 2+ by this surface interaction between the Fe and Si species. We assume that only those Fe species bound to the Si–OH groups will undergo redox. This calculation will then estimate the amount of Fe(II) as a lower bound. If this assumption is not true and the second layer of Fe(III) may also participate in the redox, then the actual number of Fe(III) reduced may be greater than the estimates given by this procedure. We have no way of knowing, a priori, how many layers of Fe species will engage in this redox behaviour. As an example of this calculation, consider the 1/1 sample having a mass of 1 gram which shows 0.5 g of FeCl3 and 0.5 g of SiO2. The number of moles of Fe ions is 3.083 mmol; whereas the number of moles of SiO2 is 8.33 mmol. The number of surface SiOH sites is (0.5 g × 390 m2 g−1 × 1.3 OH per nm2) = 2.6 × 10²⁰ OH groups and the number of surface Fe species initially sequestered is 1/3 of this number or 8.6 × 10¹⁹ surface Fe species. Now, if these surface Si species are +3 or less, then all of these Fe species can be reduced from +3 to +2. Thus, the number of Fe(II) ions is 8.6 × 10¹⁹. The fraction of total Fe species in the +2 state is 0.86 × 10²⁰/1.86 × 1021 = 4.6%. The observed fraction of Fe in the +2 state is 9.7%. The estimated fraction of reduced Fe is ∼1/2 that found by XPS. This discrepancy between predicted and observed results could be resolved if more than one layer of Fe(III) ions engaged in redox reactions with the surface Si cations of valency <+4.
This model was used to estimate the fraction of Fe(II) in the remaining two Fe–Cab samples (Table 3). The predicted Fe(II) amounts calculated for the other two samples show close agreement with the observed Fe(II) determined from XPS measurements. This simple model suggests that the Fe ions in contact with the surface Si species are capable of undergoing redox to produce the observed divalent Fe species.
| Model predictions | Observed from XPS | |||
|---|---|---|---|---|
| SiO2/FeCl3 mass ratio | % Fe(II) | % Fe(III) | % Fe(II) | % Fe(III) |
| 1 | 4.6% | 95% | 9.7% | 92.3% |
| 3 | 13.9% | 86% | 14.2% | 86% |
| 4 | 18.6% | 81% | 18.1% | 82% |
One can also use these same data to make a crude estimate of the FeOx overlayer size. The inverse of the fraction Fe(II) in the sample is about equal to the number of Fe(III)Ox overlayers. For the SiO2/FeCl3 1/1 sample, this number is 22 layers and if the Fe–O distance is 0.2 nm, this suggests a layer thickness of 4.4 nm. The estimated thicknesses of this overlayer in the other samples are smaller: 1.4 nm and 1.1 nm for the SiO2/FeCl3 1/3 and 1/4 samples, respectively. While this calculation is crude, it is helpful for the interpretation of the TEM and XRD data to be discussed later.
Complexation with 1,10-Phenanthroline
1,10-Phenanthroline is known to bind selectively to Fe(II), forming a red complex.16 In contrast, Fe(III), which is usually brown in colour, does not complex with phenanthroline. Fig. 7 shows the results of an experiment where both Fe2O3 [Fe(III)] and the product of introducing Fe(III) to fumed silica are exposed to 1,10-phenanthroline under toluene. Fig. 8 displays the corresponding DRS spectra which shows the manifestation of the complex of phenanthroline and Fe(II) through the 530 nm absorbance peak, which demonstrates the reduction of the Fe(III) originally placed on the surface of the CAB-O-SIL® sample. Fig. 9 demonstrates similar results obtained when CAB-O-SIL® is treated with Fe(NO3)3 nonahydrate and the product is exposed to 1,10-phenanthroline.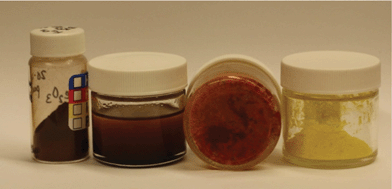 | ||
Fig. 7 Right to left, comparison of bright yellow sample of Fe-CAB-O-SIL 1![[thin space (1/6-em)]](https://www.rsc.org/images/entities/char_2009.gif) : :![[thin space (1/6-em)]](https://www.rsc.org/images/entities/char_2009.gif) 4 (Fe from FeCl3), Fe-CAB-O-SIL® 1 4 (Fe from FeCl3), Fe-CAB-O-SIL® 1![[thin space (1/6-em)]](https://www.rsc.org/images/entities/char_2009.gif) : :![[thin space (1/6-em)]](https://www.rsc.org/images/entities/char_2009.gif) 4 complexed with 1,10-phenanthroline, Fe2O3 over 1,10-phenanthroline under toluene, and powdered Fe2O3. 4 complexed with 1,10-phenanthroline, Fe2O3 over 1,10-phenanthroline under toluene, and powdered Fe2O3. | ||
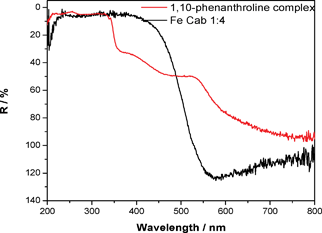 | ||
| Fig. 8 UV-vis diffuse reflectance spectra for Fe-CAB-O-SIL® (black) and the complex of 1,10 phenanthroline with Fe-CAB-O-SIL® (red). | ||
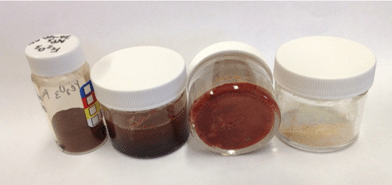 | ||
Fig. 9 Right to left, comparison of off-white sample of Fe-CAB-O-SIL® 1![[thin space (1/6-em)]](https://www.rsc.org/images/entities/char_2009.gif) : :![[thin space (1/6-em)]](https://www.rsc.org/images/entities/char_2009.gif) 4 (Fe from Fe(NO3)3-nonahydrate), Fe-CAB-O-SIL® 1 4 (Fe from Fe(NO3)3-nonahydrate), Fe-CAB-O-SIL® 1![[thin space (1/6-em)]](https://www.rsc.org/images/entities/char_2009.gif) : :![[thin space (1/6-em)]](https://www.rsc.org/images/entities/char_2009.gif) 4 complexed with 1,10-phenanthroline, Fe2O3 over 1,10-phenanthroline under toluene, and powdered Fe2O3. 4 complexed with 1,10-phenanthroline, Fe2O3 over 1,10-phenanthroline under toluene, and powdered Fe2O3. | ||
The treated sample again shows the manifestation of the complex of 1,10-phenanthroline and Fe(II), demonstrating the reduction of the Fe(III) originally placed on the surface of the CAB-O- SIL® sample. It is important to note that we have observed this transformation when the CAB-O-SIL® is exposed to a nitrate. The nitrate anion, which is an oxidizing anion, does not change the process of redox between the Si surface and the deposited Fe ions. Further, while we were concerned with using a nonahydrate in this study and it is this nonahydrate that is brought in contact with the silicon sites on the CAB-O-SIL® surface, we again observe strong evidence for the Fe(III) to Fe(II) transformation. This is consistent with a charge transfer process that is notably more facile than the hydration of the CAB-O-SIL® surface in the presence of the nonahydrate.
FTIR Spectroscopy
Fig. 10 shows the FTIR of the CAB-O-SIL® and the Fe-CAB-O-SIL® series samples. The broad peak around 3000–3600 cm−1 together with the peak at about 1610 cm−1 corresponds to surface adsorbed water.17 At first glance, this would seem to suggest that the surface of the CAB-O-SIL® is somewhat hydrophobic or at least that the surface of the iron doped CAB-O-SIL® sample has become more hydrophilic. However, a simple test of water contact angle,18 the result of which is shown in the Supplementary Information, Fig. S2,† indicates that the surface of CAB-O-SIL® is actually hydrophilic. However, it is to be noted that the +1 and +2 silicon sub-oxides pick up water and form surface hydroxyl groups at a considerably slower rate than does the surface consisting primarily of +3 and +4 oxidation states.1 Thus, the weak IR absorption band for water, especially for the untreated CAB-O-SIL® sample, is not surprising. However, the seeming contradiction between the IR data and the water contact angle experiments suggests the need for a closer examination of the IR data. In comparison with our previous results,1 although the shapes of the IR peaks are quite similar, there is a shift in the position of the Si–O stretching peak from 1105 cm−1 in the previous work to 1074 cm−1 in the current study. By contrast, there is only a very small shift observed for the Si–O–Si bending peak, which is located at 812 cm−1 in our previous report1 and at 810 cm−1 in the current study. It is noteworthy that there is a sequential change in the frequency of the IR peaks with increasing iron concentration. As shown in Table 4, the Si–O–Si bending peak decreases in frequency from 810 cm−1 to 796 cm−1 whereas the Si–O stretching mode decreases from 1074 cm−1 to 1049 cm−1. The introduction of iron onto SiO2 results in a stronger perturbation of the Si–O stretching mode than it does on the Si–O–Si bending mode. This is consistent with a significant interaction with the silicon site. Up to a monolayer coverage, the more iron there is in the system, the stronger is its influence.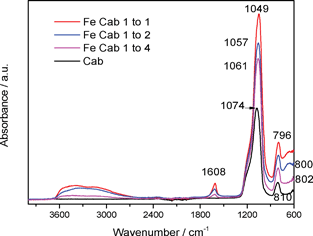 | ||
| Fig. 10 FTIR of CAB-O-SIL® and the Fe-CAB-O-SIL® series samples. Top to bottom: Fe Cab 1 to 1; Fe Cab 1 to 3; Fe Cab 1 to 4; CAB-O-Sil®. | ||
| Sample | Si–O–Si bending/cm−1 | Difference/cm−1 | Si–O stretching/cm−1 | Difference/cm−1 |
|---|---|---|---|---|
| CAB-O-SIL® | 810 | 8 | 1074 | 13 |
| Fe Cab 1 to 4 | 802 | 1061 | ||
| 2 | 4 | |||
| Fe Cab 1 to 3 | 800 | 1057 | ||
| 4 | 8 | |||
| Fe Cab 1 to 1 | 796 | 1049 |
XRD Analysis
Fig. 11 depicts the XRD patterns of the CAB-O-SIL® and Fe-CAB-O-SIL® samples. Apart from broad half peak from 20° to 50°, which is stipulated to be characteristic of amorphous silicon oxides, there are no visible peaks in the entire 20° to 70° range. For silica samples containing more than 5 atom% of a transition metal, the crystals having a characteristic dimension of >5 nm should be visible in the XRD. The present samples contain >10 atom% Fe and from a consideration of the estimate of the Fe overlayer thickness of <5 nm, we would not expect to see any XRD peaks from the Fe species. The present results shown in Fig. 11 may exclude the possibility of the existence of any large crystallites of silicon oxide or iron oxide, at least at the surface of the fumed silica. In addition, the intensity of the broad half peak for the pure CAB-O-SIL® sample is stronger than those for the Fe-CAB-O-SIL® samples.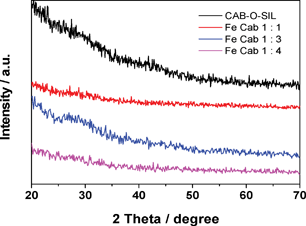 | ||
| Fig. 11 XRD patterns of CAB-O-SIL® and the Fe-CAB-O-SIL® series samples. | ||
TEM Analysis
Fig. 12 catalogues TEM images of the CAB-O-SIL® and Fe–Cab samples. The average sizes observed for particles are determined to be 12.8 ± 3.3, 13.8 ± 2.5, 12.9 ± 3.3, and 13.8 ± 3.6 nm for pure CAB-O-SIL®, Fe Cab 1 to 1, Fe Cab 1 to 3, and Fe Cab 1 to 4, respectively. These determinations were made by measuring randomly 10–15 selected particles within each image. It is reasonable to conclude that there is no major change in the particle sizes after the introduction of Fe into the CAB-O-SIL® system.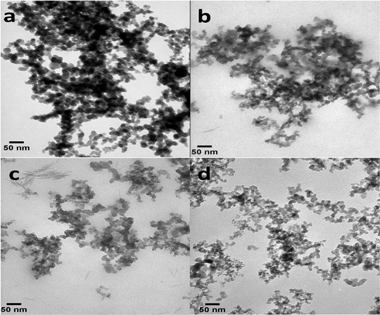 | ||
Fig. 12 TEM images of (a) pure CAB-O-SIL®, (b) Fe/Cab 1![[thin space (1/6-em)]](https://www.rsc.org/images/entities/char_2009.gif) : :![[thin space (1/6-em)]](https://www.rsc.org/images/entities/char_2009.gif) 1, (c) Fe/Cab 1 1, (c) Fe/Cab 1![[thin space (1/6-em)]](https://www.rsc.org/images/entities/char_2009.gif) : :![[thin space (1/6-em)]](https://www.rsc.org/images/entities/char_2009.gif) 3, and (d) Fe/Cab 1 3, and (d) Fe/Cab 1![[thin space (1/6-em)]](https://www.rsc.org/images/entities/char_2009.gif) : :![[thin space (1/6-em)]](https://www.rsc.org/images/entities/char_2009.gif) 4. 4. | ||
One might expect to see, in the TEM image, the presence of higher-contrast, regular-shaped structures among the spherical shaped silica particles, if the Fe crystallites were >5 nm. The appearance of the particles composing the TEM images is dominantly irregular spheres or spheroids. We conclude that no Fe crystallites are present in these samples having dimensions >5 nm. This conclusion is consistent with the XRD results and the model predictions.
Interaction of Cu(II) with fumed silica-X-ray photoelectron data
Fig. 13 depicts treated Cu(II)-(CAB-O-SIL)® samples after vacuum drying. Here CuCl2 is seen as an aqua powder and the Cu–Cab samples are shown in various ratios by weight from 1![[thin space (1/6-em)]](https://www.rsc.org/images/entities/char_2009.gif) :
:![[thin space (1/6-em)]](https://www.rsc.org/images/entities/char_2009.gif) 1 to 1
1 to 1![[thin space (1/6-em)]](https://www.rsc.org/images/entities/char_2009.gif) :
:![[thin space (1/6-em)]](https://www.rsc.org/images/entities/char_2009.gif) 4. These samples have also been characterized by XPS. Fig. S3† and Fig. 14 indicate the recorded XPS spectra.
4. These samples have also been characterized by XPS. Fig. S3† and Fig. 14 indicate the recorded XPS spectra.
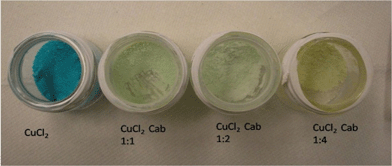 | ||
Fig. 13 From left to right, CuCl2(aqua), 1![[thin space (1/6-em)]](https://www.rsc.org/images/entities/char_2009.gif) : :![[thin space (1/6-em)]](https://www.rsc.org/images/entities/char_2009.gif) 1, 1 1, 1![[thin space (1/6-em)]](https://www.rsc.org/images/entities/char_2009.gif) : :![[thin space (1/6-em)]](https://www.rsc.org/images/entities/char_2009.gif) 3, and 1 3, and 1![[thin space (1/6-em)]](https://www.rsc.org/images/entities/char_2009.gif) : :![[thin space (1/6-em)]](https://www.rsc.org/images/entities/char_2009.gif) 4 by weight CuCl2 on CAB-O-SIL®. 4 by weight CuCl2 on CAB-O-SIL®. | ||
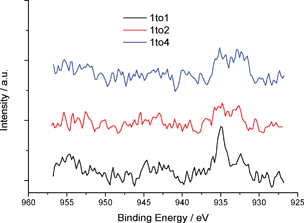 | ||
| Fig. 14 Cu 2p high resolution XPS spectra showing features attributed to Cu(II) and Cu(I,0). | ||
In contrast to the iron system, the recorded Cu XPS spectra are quite weak. However, by comparing the data obtained for the 1![[thin space (1/6-em)]](https://www.rsc.org/images/entities/char_2009.gif) :
:![[thin space (1/6-em)]](https://www.rsc.org/images/entities/char_2009.gif) 1 and 1
1 and 1![[thin space (1/6-em)]](https://www.rsc.org/images/entities/char_2009.gif) :
:![[thin space (1/6-em)]](https://www.rsc.org/images/entities/char_2009.gif) 4 samples it is possible to discern a change from Cu(II) at 934.7 eV to Cu(I or 0) at 932.3 eV.19 Attempts to characterize these solids by Auger Electron spectroscopy, not shown, were unsuccessful in that the signal/noise ratio was low. Thus, we were unable to characterize the relative amounts of Cu(I) and Cu(0) in these solids. This system will be the subject of further investigation.
4 samples it is possible to discern a change from Cu(II) at 934.7 eV to Cu(I or 0) at 932.3 eV.19 Attempts to characterize these solids by Auger Electron spectroscopy, not shown, were unsuccessful in that the signal/noise ratio was low. Thus, we were unable to characterize the relative amounts of Cu(I) and Cu(0) in these solids. This system will be the subject of further investigation.
Conclusions
We have investigated the changing properties of CAB-O-SIL® before and after it is doped with Fe(III) and Cu(II) metal ions. The size of the particles composing both the original sample and the iron-treated CAB-O-SIL® is determined to be ∼13 nm based on the TEM results. There is no obvious change in particle size after doping which suggests that the transition metal oxide crystallites are <5 nm. The valence state of Si in fumed silica, originally found to be +1, was found to change from +1 to +3 to +4 as evidenced by XPS results. In concert with the change in the deposited iron oxidation state from +3 to +2, we are led to the conclusion that the surprising oxidation state of Si(I) indeed exhibits its reducing power once doped with an oxidant such as FeCl3. It appears that the more CAB-O-SIL® present in the sample [ratio of Cab to Fe(III)], the higher will be the ratio of Fe(II)/Fe(III) in the product. In other words, by tuning the percentage of the composing CAB-O-SIL®, we will be able to control the ratio of Fe(II)/Fe(III) in a sample. Samples of Cu/CAB-O-SIL® seemed to exhibit the same redox behaviour, although more work will be required to confirm this preliminary result. This redox effect between supported and reducible transition metal cations may be of great value in the design and synthesis of iron-related catalysts. The significance of this result is that those Fe ions in contact with the Si ions participated in this redox reaction and thus, we were able to exercise unprecedented control of the oxidation state of the supported iron catalysts. The present technology for reducing supported Fe ions, reduction in hydrogen gas at elevated temperatures, does not allow such pristine control of the Fe oxidation state. Moreover, the use of expensive hydrogen gas at elevated temperatures adds to the complexity of preparing the finished catalysts.Acknowledgements
The authors (JLG and MGW) acknowledge the support of this project under the auspices of the Georgia Institute of Technology program: “Creating Energy Options”. CB would like to thank the Centre for Surface Analysis of Materials (CSAM) for support of the measurement in this paper.References
- T. H. Wang, J. L. Gole, M. G. White, C. Watkins, S. C. Street, Z. T. Fang and D. A. Dixon, Chem. Phys. Lett., 2011, 501, 159–165, DOI:10.1016/j.cplett.2010.11.013.
- S. M. Prokes, W. E. Carlos, L. Seals, S. Lewis and J. L. Gole, Mater. Lett., 2002, 54, 85, DOI:10.1016/S0167-577X(01)00623-1.
- J. L. Gole and M. G. White, J. Catal., 2001, 204, 249, DOI:10.1006/jcat.2001.3335.
- Alex Cruce, private communication.
- J. L. Gole, B. D. Shinall, A. V. Iretskii, M. G. White and A. S. Erickson, Langmuir, 2004, 20, 260–62, DOI:10.1021/la035072t.
- A. Hohl and H. Fuess, J. Non-Cryst. Solids, 2003, 320, 255 CrossRef CAS.
- X. B. Chen, Y. B. Lou, A. C. S. Samia, C. Burda and J. L. Gole, Adv. Funct. Mater., 2005, 15, 41–49, DOI:10.1002/adfm.200400184.
- J. L. Gole, J. D. Stout, C. Burda, Y. B. Lou and X. B. Chen, J. Phys. Chem. B, 2004, 108, 1230–1204, DOI:10.1021/jp030843n.
- A. Mekki, D. Holland, C. F. McConville and M. Salim, J. Non-Cryst. Solids, 1996, 208, 267–276, DOI:10.1016/S0022-3093(96)00523-6.
- T. Yamashita and P. Hayes, J. Electron Spectrosc. Relat. Phenom., 2006, 152, 6–11, DOI:10.1016/j.elspec.2006.02.002.
- T. Yamashita and P. Hayes, J. Electron Spectrosc. Relat. Phenom., 2006, 154, 41–42 CrossRef CAS http://dx.doi.org/10.1016/j.elspec.2006.10.005 .
- T. Yamashita and P. Hayes, Appl. Surf. Sci., 2008, 254, 2441–2449, DOI:10.1016/j.apsusc.2007.09.063.
- E. Paparazzo, J. Electron Spectrosc. Relat. Phenom., 2006, 1e54, 38–40, DOI:10.1016/j.elspec.2006.09.004.
- http://lasurface.com/database/elementxps.php.
- H. S. Katz and J. V. Milewksi, Handbook of Fillers for Plastics, 1987, 300 Search PubMed.
- M. Noorjaha, V. D. Kumari, M. Subrahmanyam and L. Panda, Appl. Catal., B, 2005, 57, 291–298, DOI:10.1016/j.apcatb.2004.11.006.
- V. Y. Davydov, A. V. Kiselev and L. T. Zhuravlev, Trans. Faraday Soc., 1964, 60, 2254–2264, 10.1039/TF9646002254.
- J. Wang, B. Mao, J. L. Gole and C. Burda, Nanoscale, 2010, 2(10), 2257–2261 RSC.
- F. J. Moulder, F. W. Stickle, E. P. Sobol and D. K. Bomben, Handbook of X-ray Photoelectron Spectroscopy, Perkin-Elmer Corporation, Minnesota, 1992 Search PubMed.
Footnote |
| † Electronic supplementary information (ESI) available: XPS survey scans of Fe Cab and Cu Cab samples and data of water contact angle on CAB-O-SIL® sample. See DOI: 10.1039/c2ra20580g |
| This journal is © The Royal Society of Chemistry 2012 |

