A facile green strategy for rapid reduction of graphene oxide by metallic zinc†
Sheng
Yang
,
Wenbo
Yue
*,
Dazhen
Huang
,
Caifeng
Chen
,
Hao
Lin
and
Xiaojing
Yang
*
College of Chemistry, Beijing Normal University, Beijing, 100875, China. E-mail: yang.xiaojing@bnu.edu.cn; Fax: +86-10-58802075; Tel: +86-10-58802960
First published on 26th July 2012
Abstract
This work reports a green and facile approach to the synthesis of graphene nanosheets through the zinc reduction of a graphene oxide precursor in alkaline media. Compared to the chemical reduction of GO by using hydrazine or its derivations, the present route is operationally easy and environmentally friendly. Moreover, the reduction degree of GO in the present condition is much higher than that in either Zn or alkaline solutions alone, indicating a cooperative mechanism, and the as-prepared graphene exhibits a good stability in solution. This simple method shows promising applications in the bulk-quantity production of graphene and graphene-based materials.
Introduction
Graphene, a two-dimensional monolayer of graphite, has inspired intense interest due to its superior electronic, chemical and mechanical properties.1–3 It has been regarded as a valid component for creating various functional composite materials, which have been applied in the fabrication of supercapacitors, molecular sensors, photovoltaic devices and anode materials for lithium-ion batteries.4–10 Thus a facile and green synthesis of graphene in large quantities is pursued. Up to now, many strategies have been adopted for the synthesis of graphene, such as mechanical cleavage, chemical exfoliation and thermal expansion of graphite, chemical reduction of graphene oxide (GO), etc.2,11–14 Among these various methods, solution-processed chemical reduction offers great ease for the production of graphene at a large scale and at relatively low costs. Hydrazine monohydrate, dimethylhydrazine, thionylchloride, sodium borohydride, etc.15–18 are widely employed as the reducing agents to reduce GO in alkaline solution. However, these agents require essential care and can do great damage to the environment because they are poisonous and dangerously unstable. Iron19 and hydriodic acid20 can be used to reduce GO in acidic solution. Nevertheless, the reduced GO (rGO) obtained in acidic solution has a strong tendency to form irreversible agglomerates, which does not favor the synthesis of graphene-based composite materials. On the other hand, to prepare composites concerning chemically converted graphene, three strategies are adopted, pre-graphenization, post-graphenization and syn-graphenization.21 For the latter two strategies, the media is important since, for example, in an aqueous solution, the hydrolysis reaction is a considerable factor which may limit the use of reduction agents.22It is worthwhile to develop a safe, rapid and efficient method to prepare graphene in even milder conditions. In our previous work, an approach to reducing GO with the assistance of variable-valence metal ions was proposed, avoiding the use of harmful solvents.23 Some green molecules such as sugars (glucose and sucrose) are also employed to prepare graphene.24 Moreover, given that zinc is a cost-effective, easily-obtainable, and mild-reductive material, it can be regarded as a novel green reducing agent. Herein we propose a novel strategy to convert GO to graphene by using zinc as a reducing agent under alkaline conditions. The method has several advantages over the common chemical reduction process: (i) it is green, low-cost and easy to process, which is desirable for industrial batch production; (ii) graphene obtained in alkaline solution can form a stable suspension, favoring the subsequent handling, and the result is comparable to that using hydrazine reduction at high pH;15 and (iii) it avoids introducing additional functional groups, which are not beneficial for most practical applications, into the treated GO. Additionally, the possible reduction mechanism of GO in the presence of zinc is also discussed.
Experimental
Materials
GO was synthesized from natural graphite flakes based on a modified Hummers method.25 In brief, graphite powder (average size 20 μm, apparent density 0.05 g cm−3) was oxidized by using NaNO3, conc. H2SO4, KMnO4 and H2O2 solutions. The resulting mixture was washed several times with water to remove residual acids and salts. The as-prepared GO was suspended in water by ultrasonication for 30 min, followed by a low-speed centrifugation to get rid of any aggregated GO nanosheets, to give a yellow colloidal suspension. The homogeneous exfoliated GO dispersion with a concentration of 0.5 mg mL−1 was used as the starting material for the further experiments.The reduction of GO was performed as follows, NaOH powder (0.06 mol) was added to a GO dispersion (60 mL), after ultrasonication for 10 min, 0.01 mol zinc powder (obtained from Tianjin Kermal Reagents Company) was added, the mixture was stirred constantly at room temperature (RT) for 6 h. To evaluate the effect of temperature, the same experiment was also performed at 100 °C. The obtained dispersion was copiously washed by filtration with dilute HCl acid (0.1 M) to remove excess zinc or salts, and then dried overnight at 40 °C. The samples are denoted as rGO-temperature, where temperature is RT or 100 in centigrade.
For a better understanding of the role of each agent in the reduction, two control experiments were carried out by heating GO aqueous dispersions at different temperatures for 6 h. (I) Only NaOH powder, and (II) only zinc powder were added. Each was carried out under the same experimental conditions. The obtained samples are denoted as (I) rGO–NaOH-RT, rGO–NaOH-100 and (II) rGO–Zn-RT and rGO–Zn-100.
Characterization
X-ray diffraction (XRD) measurements were carried out on a Philips X'pert ProMPD diffractometer with Cu-Kα radiation. Samples were prepared by drop-dying their aqueous suspensions onto glass substrates. Raman scattering spectra were acquired by using a Jobin-Yvon Laser Confocal Micro-Raman Spectrometer with a 633 nm laser source. The samples were prepared by drop casting of the dispersion on SiO2 substrates and the solvent was evaporated. For Raman analysis 20 spectra were collected for each sample. Fourier-transform infrared (FT-IR) spectra were obtained by the KBr method on a Nicolet-380 FT-IR spectrometer in the range of 400–4000 cm−1. The samples were prepared by dispersing the materials in KBr pellets. The UV-vis spectra were determined by a Cintra 10e ultraviolet-visible spectrometer. The dilute dispersions of the samples were placed in quartz cuvettes of 1 cm path length and the scanning wavelength range was 190–800 nm. The elemental analysis for C, H and N contents was performed on a LabRAM ARAMIS analyzer. X-Ray photoelectron spectroscopy (XPS) was performed with a KratosAxis Ultra spectrometer using Mg-Kα (1253.6 eV) radiation at a power of 150 W, and the vacuum of the analysis chamber was higher than 2 × 10⁻⁸ Pa. To ensure the accuracy of the data measured, the binding energies were calibrated with the sp2 C 1s band at 284.5 eV. Curve fitting, peak separating and background subtraction were accomplished by using XPSPEAK41 software. The peak separating was performed by mixed Gaussian–Lorentzian functions.SEM images were collected through a Philips XL30 S-FEG Scanning Electron Microscope. The samples were prepared by spreading the dry powder on conductive carbon double faced tape. A drop of a dispersion containing the reduced graphene oxide was placed on a holey carbon-coated copper grid, and then dried in air before its measurement by Transmission Electron Microscopy (TEM, JEOL JEM-2010). AFM measurements were performed on a Brucker Nanoscope IIIa Atomic Force Microscope. The samples were prepared by depositing their dispersions on freshly cleaved mica surfaces and allowing them to air-dry. Spectral analysis was taken by Nanoscope Analysis software (version 1.40).
Results and discussion
Since GO is heavily decorated with oxygen-containing groups, which are predominately hydroxyl and epoxy groups on the carbon plane and carboxyl groups on the periphery, the reduction mainly focuses on the removal of these groups with the recovery of a conjugated structure. The change of microstructure results in the alteration of properties, which can be directly observed or detected. Optical observation is adopted as a direct way to detect the changes in GO before and after reduction.26 The colour of the GO suspension changed from yellow to black during the reduction process, which can be an obvious visible characteristic of the effect of reduction, and suggests the formation of reduced GO. However, the well-dispersed colloid state is still retained after the treatment, as shown in the photographs (Fig. 1). Actually, GO colloids can be stabilized owing to the hydrophilic groups on the surface. A decrease of polar functionalities brings about an increase of hydrophobicity, in alkaline solution, the electrostatic repulsion of negatively charged sheets results in the stabilization of the rGO dispersion.15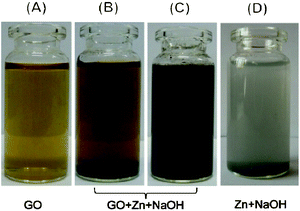 | ||
| Fig. 1 Optical photographs of each system: GO dispersion (0.5 g L−1) in water (A), in NaOH solution (1 M) before (B) and after (C) reduction; and the reaction of zinc with NaOH solution (1 M) (D) without GO. | ||
Fig. 2 shows the SEM and TEM images of original GO and rGO. Both GO and rGO consist of randomly aggregated sheets, corrugations and scrolling are observed because the 2D membrane structure becomes thermodynamically stable via blending.19 The high resolution TEM image (Fig. 2D) reveals that single-sheets of rGO can be distinguished and the thickness is about 1 nm, which is consistent with the result obtained by other reduction methods.5,11 The monolayers of GO and rGO are also confirmed by Atomic Force Microscopy (Fig. 3). Images are acquired through deposition of the dispersions on freshly cleaved mica substrates by a drop-casting method. We replicated the measurement 10 times for each sample based on the height profile of the AFM image. It shows that the average thickness of a GO platelet is approximately 1.22 nm, which corresponds to earlier literature.27 The thickness of a rGO sheet is about 0.93 nm, which is smaller than that of the GO sheet, as a result of the elimination of oxygenated functional groups. As shown in the UV-vis spectrum (Fig. 4), GO exhibits an π–π* absorption band at 230 nm and a shoulder n–π* absorption band at 295 nm, whereas the peak of the π–π* transition shifts to 265 nm for rGO, indicating that some groups on the GO surface are removed and the conjugated structure is restored.28
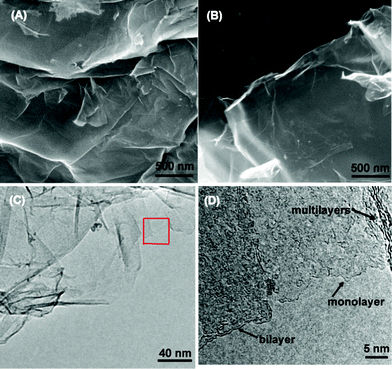 | ||
| Fig. 2 SEM images of GO (A), rGO (B), a TEM image of an rGO platelet (C) and a high resolution TEM image of the selected area (D). | ||
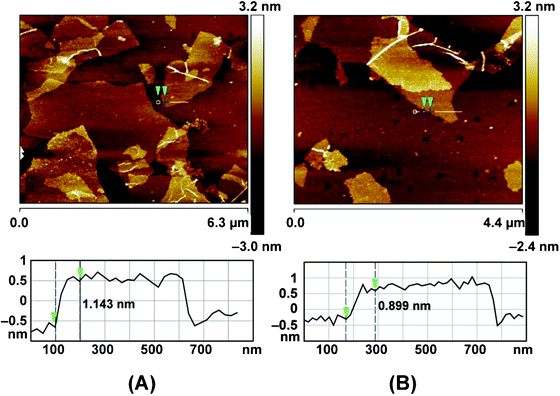 | ||
| Fig. 3 AFM images and cross-section analysis of GO (A) and rGO suspension (B), the samples were deposited on freshly cleaved mica substrates. | ||
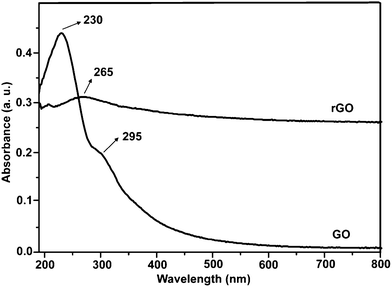 | ||
| Fig. 4 UV-vis absorption spectra of GO and rGO suspensions. | ||
Subsequently, rGOs prepared under different conditions were characterized by XRD. Fig. 5 shows the XRD patterns for these samples. Owing to the introduction of various oxygen-containing functionalities and intercalated water molecules between layers, the basal spacing (dbasal) is greatly expanded from 3.35 Å (pristine graphite) to 7.79 Å (GO), which is known to vary between 6.5 and 9.0 Å depending on the degree of oxidation.22 After treatment in a NaOH solution at ambient temperature, rGO-RT only exhibits weak broad diffraction peak, confirming the incomplete restoration of the graphite crystal structure. The interlayer spacing of rGO-RT (∼3.68 Å) is much smaller than that of GO, while a little larger than that of the pristine graphite, indicating the removal of functional groups. The XRD pattern of rGO-100 is analogous to that of rGO-RT. The peak appearing at ca. 2.10 Å is related to the 2-D carbon frameworks,22 which can be observed in the XRD pattern of colloidal GO suspension in the wet-state.
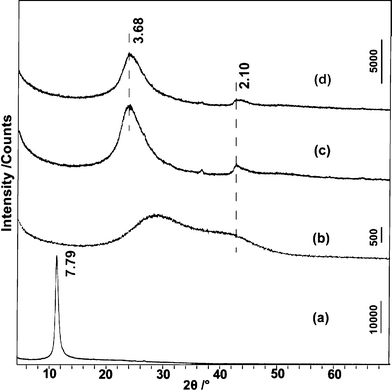 | ||
| Fig. 5 XRD patterns for GO (a), the wet state of GO (b), rGO-RT (c), and rGO-100 (d). All samples except (b) were water-washed, filtered and dried in vacuum. The d-value is in Å. | ||
The characterization of GO and rGOs was further performed by using FT-IR and Raman. As shown in the FT-IR spectra (Fig. 6A), GO shows the characteristic absorption bands corresponding to the epoxy (C–O–C) stretching vibrations (1064 cm−1), phenolic hydroxyl group (C–OH) stretching (1123 cm−1) and carbonyl groups (C![[double bond, length as m-dash]](https://www.rsc.org/images/entities/char_e001.gif) O) of carboxylic derivatives stretching frequency (1730 cm−1). The bands around 3430 and 1410 cm−1 can be assigned to the stretching and bending vibrations of –OH groups in GO and water molecules respectively. The decreasing intensities of absorption bands for the rGOs at ∼3400 cm−1 result from the diminution of hydroxyl groups linked to the graphitic base. However, according to XRD analysis, the dbasal value of rGOs (3.68 Å) is only larger by 0.33 Å than that of pristine graphite (dbasal = 3.35 Å), indicating that water molecules are absorbed on the surface rather than in the interlayer of rGO. In the spectra of the rGOs, the band at 1680 cm−1 originating from skeletal vibrations of graphitic domains shifts to 1620 cm−1 when the reduction reaction occurs, suggesting a recuperation of the conjugated aromatic structure.6 The specific absorption bands of oxide groups (νC–O–C, νC
O) of carboxylic derivatives stretching frequency (1730 cm−1). The bands around 3430 and 1410 cm−1 can be assigned to the stretching and bending vibrations of –OH groups in GO and water molecules respectively. The decreasing intensities of absorption bands for the rGOs at ∼3400 cm−1 result from the diminution of hydroxyl groups linked to the graphitic base. However, according to XRD analysis, the dbasal value of rGOs (3.68 Å) is only larger by 0.33 Å than that of pristine graphite (dbasal = 3.35 Å), indicating that water molecules are absorbed on the surface rather than in the interlayer of rGO. In the spectra of the rGOs, the band at 1680 cm−1 originating from skeletal vibrations of graphitic domains shifts to 1620 cm−1 when the reduction reaction occurs, suggesting a recuperation of the conjugated aromatic structure.6 The specific absorption bands of oxide groups (νC–O–C, νC![[double bond, length as m-dash]](https://www.rsc.org/images/entities/char_e001.gif) O, νC–OH) decrease noticeably and the absorptions of epoxy and carbonyl groups even vanish, revealing that most oxygen-containing functional groups are eliminated in the reduction. In the Raman spectroscopy spectra (Fig. 6B), two main bands (D and G) are the dominant vibrational modes observed in the graphitic structures. The D band is associated with the order/disorder degree from a breathing κ-point phonon of A1g symmetry and the G band, which is assigned to the E2g phonon of sp2 hybrid carbon atoms,21 is an indicator of the stacking structure. Pristine graphite shows a strong G band and a weak D band at 1577 cm−1 and 1354 cm−1, respectively.24 The G band of GO is broader and shifted to 1590 cm−1, widely believed to be attributed to the isolated double bond. The D band at 1323 cm−1 increases prominently due to the reduction in the size of the in-plane sp2 domains, probably resulting from extensive oxidation and ultrasonic exfoliation.23 After reduction, the frequency of the D band and G band (1329 and 1589 cm−1) is parallel to that of GO, while the ratio of the intensities of two bands are quite different. The integral area ratio of the D band and G band, ID/IG, is often used to determine the number of layers in a graphene sample and its overall stacking behavior.29 For instance, a higher ID/IG ratio indicates a higher degree of disorder. The ID/IG ratios enhance with an up-grading of temperature, suggesting that GO becomes more defective during reduction at higher temperature. Compared with the ID/IG of GO (1.19), rGOs are generally larger (around 1.40) due to the presence of unrepaired defects after the removal of oxide groups.
O, νC–OH) decrease noticeably and the absorptions of epoxy and carbonyl groups even vanish, revealing that most oxygen-containing functional groups are eliminated in the reduction. In the Raman spectroscopy spectra (Fig. 6B), two main bands (D and G) are the dominant vibrational modes observed in the graphitic structures. The D band is associated with the order/disorder degree from a breathing κ-point phonon of A1g symmetry and the G band, which is assigned to the E2g phonon of sp2 hybrid carbon atoms,21 is an indicator of the stacking structure. Pristine graphite shows a strong G band and a weak D band at 1577 cm−1 and 1354 cm−1, respectively.24 The G band of GO is broader and shifted to 1590 cm−1, widely believed to be attributed to the isolated double bond. The D band at 1323 cm−1 increases prominently due to the reduction in the size of the in-plane sp2 domains, probably resulting from extensive oxidation and ultrasonic exfoliation.23 After reduction, the frequency of the D band and G band (1329 and 1589 cm−1) is parallel to that of GO, while the ratio of the intensities of two bands are quite different. The integral area ratio of the D band and G band, ID/IG, is often used to determine the number of layers in a graphene sample and its overall stacking behavior.29 For instance, a higher ID/IG ratio indicates a higher degree of disorder. The ID/IG ratios enhance with an up-grading of temperature, suggesting that GO becomes more defective during reduction at higher temperature. Compared with the ID/IG of GO (1.19), rGOs are generally larger (around 1.40) due to the presence of unrepaired defects after the removal of oxide groups.
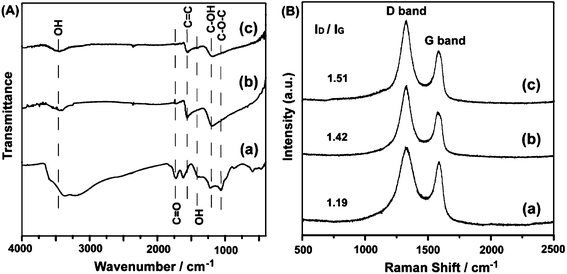 | ||
| Fig. 6 (A) FT-IR and (B) Raman spectra of GO (a), rGO-RT (b), and rGO-100 (c). | ||
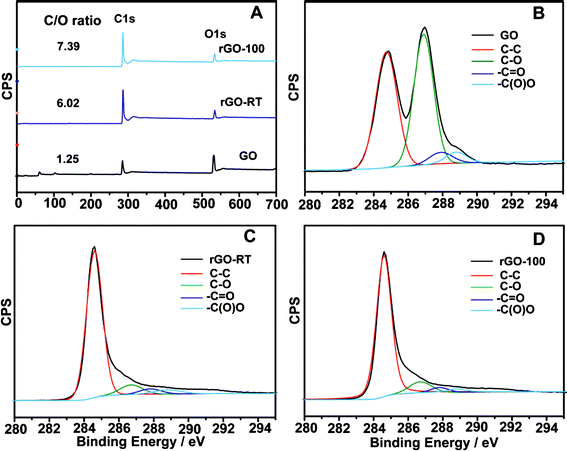
To further understand the reduction process, XPS was used to check the behaviour of oxygen-containing groups on the carbon skeleton. In the XPS spectra of GO, rGO-RT and rGO-100 specimens (Fig. 7A), the atomic ratios of carbon and oxygen (C/O) obtained by taking the ratio of C 1s to O 1s peak areas are 1.25, 6.02 and 7.39, respectively, which is very consistent with the composition analysis results (Table 1), Fig. 7B–7D show the C 1s spectra of samples prepared at various temperatures. In the spectrum of the initial GO, four different peaks centred at 284.5, 286.8, 287.9 and 288.8 eV are observed, corresponding to single or double bonds in aromatic rings, i.e. C–O (epoxy and alkoxy), C![[double bond, length as m-dash]](https://www.rsc.org/images/entities/char_e001.gif) O, and –COO– groups,30 respectively. Compared with the spectrum of raw GO, the intensities of all C 1s peaks related to the oxidized groups decreased prominently, confirming the effective conversion of most sp3 hybridized carbon atoms of GO to sp2 hybridized carbons, that is, the conjugated graphene networks are reinstated after reduction.19
O, and –COO– groups,30 respectively. Compared with the spectrum of raw GO, the intensities of all C 1s peaks related to the oxidized groups decreased prominently, confirming the effective conversion of most sp3 hybridized carbon atoms of GO to sp2 hybridized carbons, that is, the conjugated graphene networks are reinstated after reduction.19
| Sample | Element content/wt (%) | Formula | C/O molar ratio | ||
|---|---|---|---|---|---|
| C | H | O | |||
| GO | 45.79 | 2.761 | 51.45 | CH0.72O0.84 | 1.19 |
| rGO-RT | 79.23 | 2.327 | 18.44 | CH0.42O0.17 | 5.73 |
| rGO-100 | 82.79 | 1.861 | 15.35 | CH0.40O0.14 | 7.19 |
| rGO–NaOH-RT | 48.48 | 3.211 | 48.24 | CH0.79O0.75 | 1.34 |
| rGO–NaOH-100 | 65.68 | 2.067 | 32.25 | CH0.38O0.37 | 2.71 |
| rGO–Zn-RT | 67.01 | 1.636 | 31.22 | CH0.29O0.35 | 2.86 |
| rGO–Zn-100 | 72.24 | 1.902 | 25.65 | CH0.31O0.27 | 3.76 |
Table 1 shows the analytical element contents of GO and reduced specimens. High oxygen content (51.45%) and a low calculated C/O ratio (1.19) gave a hint that GO was well-prepared. High C/O ratios are shown for rGOs and they are mildly enhanced from 5.73 to 7.19 with increasing temperature, revealing that temperature is a considerable factor. Additionally, the residual contents of hydrogen and oxygen are related to absorbed water or residual oxygen-containing groups (e.g. C–OH) on the graphene surface.21 For control experiments, when only NaOH was added, FT-IR (Fig. S1, ESI†) and XRD (Fig. S2, ESI†) data of rGO–NaOH-RT and rGO–NaOH-100 indicate that the reduction took place at 100 °C, which has been confirmed in a previous report.27 However, the extent of reduction is quite low (C/O ratio is 2.71) according to the CHN analysis. Since GO itself was acidic (pH = ∼3.7 at 0.5 g L−1), zinc was introduced to dispersions of GO without the addition of NaOH, in the products of rGO–Zn-RT and rGO–Zn-100, some oxide groups (i.e. epoxy) were removed (Fig. S1, ESI†) and typical humps around d = 3.7 Å were observed in the XRD pattern (Fig. S2, ESI†). Nevertheless, the reduction degree (C/O ratio, less than 3.86) is no higher than that of the rGO samples. It can be concluded that both Zn and NaOH are important for the reduction and high temperature is also conducive to a better outcome.
As a result, GO can be simply reduced in the presence of Zn under alkaline conditions and the reduction degree increases with the enhancement of reaction temperature. It can be explained as follows, the electrostatic repulsion of highly negatively charged sheets is propitious to forming well-dispersed GO and rGO sheets.15 The reaction of Zn and NaOH is mild, which does not generate marked gas bubbles. It is well known that GO sheets are apt to being captured by rising hydrogen bubbles and then floating to the water surface due to their amphiphilicity.31 In general, GO is reduced primarily by the migration of electrons donated from Zn. The reduction process can be described as one equation and two moieties:
| GO + aZn + bOH− → rGO + aZn(OH)2−4 + cH2O |
| (1) Zn − 2e− + 4OH− → Zn(OH)2−4 | (1) |
| (2) GO + 2ae− → rGO + (b − 4a)OH− + cH2O | (2) |
The redox potential of GO/rGO enhances when the GO surface is coated by a large number of negative charges via ion-exchange of Na+ in solution with H+ of carboxyl groups. Zhou et al.32 reported the reduction potential of GO to be about −1.0 V in a solution of pH around 12, in our case, the pH value is 12.66. Meanwhile, Zn2+ ions tend to form the [Zn(OH)4]2− complex in a strong alkaline solution and the redox potential of Zn2+/Zn (−0.76 V vs. SHE) will shift to a more negative value ([Zn(OH)4]2−/Zn, −1.245 V vs. SHE). Additionally, strong alkaline solution is reported to deoxygenate exfoliated GO sheets above 55 °C27 and Zn itself can reduce GO to some extent on the basis of our experiment, which will provide an accelerated reaction rate in our case. Furthermore, redox potential difference increases with a promotion of temperature, ruled by the Nernst equation, which leads to a stronger capability of reduction. Thus, GO tends to be reduced in alkaline media. It should be noted here that the control study on the reduction of GO in strong acidic media (1 M of HCl) showed that GO can be reduced at high temperatures even though the reduction degree was not very high (Fig. S3, ESI†).
Conclusions
In summary, we have demonstrated a green, low-cost, mild and effective strategy for the chemical reduction of GO in aqueous solution via the adoption of zinc as a reducing agent. The reduction degree of GO is very high due to the formation of the [Zn(OH)4]2− complex, which shifts the redox potential of Zn2+/Zn to a more negative value. Nevertheless, the reduction under alkaline conditions offers a great flexibility and avoids the use of any harmful reagents such as hydrazine. The synthesized graphene nanosheets can be dispersed in aqueous solution, which indicates a prospective future for large-scale production of rGO or graphene-based materials.Acknowledgements
This work is financially supported by the National Natural Science Foundation of China (NO. 50872012 and NO. 21101014).References
- K. I. Bolotin, K. J. Sikes, Z. Jiang, M. Klima, G. Fudenberg, J. Hone, P. Kim and H. L. Stormer, Solid State Commun., 2008, 146, 351–355 CrossRef CAS.
- K. S. Novoselov, A. K. Geim, S. V. Morozov, D. Jiang, Y. Zhang, S. V. Dubonos, I. V. Girgorieva and A. A. Firsov, Science, 2004, 306, 666–669 CrossRef CAS.
- C. Lee, X. D. Wei, J. W. Kysar and J. Hone, Science, 2008, 321, 385–388 CrossRef CAS.
- Y. Wang, Z. Q. Shi, Y. Huang, Y. F. Ma, C. Y. Wang, M. M. Chen and Y. S. Chen, J. Phys. Chem. C, 2009, 113, 13103–13107 CAS.
- J. T. Robinson, F. K. Perkins, E. S. Snow, Z. Wei and P. E. Sheehan, Nano Lett., 2008, 8, 3137–3140 CrossRef CAS.
- Z. S. Wu, W. C. Ren, L. Wen, L. B. Gao, J. P. Zhao, Z. P. Chen, G. M. Zhou, F. Li and H. M. Cheng, ACS Nano, 2010, 4, 3187–3194 CrossRef CAS.
- C. X. Guo, M. Wang, T. Chen, X. W. Lou and C. M. Li, Adv. Energy Mater., 2011, 1, 736–741 CrossRef CAS.
- C. X. Guo, X. T. Zheng, Z. S. Lu, X. W. Lou and C. M. Li, Adv. Mater., 2010, 22, 5164–5167 CrossRef CAS.
- C. X. Guo and C. M. Li, Energy Environ. Sci., 2011, 4, 4504–4507 CAS.
- C. X. Guo, H. B. Yang, Z. M. Sheng, Z. S. Lu, Q. L. Song and C. M. Li, Angew. Chem., Int. Ed., 2010, 49, 3014–3017 CrossRef CAS.
- M. J. McAllister, J. Li, D. H. Adamson, H. C. Schniepp, A. A. Abdala, J. Liu, M. Herrera-Alonso, D. L. Milius, R. Car, R. K. Prud'homme and I. A. Aksay, Chem. Mater., 2007, 19, 4396–4404 CrossRef CAS.
- Z. Juang, C. Wu, C. Lo, W. Chen, Y. Huang, J. C. Hwang, F. Chen, K. C. Leou and C. H. Tsai, Carbon, 2009, 47, 2026–2031 CrossRef CAS.
- K. S. Kim, Y. Zhao, H. Jang, S. Y. Lee, J. M. Kim, K. S. Kim, J. H. Ahn, P. Kim, J. Y. Choi and B. H. Hong, Nature, 2009, 457, 706–710 CrossRef CAS.
- S. Stankovich, D. A. Dikin, R. D. Piner, K. A. Kohlhaas, A. Kleinhammes, Y. Y. Jia, Y. Wu, S. T. Nguyen and R. S. Ruoff, Carbon, 2007, 45, 1558–1565 CrossRef CAS.
- D. Li, M. B. Müller, S. Gilje, R. B. Kaner and G. G. Wallace, Nat. Nanotechnol., 2008, 3, 101–105 CrossRef CAS.
- S. Stankovich, D. A. Dikin, G. H. B. Dommett, K. M. Kohlhaas, E. J. Zimney, E. A. Stach, R. D. Piner, S. T. Nguyen and R. S. Ruoff, Nature, 2006, 442, 282–286 CrossRef CAS.
- S. Niyogi, E. Bekyarova, M. E. Itkis, J. L. McWilliams, M. A. Hamon and R. C. Haddon, J. Am. Chem. Soc., 2006, 128, 7720–7721 CrossRef CAS.
- H. J. Shin, K. K. Kim, A. Benayad, S. M. Yoon, H. K. Park, I. S. Jung, M. H. Jin, H. K. Jeong, J. M. Kim, J. Y. Choi and Y. H. Lee, Adv. Funct. Mater., 2009, 19, 1987–1992 CrossRef CAS.
- Z. J. Fan, W. Kai, J. Yan, T. Wei, L. J. Zhi, J. Feng, Y. M. Ren, L. P. Song and F. Wei, ACS Nano, 2011, 5, 191–198 CrossRef CAS.
- S. F. Pei, J. P. Zhao, J. H. Du, W. C. Ren and H. M. Cheng, Carbon, 2010, 48, 4466–4474 CrossRef CAS.
- H. Bai, C. Li and G. Q. Shi, Adv. Mater., 2011, 23, 1089–1115 CrossRef CAS.
- S. J. Guo and S. J. Dong, Chem. Soc. Rev., 2011, 40, 2644–2672 RSC.
- C. F. Chen, T. T. Chen, H. L. Wang, G. B. Sun and X. J. Yang, Nanotechnology, 2011, 22, 405602 (6pp) Search PubMed.
- H. L. Guo, X. F. Wang, Q. Y. Qian, F. B. Wang and X. H. Xia, ACS Nano, 2009, 3, 2653–2659 CrossRef CAS.
- W. S. Hummers and R. E. Offeman, J. Am. Chem. Soc., 1958, 80, 1339–1339 CrossRef CAS.
- S. F. Pei and H. M. Cheng, Carbon, 2012, 50, 3210–3228 CrossRef CAS.
- X. B. Fan, W. C. Peng, Y. Li, X. Y. Li, S. L. Wang, G. L. Zhang and F. B. Zhang, Adv. Mater., 2008, 20, 4490–4493 CrossRef CAS.
- C. Z. Zhu, S. J. Guo, Y. X. Fang and S. J. Dong, ACS Nano, 2010, 4, 2429–2437 CrossRef CAS.
- R. D. Daniel, S. J. Park, C. W. Bielawski and R. S. Ruoff, Chem. Soc. Rev., 2010, 39, 228–240 RSC.
- J. L. Zhang, H. J. Yang, G. X. Shen, P. Cheng, J. Y. Zhang and S. W. Guo, Chem. Commun., 2010, 46, 1112–1114 RSC.
- J. Kim, L. J. Cote, F. Kim, W. Yuan, K. R. Shull and J. X. Huang, J. Am. Chem. Soc., 2010, 132, 8180–8186 CrossRef CAS.
- M. Zhou, Y. L. Wang, Y. M. Zhai, J. F. Zhai, W. Ren, F. Wang and S. J. Dong, Chem.–Eur. J., 2009, 15, 6116–6120 CrossRef CAS.
Footnote |
| † Electronic supplementary information (ESI) available: XRD patterns (Fig. S1) and FT-IR spectra (Fig. S2) of GO–NaOH-RT, GO–NaOH-100, and GO–Zn-RT and GO–Zn-100. Control study on the reduction of GO in acidic media (HCl, 1 M) at RT and 100 °C (Fig. S3). See DOI: 10.1039/c2ra20746j |
| This journal is © The Royal Society of Chemistry 2012 |

