Synthesis of ultrasmall quantum dots by redirecting kinetics-based crystal growth to thermodynamics-based crystal dissolution
Hsueh-Shih
Chen
and
Ramachandran Vasant
Kumar
Department of Materials Science and Metallurgy, University of Cambridge, Pembroke Street, Cambridge CB2 3QZ, UK. E-mail: sean.chen@cantab.net
First published on 1st October 2012
Abstract
Ultrasmall quantum dots (< 2 nm) have been synthesised by redirecting crystal growth to dissolution during the synthetic process. The redirection is carried out with a controlled quenching–isothermal annealing process, where quantum dots are first grown and then quenched to a lower temperature, followed by thermodynamically reducing the size in an isothermal annealing process. The synthesised ultrasmall quantum dots are of high quality and their photoluminescence efficiency is generally more than 60%. With polymer overcoating, the blue-emitting ultrasmall quantum dots are water dispersible and stable for more than nine months.
Introduction
The formation of crystals, crystallization, is one of the most important subjects in materials research. Crystallization generally involves three processes; nucleation, growth and Ostwald ripening. Nucleation is a kinetics-based process that produces the smallest stable crystals and contributes to the initial size diversity of crystals. The subsequent process, growth, governed by the reaction and/or diffusion kinetics, dominates the enlargement of crystals. Ostwald ripening, a thermodynamics-based process to reduce the excess free energy contributed by smaller crystals, leads to an increase in the average size but causes broadening of the size distribution for crystals.Approaches to control size and size distribution of crystals may be classified into thermodynamics-based and kinetics-based catagories. In the thermodynamics-based regime, nucleation and crystal growth occur close to equilibrium (e.g. low monomer oversaturation), in which the thermodynamics-based process such as Ostwald ripening competes with the growth process and greatly affects the size and size distribution of growing crystals. For example, in a typical hydrothermal process, precursors are loaded in a closed vessel where the reaction or decomposition of precursors takes place at a moderately high temperature that gently generates monomers for nucleation and crystal growth. In this case, some smaller crystals may dissolve if they are smaller than the critical size determined by the monomer concentration according to the Gibbs–Thomson relationship. The size and size distribution of crystals are therefore dominated by the initial formula of precursors and the Ostwald ripening of growing crystals. The advantages of the thermodynamic-based method are simple operation, a highly crystalline product and feasible control over the crystal size since the size enlargement is relatively slow (∼hours to days). However, the size of grown crystals is generally larger and their size distribution is relatively broader because of the involvement of Ostwald ripening.
On the other hand, in the kinetics-based regime, the monomer concentration is high so the reaction and crystallization proceed fast. A well known sample is the so-called hot-injection. In the typical hot-injection system, organometallic precursors readily decompose after they are injected into a hot medium and generate a large amount of monomers oversaturated at a relatively high temperature (250–350 °C). The crystal crystallization in this case is fast and violent and the nuclei formed are rather small (∼1 nm). The crystal growth normally takes place in high oversaturation so Ostwald ripening would not be predominant in this situation. Thus, crystal enlargement is mainly determined by the crystal growth process and could be simply controlled by the growth time. Besides, the size distribution of crystals can narrow down kinetically because of higher growth rates for smaller crystals1 and it can also decrease thermodynamically due to the magic size effect.1b,c Crystals synthesised from this method are generally small, narrowly distributed and highly crystalline.2 It has been considered one of the best synthetic approaches to colloidal quantum dots (QDs) with a fairly small size distribution. Unfortunately, the hot-injection method has some inherent limitations. For example, the reproducibility of nanocrystals is still a challenge because the crystallization rate is fast (∼seconds to minutes) in this case. Specifically, it is difficult to prepare ultrasmall QDs with high quality and a uniform size distribution. To produce smaller QDs, small nuclei are needed so the initial monomer oversaturation in the system must be very high. However, in that situation the crystal growth may be too fast to control, that is, it is difficult to manage the growth of ultrasmall nanocrystals and control over their size/size distribution simultaneously.
There are two synthetic strategies generally applied to synthesise ultrasmall QDs or nanoparticles. The first one is to interrupt the growth of growing crystals by injecting a cold medium. The other is to slow down the reaction/growth rate by decreasing the temperature or simply changing the recipe. For instance, CdSe QDs with an average size varying from 1.6 to 2.2 nm were prepared by stopping the crystal growth in ∼5 s by pouring cold reagents into the reaction vessel, which was kept at a relatively low temperature (e.g. < 250 °C).3 However, it should be noted that an interruption of the crystal growth may unexpectedly result in crystal defects, which could generate deep level luminescence defects leading to a broad emission band4 or cause a nonradiative recombination that lowers the emission efficiency for QDs. On the other hand, magic sized CdSe molecular clusters could be prepared by slowing down the reaction and growth rate at a lower temperature (∼80 °C).5 The product prepared from this method generally consists of more than one size group and needs a further size selection.6 A modified method to synthesise CdSe molecular clusters with rather uniform size distribution was also presented,7 in which synthesised CdSe molecular clusters were in the magic size with a specific configuration such as a cage or cage-like structure. However, the synthetic time was longer (days–weeks) and the energy consumption may not be cost effective.
In this paper, we propose a concept to synthesise ultrasmall QDs or nanocrystals with a fairly narrow size distribution via controlling the QD surface crystallinity, which is expected to be generally applied for other materials systems. In the later stage of the crystal growth, we switch off the crystal growth in the kinetic environment by quenching the reaction system to a lower temperature, followed by placing the crystals in the thermodynamic regime with isothermal annealing. Through this switch, we were able to produce QDs with controlled surface crystallinity. The defective surface lattices could be then peeled off from the cores by enhanced stirring in the isothermal process so QDs with sizes smaller than 2 nm can be reproducibly and reliably obtained. The ultrasmall QDs synthesised were in the stable crystallographic configuration (e.g. magic size) and owned high quantum efficiencies (>15% and >65% with and without ZnS overcoating). The synthetic time including shell passivation is about two hours. With an additional overcoat of polymers, water-soluble CdSe–ZnS QDs could remain photostable for longer than nine months.
Experimental
Chemicals and materials
A cadmium precursor was prepared by reacting 0.5 mmol CdO, 2 mmol stearic acid, 25 mmol trioctylphosphine oxide (TOPO) and 40 mmol 1-hexadecylamine at 160 °C for 1 h in Ar. A selenium precursor (TOPSe) was prepared by dissolving 0.2 mmol Se into 0.5 mmol trioctylphosphine at room temperature. Precursors for the ZnS shell overcoating were diethylzinc solution (DEZ) and bis(trimethylsilyl) sulfide ((TMS)2S). For the polymer overcoating, poly(styrene-co-maleic anhydride) (PSMA, Mn = 1900) and ethanolamine (EA) were used. All chemicals were purchased from Aldrich.Synthesis of ultrasmall QDs
The one-pot synthesis of ultrasmall core–shell CdSe–ZnS QDs involved four steps; growth of large-sized QDs, quenching to a low temperature to direct the growth to the dissolution, isothermal annealing together with enhanced stirring to speed the dissolution and overcoating of the ZnS shell. In step I, a normal procedure of the hot injection method was first conducted to grow QDs in a larger size (e.g. 3.1 nm). The TOPSe precursor solution was injected into a reaction flask in 3 s containing the Cd precursor at 270 °C (magnetic stirring = 250–300 rpm). At the growth time 2–3 min, when ∼3 nm QDs were grown, the stirring was switched off and the system was immediately quenched to 180 °C with a rate of about 240 °C min−1 by an air condenser (step II). In step III, the isothermal annealing was carried out at 180 °C for 20 min under enhanced magnetic stirring (500–600 rpm). For the ZnS shell overcoating, a mixture of (TMS)2S and DEZ was directly injected into the reaction system after about 20 min during the isothermal annealing.15a The growth time of a ZnS monolayer on CdSe is about 45 min. In addition, the first step was not the major factor for the final size of the ultrasmall QDs but should avoid the QDs growing into a stable crystallographic configuration such as the closed-shell (e.g. 3.4–3.6 nm). The particle size was controlled by the annealing temperature between 135 to 180 °C. The lower temperature led to a smaller particle size. For polymer overcoating, as-prepared CdSe–ZnS QDs were dispersed in chloroform and encapsulated by PSMA without the ligand exchange process (named CdSe–ZnS–PSMA QDs).8 The oil-soluble CdSe–ZnS–PSMA QDs could be transferred from the chloroform phase into the water phase after using EA to open the maleic anhydride rings of the PSMA (named CdSe–ZnS–PSMA–EA QDs). The PSMA–Cd molar ratio used in this study is about 800.Preparation of white LEDs
For the fabrication of a light emitting surface-mount device (SMD), polymer-overcoated red-, green- and blue-emitting CdSe–ZnS QDs were sequentially printed on an optical glass substrate by an inkjet coater, and attached to a UV InGaN chip (λem = 368 nm). The as-prepared samples were dried at 60 °C under nitrogen, followed by cast coating with a silicone passivation film.Characterisation
The specimens were analyzed by a high-resolution transmission electron microscope (HRTEM, JEOL 3000F), photoluminescence (PL) (Hitachi F4500), time-resolved photoluminescence (IBH NanoLED-375L) and UV-vis (Hitachi U2010) spectrophotometers. The QD size was translated from the peak position of PL and UV spectra according to the calibration curve from TEM results.1 The quantum yield (QY) of QDs in toluene was estimated by comparing with Stilbene 420 in methanol of the same optical density (0.01). The PL lifetime was estimated from τave = (B1τ21 + B2τ22 + B3τ23)/(B1τ1 + B2τ2 + B3τ3) by fitting the tri-exponential equation I(t) = B1exp(−t/τ1) + B2exp(−t/τ2) + B3exp(−t/τ3) to the experimental data, where τn is the time constant and Bn is the amplitude of each component. The chi-square values of the fitting are between 0.8 to 1.3. Samples were collected during the reaction and immediately quenched in toluene for measurements.Results and discussion
Fig. 1 (left) gives the optical absorption spectra of QDs grown at 270 °C for about 2 min (step I, see experimental section) and the QDs quenched to 180 °C (step II). The first excitonic absorption shows that 3.1 nm QDs (UV/PL peak positions ∼550/563 nm) generate in step I and slightly increase about 0.1 nm in diameter upon the quenching process. After the QDs are isothermally annealed at 180 °C for 20 min (step III), the QD size dramatically reduces to below 2 nm (UV/PL peak positions ∼447/476 nm). PL spectra (Fig. 1, right) depict the size reducing event. A sharp PL peak at around 560 nm (first curve from the bottom) demonstrates the existence of the 3.1 nm QDs. A tail band in the high energy region indicates that some relatively stable QDs (named tail QDs) are present in the system. There is no significant change in the PL spectra of the 3.1 nm QDs when they are quenched to 180 °C (the second curve from the bottom). In the isothermal annealing process at 180 °C, the 3.1 nm QDs dissolve in the solution (the third curve from the bottom), while the 478 nm band (∼1.7 nm) rises up from the high energy band. The PL peak in step III is asymmetric because a minor part of the larger QDs has not completely dissolved in the solution yet. This could be improved by increasing the stirring rate (will be discussed later) or further isothermal annealing. A longer isothermal annealing time has no significant effect on the size of the QDs but their size distribution could be further reduced (the fourth curve from the bottom). This event is so-called thermodynamic size focusing, in which relatively unstable smaller and larger particles tend to adjust their size/morphology to the more stable one.1b–d The final product is blue-emitting with a quantum efficiency of ∼17.2% and has a sharp PL peak with full-width-at-half-maximum (FWHM) of about 30 nm without size separation. The inset in Fig. 1 schematically shows the shrinkage of larger QDs in the different steps; 3.1 nm QDs are first grown at 270 °C, followed by quenching them to 180 °C, and dissolve in the solution in the isothermal annealing process until the removal of the defective surface from the QDs is completed. Regardless of the difficulty of controlling either crystal growth rate or time, the growth method is more feasible and reliable.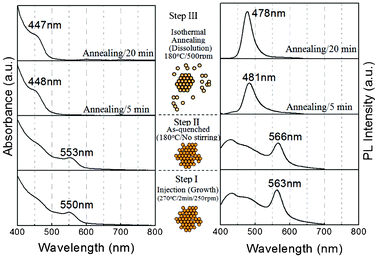 | ||
| Fig. 1 Temporal evolution of room temperature optical absorption (left) and PL spectra (right) of ultrasmall CdSe QDs in different steps. The inset image schematically shows that QDs grown in step I maintain the defective structure after quenching (step II) and dissolve into ultrasmall QDs in step III. | ||
Previous research has shown that QDs in the magic size or morphology (e.g. closed-shell) are relatively more stable because of fewer dangling bonds on their surface.7 For those QDs with an uneven surface morphology, appropriate isothermal annealing could drive the QDs to recover their stable configuration and thus nearly monosized QDs in the magic size could be obtained. This phenomenon has been called thermodynamic size focusing. The driving force of thermodynamic size focusing is based on the minimisation of the surface free energy for QDs. Higher energy parts on the QD surface such as surface vacancies, kinks, edge vacancies and surface-adsorbed units tend to be eliminated by integrating (growth) and/or disintegrating (dissolution) monomers in the thermodynamic size focusing regime. The thermodynamic size focusing of crystals may be viewed as a recovery process of the crystallinity, in which both of the core and surface lattices of QDs recover the crystallinity in the isothermal process. We point out that the size recovery process determines both the core and surface crystallinity since the lattice defects are known to eventually disappear at the QD surface in the crystal self-healing or self-purification process. The surface crystallinity is associated with the surface chemical potential or solubility of QDs. If the surface chemical potential (μsurface) is higher than the monomer chemical potential (μm), disintegration of the surface lattices could occur, i.e. the high energy surface lattice dissolves in the solution until a new equilibrium establishes, when the chemical potential of the new QD surface (i.e. the chemical potential of the core, μcore) is equal to μm, as shown in Fig. 2. One of the advantages of ultrasmall QDs prepared from this “top-down” method (“peeling off” the high-μ surface shell) is that no additional defects would be created inside the cores so the structural defects, which are generally negative to luminescence, within the QD cores could be minimised.
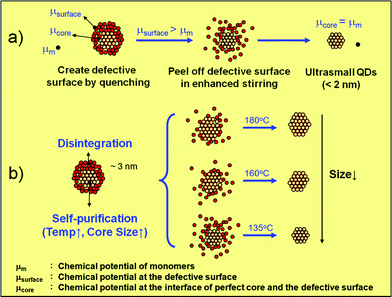 | ||
| Fig. 2 Growth mechanism of ultrasmall QDs via adjusting core–surface crystallinity. | ||
The redirection of growth to dissolution for QDs may be described by classic growth theory. Considering that the crystal growth of CdSe QDs is diffusion-limited and the thickness of the diffusion layer is much larger than crystal radius,9 the growth rate may be expressed by the equation, dr/dt = (vD/r)(Cm − Ci),10D is the diffusion constant, v is the molar volume, Cm is the monomer concentration and Ci is the solubility of QDs. The term (vD/r) relates to the diffusion, and the other term (Cm − Ci) is the concentration driving force. The sign of the growth rate dr/dt is determined by the term (Cm − Ci). Growth takes place when the monomer concentration driving force is positive, while dissolution occurs when the term is negative.
The dissolution of 3.1 nm QDs indicates that (Cm − Ci) is a negative term. It was noted that the growth could not be redirected to dissolution by a slower cooling process, which produced QDs with a bimodal size distribution in previous studies.11 Obviously, the quenching process plays a crucial role for the dissolution. The quenching process is expected to reduce Cm because the concentration of organometallic monomers in the pyrolytic reaction is sensitive to temperature and generally decreases with reducing temperature. Moreover, it is reasonable to assume that the quenching process causes structural defects for those growing QDs. Since defective lattices possess more reactive dangling bonds, leading to a higher chemical potential (μsurface), a higher solubility for the QDs is expected. Variation of the QD crystallinity or structural defects during the annealing process may be supported by examining the PL decay time for the ultrasmall QDs (PL = 478 nm). It is known that the PL quench centres are related to the crystal surface defects such as the surface dangling bonds. As shown in Fig. 3, the average PL lifetime estimated from the decay data (inset) significantly increases with annealing time (from 8.9 to 54.1 ns), showing that more PL quench centres were present in the QDs just after the quenching process. The result supports that the rapid cooling could result in crystal defects for QDs, e.g., 3.1 nm QDs, which were quenched when they were growing. The PL exciton lifetime may be size dependent so a direct comparison between ultrasmall and 3.1 nm QDs was not made. The surface defects thus make QDs more soluble. Together with the decreased monomer concentration, the term (Cm − Ci) could be switched to a negative value and crystal growth was redirected to dissolution.
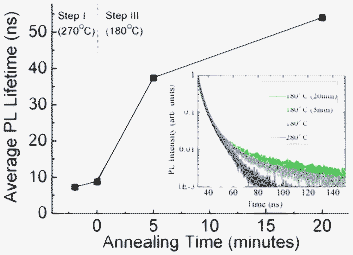 | ||
| Fig. 3 Average PL lifetime of ultrasmall CdSe QDs (λem = 478 nm) collected at different annealing time intervals. | ||
It should be emphasised that the stirring rate plays a crucial role for the size reduction in step III. In the dissolution process, the system constantly supplies thermal energy for QDs to recover their core crystallinity due to the self-purification. If the dissolution rate is too low, shrinkage of the QDs may not complete, which is attributable to the fact that the QD surfaces regain their crystallinity. Consequently, the solubility (Ci) decreases and (Cm − Ci) becomes zero or positive so the dissolution stops and the crystal growth may occur again. To avoid a positive (Cm − Ci), dissolution of the defective surface lattice must finish quickly. The relationship between the stirring rate and the dissolution rate could be expressed in the form of the Arrhenius equation, k = A/exp(−Ea/RT), where k is the rate constant, A is pre-frequency factor, Ea is the activation energy, R is the gas constant and T is temperature. The pre-frequency factor involves a collision term that is inversely proportional to the average time of collision between particles. An enhanced stirring greatly increases the collision frequency of particles so the dissolution can accelerate. In the present study, the stirring rate in the dissolution process (step III) was generally double that of the growth process (step I). In addition, the dissolution of larger particles can generate monomers that feed smaller particles, causing them to grow (PL spectra in Fig. 1). This phenomenon is like an inverse event of Ostwald ripening. Note that the driving force of this process is still based on the difference in the surface energy between the particles and solution. In the classic Ostwald ripening process, a smaller particle is considered a smooth sphere having a larger surface energy according to the Gibbs–Thomson relationship. On the other hand, in the present case the larger QDs are not spherical and possess an unevenly defective surface so they could be more soluble than the smaller ones.
Surface passivated ultrasmall CdSe QDs from size selective precipitation have been prepared previously.12 In the current study, the ZnS shell precursor was injected into the reaction mixture to overcoat ultrasmall QDs. A direct coating of the high bandgap shell during the growth process without exposing it to the atmosphere saved the processing time and improved the PL efficiency. The estimated QYs of ultrasmall CdSe QDs without overcoating were generally higher than 15%. After overcoating by ZnS, the QYs of QDs generally exceeded 60% without either post light or chemical treatment (Fig. 4a). Fig. 4b shows a TEM image of the CdSe–ZnS QDs. The lattice fringes show that the ultrasmall QDs are highly crystalline. The particles have a closed-shell-like morphology, inferring that the QDs are in a stable crystallographic configuration and have fewer surface dangling bonds. In general, smaller QDs (e.g. < 3 nm) displayed a broad deep-level emission band due to their surface defects,13 which could be caused by an interruption of the QD growth. The ultrasmall QDs in the current study emitted a narrow emission band without deep-level emission. This fact also demonstrates that the ultrasmall QDs possess limited structural defects since they formed in the thermodynamic-based condition.
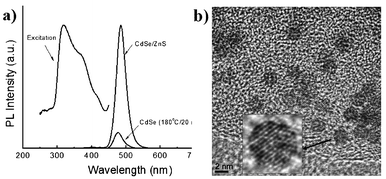 | ||
| Fig. 4 (a) PL spectra of ultrasmall CdSe and core–shell CdSe–ZnS QDs. PL excitation was measured at the maximum PL intensity for the core–shell QDs. (b) TEM image of ultrasmall CdSe–ZnS QDs. The inset image shows a QD in higher resolution. | ||
The particle size of ultrasmall QDs could be varied by the annealing temperature. In the self-purification process (i.e. thermal annealing process), the QD cores recover the crystallinity via self-healing at a moderately high temperature.14 The crystal defects migrate to the QD surface and thus the core–surface interface of the QDs gradually moves outward. A higher annealing temperature could lead to faster self-healing for defective QDs. So the single crystalline core enlarges faster with increasing temperature. Therefore, by varying the annealing temperature to control the moving rate of the core–surface interface, one may prepare ultrasmall QDs in different sizes, as shown in Fig. 2b. The slower moving rate of the interface at low temperature meant the more defective surface lattice could dissolve in solution and thus smaller QDs could be obtained. However, if the temperature was too low, the dissolution of the defective surface could not be effectively carried out due to insufficient thermal energy. The lowest annealing temperature used was 135 °C. If the temperature was too high, the QDs kept growing since the concentration driving force is positive as mentioned previously. By varying the annealing temperature between 135 to 180 °C, ultrasmall QDs with three different sizes overcoated by a monolayer ZnS shell have been prepared in this one-pot approach, as shown in the PL and UV-vis spectra in Fig. 5. Using faster or vigorous mixing would allow smaller QDs to be obtained. This synthetic process required neither rushed experimental operation, nor long reaction times so it would be more reliable and reproducible than conventional growth interruption methods.
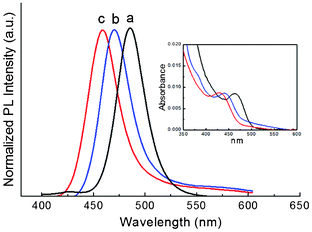 | ||
| Fig. 5 CdSe–ZnS QDs with three different sizes synthesised with isothermal annealing temperatures at 180 °C (curve a), 150 °C (curve b) and 135 °C (curve c) respectively. The emission wavelengths of the samples a, b and c are 455 nm (QY = 72.2%), 468 nm (QY = 85.1%) and 483 nm (QY = 68.8%), respectively. The inset shows UV-vis spectra. All samples were without size separation. | ||
Water-dispersible ultrasmall QDs could be prepared by directly coating as-prepared ultrasmall QDs with PSMA, followed by ring opening of the anhydride rings with EA.8 The surface modification was generally performed by exchanging the TOPO of QDs for hydrophilic molecules. However, the exchange process may damage the ultrasmall QD surface, which degrades their luminescence. PSMA is a hydrophobic polymer containing hydrocarbon functional groups and maleic anhydrides. The hydrocarbon functional groups are compatible with TOPO chains and able to encapsulate the TOPO-coated ultrasmall QDs. After the PSMA overcoating, the maleic anhydrides on the PSMA were transformed to carboxyl and hydroxyl functional groups by reacting them with an amino alcohol (EA), which generates hydrophilic PSMA–EA-overcoated CdSe–ZnS QDs, as shown in the inset in Fig. 6. The PL efficiency is found to further increase about 10% after overcoating by PSMA–EA. The PSMA–EA-overcoated ultrasmall QDs were photostable. After ageing in ambient conditions for more than nine months, degradation of the PL efficiency of PSMA–EA-overcoated ultrasmall QD efficiency was less than 20%. This result is ascribed to better passivation and the carrier confinement provided by the closed-shell structure and the polymer shell (inset).
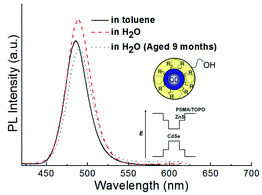 | ||
| Fig. 6 PL spectra from as-prepared (red dashed curve) and aged (blue dashed curve) water-dispersible ultrasmall QDs. The black solid curve is CdSe–ZnS without overcoating. Inset schematically shows the QDs. | ||
The ultrasmall QDs, either oil-soluble or water-soluble, exhibited a bright blue emission in the visible range and good stability so they are promising in electro-optic applications. For example, luminescent QDs have been considered potential nanophosphors in phosphor-converted white or monochromatic light emitting diodes (LEDs).15 The LED is generally realised by dispersing colloidal QDs into a resin such as epoxy or silicone, followed by coating the mixture onto a semiconductor chip.16Fig. 7 gives an electroluminescence spectrum of a surface-mount device (SMD) consisting of a 368 nm UV InGaN chip and QDs red/green/blue pixels printed by an inkjet coater. The spectrum of the device involves three emission peaks from red-, green- and blue-emitting polymer-overcoated CdSe–ZnS QDs. The individual QDs pixels (inset in Fig. 7) can avoid re-absorption of the QDs phosphors in a mixture since red QDs can absorb the emission from green or blue QDs, which decreases the device luminescence efficiency.1d The emitting device with full colour QD phosphors fabricated by inkjet printing demonstrates a promising application of semiconductive QDs for lighting and displays in the future.
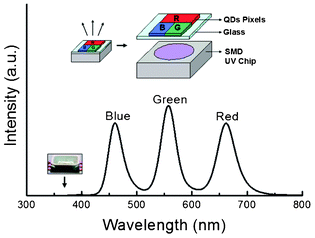 | ||
| Fig. 7 A light device composed of a SMD UV InGaN chip and QD pixels coated on glass. The inset illustration (top) shows the structure of the device and a digital photo of a UV SMD InGaN chip. | ||
Conclusions
In summary, we have developed a synthetic approach to ultrasmall CdSe and CdSe–ZnS QDs with a fairly narrow size distribution in a one-pot synthesis. Instead of controlling crystal size by the growth time or rate in general approaches, ultrasmall QDs were prepared by varying the quenching/isothermal annealing temperature, which would be more operable and reproducible. It is expected that the approach could be applied for other material systems.Acknowledgements
The first author acknowledges the financial support from Cambridge Trusts Overseas Research Scholarship and Ms. J. Y. Huang at the Industrial Technology Research Institute for luminescence measurements.References
- (a) X. Peng, J. Wickham and A. P. Alivisatos, J. Am. Chem. Soc., 1998, 120, 5343 CrossRef CAS; (b) H. S. Chen and R.V. Kumar, J. Phys. Chem. C, 2009, 113, 31 CrossRef CAS; (c) H. S. Chen and R. V. Kumar, Cryst. Growth Des., 2009, 9, 4235 CrossRef CAS; (d) H. S. Chen, H. Y. Hong and R. V. Kumar, J. Mater. Chem., 2011, 21, 5928 RSC.
- C. R. Bullen and P. Mulvaney, Nano Lett., 2004, 4, 2303 CrossRef.
- R. K. Capek, K. Lambert, D. Dorfs, P. F. Smet, D. Poelman, A. Eychmuller and Z. Hens, Chem. Mater., 2009, 21, 1743 CrossRef CAS.
- M. J. Bowers II, J. R. McBride and S. J. Rosenthal, J. Am. Chem. Soc., 2005, 127, 15378 CrossRef.
- S. Kudera, M. Zanella, C. Giannini, A. Rizzo, Y. Li, G. Gigli, R. Cingolani, G. Ciccarella, W. Spahl, W. J. Parak and L. Manna, Adv. Mater., 2007, 19, 548 CrossRef CAS.
- H. Mattoussi, L. H. Radzilowski, B. O. Dabbousi, E. L. Thomas, M. G. Bawendi and M. F. Rubner, J. Appl. Phys., 1998, 83, 7965 CrossRef CAS.
- (a) E. Kucur, J. Ziegler and T. Nann, Small, 2008, 4, 883 CrossRef CAS; (b) F. S. Riehle, R. Bienert, R. Thomann, G. A. Urban and M. Kruger, Nano Lett., 2009, 9, 514 CrossRef CAS.
- (a) E. E. Lees, T. L. Nguyen, A. H. Clayton, B.W. Muir and P. Mulvaney, ACS Nano, 2009, 3, 1121–1128 CrossRef CAS; (b) H. S. Chen, M. Ando and N. Murase, Mater. Lett., 2011, 65, 3146–3149 CrossRef CAS.
- Z. A. Peng and X. Peng, J. Am. Chem. Soc., 2001, 123, 1389 CrossRef CAS.
- (a) T. Sugimoto, Adv. Colloid Interface Sci., 1987, 28, 65 CrossRef CAS; (b) D. V. Talapin, A. L. Rogach, M. Haase and H. Weller, J. Phys. Chem. B, 2001, 105, 12278 CrossRef CAS.
- H. S. Chen and R. V. Kumar, J. Phys. Chem. C, 2009, 113, 12236 CAS.
- A. Rizzo, Y. Li, S. Kudera, F. D. Sala, M. Zanella, W. J. Parak, R. Cingolani, L. Manna and G. Gigli, Appl. Phys. Lett., 2007, 90, 051106 CrossRef.
- M. J. Bowers II, J. R. McBride and S. J. Rosenthal, J. Am. Chem. Soc., 2005, 127, 15378 CrossRef.
- G. M. Dalpian and J. R. Chelikowsky, Phys. Rev. Lett., 2006, 96, 226802 CrossRef.
- (a) H. S. Chen, B. Lo, J. Y. Hwang, G. Y. Chang, C. M. Chen, S. J. Tasi and S. J. Wang, J. Phys. Chem. B, 2004, 108, 17119–17123 CrossRef CAS; (b) H. S. Chen, S. J. J. Wang, C. J. Lo and J. Y. Chi, Appl. Phys. Lett., 2005, 86, 131905 CrossRef; (c) H. S. Chen, R. V. Kumar and H. Y. Hong, Appl. Phys. Lett., 2009, 94, 141107 CrossRef.
- H. S. Chen, C. K. Hsu and H. Y. Hong, IEEE Photonics Technol. Lett., 2006, 18, 193 CrossRef CAS.
| This journal is © The Royal Society of Chemistry 2012 |