A novel soft template strategy to fabricate mesoporous carbon/graphene composites as high-performance supercapacitor electrodes†
Lei
Wang
ab,
Li
Sun
a,
Chungui
Tian
a,
Taixing
Tan
a,
Guang
Mu
a,
Hongxing
Zhang
b and
Honggang
Fu
*ab
aKey Laboratory of Functional Inorganic Material Chemistry, Ministry of Education of the People's Republic of China, Heilongjiang University, Harbin, 150080, P. R. China. Fax: +86-451-86673647; Tel: +86-451-86609115
bState Key Laboratory of Theoretical and Computation Chemistry, Jilin University, Changchun, 130023, P. R. China. E-mail: fuhg@vip.sina.com
First published on 25th June 2012
Abstract
A novel soft template method is developed to synthesize a mesoporous carbon/graphene (MCG) composite. The resulting MCG composite exhibits a outstanding capacitance as high as 242 F g−1 in 6 M KOH electrolyte at the current density of 0.5 A g−1, which is much higher than mesoporous carbon, graphene and a sample made by mechanical mixing of mesoporous carbon with graphene. A series of experimental results show that the thickness, BET surface area and carbonized temperatures seriously affect the structure and energy storage performance of the as-prepared MCG composite. Remarkably, the synthesized MCG composite displays good cyclic stability, and the final capacitance was up to 105% compared to the initial capacitance after 2000 cycles of the composite. The mesoporous carbon in the MCG composite is beneficial to the accessibility and rapid diffusion of the electrolyte, and the graphene in MCG can facilitate the transport of electrons during the processes of charging and discharging owing to its high conductivity, which leads to an excellent energy storage performance.
1. Introduction
Electrochemical capacitors (ECs), also called supercapacitors or ultracapacitors, as energy storage devices have attracted great attention due to their high energy density, high power density and long cycle life.1–3 Predominantly, the electrodes are composed of high surface area carbon-based materials that store energy using ion adsorption (electrochemical double layer capacitors, EDLCs), successful examples are activated carbon,4 mesoporous carbon,5 porous graphitic carbon,6 CNTs,7,8etc. Although carbon materials combined with conductive polymers,9 transition-metal oxides10 or transition-metal hydroxides11 can improve performance for a time by providing pseudo-capacitance of superficial reversible redox reactions between the active energy storage material and the electrolyte, the eigen capacitance of carbon-based materials is very crucial as most of the above pseudo-capacitance materials face the problems of poor conductivity, short cycle life and expensiveness. As a consequence, the development and synthesis of new carbon-based electrode materials with superior energy storage performance is highly desirable.Currently, graphene, a two-dimensional honeycomb nanostructured material of single carbon atoms arranged closely, is regarded as a potential candidate for EDLC electrode materials owing to its outstanding properties of large surface area,12 excellent electron mobility,13 a large potential window and superior electrical performance.14–16 However, the strong van der Waals forces among individual graphene nanosheets lead to their aggregation,17,18 so it is difficult for the porosity in graphene to meet the level required for the rapid diffusion of ions, which makes its performance seriously lower than anticipated. Very recently, combining graphene nanosheets with other carbon nanomaterials, such as fullerene,19 CNTs,20 and carbon black,21 has been demonstrated as an effective way to prevent the graphene nanosheets from aggregating and to improve the energy storage performance of graphene-based materials. Considering mesoporous carbon with plentiful mesoporous tunnels is beneficial to the rapid diffusion of the electrolyte and overcoming the aggregation of the graphene nanosheets,22,23 so we construct a composite of graphene combined with mesoporous carbon, expecting that the composites would not only inherit the excellent electrical conductivity of graphene, but also have the advantages of a mesoporous structure with high mesoporosity and electrolyte-accessibility.
To date, only a hard-template silica route has been reported for synthesis of mesoporous carbon/graphene (MCG) composites. Shubin Yang and co-workers developed a bottom-up hard-template approach to prepare an MCG composite, in which pre-synthesized mesoporous silica/graphene and sucrose were employed as the template and carbon source, respectively, and the resulting material exhibited good lithium ion storage.24 Moreover, Zhibin Lei and co-workers adopted a hard template to prepare mesoporous carbon sphere (MCS)/graphene composites, in which mesoporous silica sphere (MSS)/graphite oxide (GO) must be constructed firstly and then the MSS were used as a template for replicating MCS via a chemical vapor deposition process, and this material exhibited a capacitance of 171 F g−1 in 6 M KOH electrolyte.25 Nevertheless, the hard-template methods must involve the complicated and time-consuming procedures of removal of the template silica, which limits their further application in industry. Therefore, it is both urgent and crucial to develop simple and efficient approaches compatible with mesoporous carbon grown uniformly on graphene with an outstanding performance for preparing MCG composites, which are very significant for ECs.
Herein, we demonstrate a novel and effective soft template strategy for the fabrication of MCG composites. Commercially available triblock copolymer Pluronic F127 was selected as the soft template to prepare the mesoporous carbon precursor of phenol-formaldehyde (PF) prepolymer. After the above prepolymer was mixed with aqueous GO solution uniformly, hydrothermal treatment was carried out to obtain the precursor mesoporous carbon/graphene composites (Fig. 1a). Subsequently, with thermal treatment of the precursor at high temperature under nitrogen, graphene oxide can be reduced to individual graphene without aggregation owing to its combination with mesoporous carbon, hence forming the MCG composites. Generally, surfactant has been used to improve the electrochemical performance of graphene based material.26,27 However, the surfactant F127 used in our fabrication played two roles as follows: one is as the porogent for forming mesoporous carbon; the other is as the structure directing reagent of the mesoporous carbon grown on graphene nanosheets. More importantly, the soft template F127 could be pyrolysed completely during the thermal treatment process. This method avoids the requirement for hard templates which must be removed, and it would be industrially feasible due to its simplicity. The plentiful mesoporous channels in the MCG composite are favorable to the rapid diffusion of ions by providing low-resistance pathways for the ions through the porous electrode material. Moreover, the graphene facilitates the electrons transport during the processes of charging and discharging because of its high conductivity. Such a graphene-based material exhibits outstanding energy storage performance in high-performance supercapacitors.
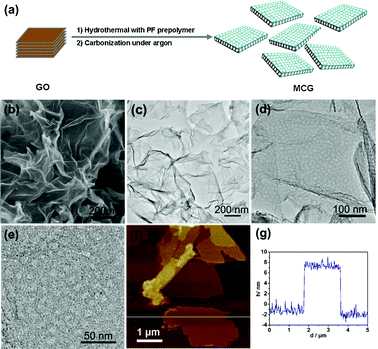 | ||
Fig. 1 (a) Scheme of the preparation process of the MCG composite; (b) SEM, (c–e) TEM and (f) typical AFM images of the as-prepared MCG1 composite with a mass ratio between mesoporous carbon and graphene of 1![[thin space (1/6-em)]](https://www.rsc.org/images/entities/char_2009.gif) : :![[thin space (1/6-em)]](https://www.rsc.org/images/entities/char_2009.gif) 1 prepared at 700 °C; (g) is the corresponding thickness analysis of the white line in the AFM image (f), which revealed a uniform thickness of 10 nm for the MCG1 composite. 1 prepared at 700 °C; (g) is the corresponding thickness analysis of the white line in the AFM image (f), which revealed a uniform thickness of 10 nm for the MCG1 composite. | ||
2. Experimental section
2.1. Synthesis of graphene oxide
Graphene oxide (GO) was prepared following the modified Hummers' method (see ESI†).28 In a typical synthesis, 1 g of expandable graphite (100 μm, Qingdao Graphite Company) and 0.5 g of NaNO3 were mixed with 23 mL 98% H2SO4 in a 100 mL flask in an ice bath with continuous stirring. Then, 3 g of KMnO4 was slowly added to the above solution while keeping the temperature below 5 °C. Next, the ice bath was removed and the flask was heated to 35 °C for 30 min, followed by adding 46 mL deionized water to the solution. The temperature of the solution was rapidly increased to 98 °C and the solution was maintained at this temperature for 30 min. Finally, 60 mL 3% H2O2 was added to the solution until the cessation of gas evolution. The solution was centrifuged and washed by 5% hydrochloric acid and deionized water several times to remove the impurities. The solution was then dried at 40 °C under vacuum for three days to obtain GO powders.2.2. Synthesis of MCG composite
In a typical synthesis, 1.0 g phenol and 3.5 mL formaldehyde aqueous solution (37 wt%) were added to 25 mL 0.1 M NaOH aqueous solution, ultrasonically mixed evenly, and then stirred at 70 °C for 1 h to obtain low-molecular weight phenolic resins. After that, 1.6 g of triblock copolymer Pluronic F127 (Mw = 12![[thin space (1/6-em)]](https://www.rsc.org/images/entities/char_2009.gif) 600, PEO106PPO70PEO106, Aldrich Corp.) dissolved in 110 mL deionized water was added. Then the mixture was stirred at 65 °C for 20 h, and the crimson phenol–formaldehyde (PF) prepolymer solution was obtained finally. After that, 40 mg of GO powder was dispersed in 20 mL of deionized water, and the exfoliation of GO was achieved by ultrasonication. Subsequently, 18.5 mL of the obtained PF prepolymer was added into the above GO solution. Following ultrasonic mixing, the obtained solution was transferred into an autoclave and heated at 130 °C for 20 h with filtration, washed and dried at 40 °C, then the precursor for the synthesis of the mesoporous carbon/graphene (MCG) composite was formed. The MCG composite was obtained after the precursor was carbonized at 700 °C in an argon atmosphere for 3 h and the triblcok copolymer templates were removed during this process (mass ratio between mesoporous carbon and graphene is about 1
600, PEO106PPO70PEO106, Aldrich Corp.) dissolved in 110 mL deionized water was added. Then the mixture was stirred at 65 °C for 20 h, and the crimson phenol–formaldehyde (PF) prepolymer solution was obtained finally. After that, 40 mg of GO powder was dispersed in 20 mL of deionized water, and the exfoliation of GO was achieved by ultrasonication. Subsequently, 18.5 mL of the obtained PF prepolymer was added into the above GO solution. Following ultrasonic mixing, the obtained solution was transferred into an autoclave and heated at 130 °C for 20 h with filtration, washed and dried at 40 °C, then the precursor for the synthesis of the mesoporous carbon/graphene (MCG) composite was formed. The MCG composite was obtained after the precursor was carbonized at 700 °C in an argon atmosphere for 3 h and the triblcok copolymer templates were removed during this process (mass ratio between mesoporous carbon and graphene is about 1![[thin space (1/6-em)]](https://www.rsc.org/images/entities/char_2009.gif) :
:![[thin space (1/6-em)]](https://www.rsc.org/images/entities/char_2009.gif) 1), namely MCG1. For the purpose of studying the effect of the mass ratio between mesoporous carbon and graphene on the structures and performances of the synthesized products, the amount of GO was adjusted to 20 mg, 60 mg and 80 mg and the other experimental parameters were not changed. The corresponding products were named as MCG2, MCG3 and MCG4, respectively. To investigate the influence of carbonization temperature on the structures and performances of the prepared carbon composites, the carbonization temperature was also changed between 600 °C and 800 °C. The corresponding samples were denoted as MCG5 and MCG6, respectively. The detailed experimental parameters and names for all the samples are listed in Table S1†. For comparison, mesoporous carbon (denoted as MC) and reduced graphite oxide (denoted as RGO) were also prepared according to the processes described above. Notably, our method is not only suitable for preparing MCG composites, but also suitable for synthesizing other carbon-based composites, such as mesoporous carbon/CNT composites.
1), namely MCG1. For the purpose of studying the effect of the mass ratio between mesoporous carbon and graphene on the structures and performances of the synthesized products, the amount of GO was adjusted to 20 mg, 60 mg and 80 mg and the other experimental parameters were not changed. The corresponding products were named as MCG2, MCG3 and MCG4, respectively. To investigate the influence of carbonization temperature on the structures and performances of the prepared carbon composites, the carbonization temperature was also changed between 600 °C and 800 °C. The corresponding samples were denoted as MCG5 and MCG6, respectively. The detailed experimental parameters and names for all the samples are listed in Table S1†. For comparison, mesoporous carbon (denoted as MC) and reduced graphite oxide (denoted as RGO) were also prepared according to the processes described above. Notably, our method is not only suitable for preparing MCG composites, but also suitable for synthesizing other carbon-based composites, such as mesoporous carbon/CNT composites.
2.3. Characterization
Scanning electron microscopy (SEM) micrographs were taken out using a Hitachi S-4800 instrument operating at 5 kV. Transmission electron microscopy (TEM) experiments were performed on a JEM-2100 electron microscope (JEOL) with an acceleration voltage of 200 kV. Carbon-coated copper grids were used as the sample holders. AFM images were recorded on a 5100 ALP (prototype Agilent Technologies) in the tapping mode (dynamic force mode). Commercially available Si cantilevers with a force constant of 20 N m−1 were used as the substrate. X-Ray photoemission spectroscopy (XPS) studies were carried out on a Kratos-AXIS ULTRA DLD with an Al-Kα radiation source. The nitrogen adsorption–desorption isotherms of the samples were conducted by using a Micromeritics TriStar II. The samples were outgassed for 10 h at 200 °C under vacuum before the measurements. The pore size distribution was calculated using the Barrett–Joyner–Halenda (BJH) method.2.4. Electrode preparation and electrochemical measurements
The electrochemical performance of the carbon-based materials was tested with a three-electrode system in 6 M KOH aqueous electrolyte solution at room temperature. A saturated calomel electrode (SCE) and a Pt slice were used as the reference and counter electrode, respectively. Electrode materials for the working electrodes were prepared by mixing the carbon-based materials with poly(tetrafluoroethylene) (PTFE) and carbon black, and the weight ratio of carbon-based materials![[thin space (1/6-em)]](https://www.rsc.org/images/entities/char_2009.gif) :
:![[thin space (1/6-em)]](https://www.rsc.org/images/entities/char_2009.gif) PTFE
PTFE![[thin space (1/6-em)]](https://www.rsc.org/images/entities/char_2009.gif) :
:![[thin space (1/6-em)]](https://www.rsc.org/images/entities/char_2009.gif) carbon black = 90
carbon black = 90![[thin space (1/6-em)]](https://www.rsc.org/images/entities/char_2009.gif) :
:![[thin space (1/6-em)]](https://www.rsc.org/images/entities/char_2009.gif) 5
5![[thin space (1/6-em)]](https://www.rsc.org/images/entities/char_2009.gif) :
:![[thin space (1/6-em)]](https://www.rsc.org/images/entities/char_2009.gif) 5. When forming the working electrodes, 5 mg of the above electrode materials was pressed on foam nickel electrodes. The electrochemical performance of the carbon-based materials was examined by testing cyclic voltammograms (CV) and constant current charge–discharge curves. CV curves were measured by a BAS100B electrochemical workstation. Electrochemical impedance spectra (EIS) were performed with a computer-controlled IM6e Impedance Analyzer in a frequency range from 0.01 Hz to 100 kHz at the open circuit potential with a 5 mV amplitude. The constant current charge–discharge capacitance test was carried out using a CHI 660D electrochemical workstation. The charge and discharge voltages ranged between −1.1 and −0.1 V. The capacitance was calculated as in the following formula:29
5. When forming the working electrodes, 5 mg of the above electrode materials was pressed on foam nickel electrodes. The electrochemical performance of the carbon-based materials was examined by testing cyclic voltammograms (CV) and constant current charge–discharge curves. CV curves were measured by a BAS100B electrochemical workstation. Electrochemical impedance spectra (EIS) were performed with a computer-controlled IM6e Impedance Analyzer in a frequency range from 0.01 Hz to 100 kHz at the open circuit potential with a 5 mV amplitude. The constant current charge–discharge capacitance test was carried out using a CHI 660D electrochemical workstation. The charge and discharge voltages ranged between −1.1 and −0.1 V. The capacitance was calculated as in the following formula:29 | (1) |
where C is the capacitance (F g−1), I is the constant discharge current (A), Δt is the discharge time (s), m is the mass of carbon-based material within the electrode (g) and ΔV is the potential range (V).
The columbic efficiency was calculated based on the following equation:30
 | (2) |
where tc and td represent the time of charge and discharge, respectively.
The two-electrode symmetrical cell was assembled with a 2025-type coin cell. The constant current charge–discharge curves between −1.0 and 0.4 V were carried out by a LAND battery tester. The specific capacitance, power and energy density were calculated based on the total mass or volume of anode and cathode materials.31 Energy density was calculated as the following equation:
 | (3) |
where C is the total cell capacitance and V is the cell-operation potential.
The maximum power density was calculated as the following equation:
 | (4) |
where ESR is the equivalent series resistance and m (g) is the total mass of anode and cathode materials.
3. Results and discussion
3.1. Characterization of MCG composites
The nanostructure of the as-prepared graphene-based composite MCG1 with a mass ratio between mesoporous carbon and graphene of 1![[thin space (1/6-em)]](https://www.rsc.org/images/entities/char_2009.gif) :
:![[thin space (1/6-em)]](https://www.rsc.org/images/entities/char_2009.gif) 1 prepared at 700 °C was investigated by scanning electron microscopy (SEM) and transmission electron microscopy (TEM). It can be seen that gauzy graphene sheets without aggregation were obtained from the SEM image as shown in Fig. 1b, however, the reduced graphite oxide (RGO) synthesized under the same experimental parameters was severely aggregated due to the strong van der Waals forces among individual graphene nanosheets (Fig. S1†). This further demonstrates that mesoporous carbon combined with graphene can effectively prevent the aggregation of graphene nanosheets. TEM characterization of the synthesized MCG1 composite disclosed that the mesoporous carbon/graphene composite structure was prepared successfully, with mesoporous carbon grown on the graphene nanosheets uniformly (Fig. 1c–e). A typical AFM image is shown in Fig. 1f, indicating the same morphology of nanosheets as in the observations from TEM images with a uniform thickness of about 10 nm (see Fig. 1g). The pure mesoporous carbon (MC) prepared under the same experimental parameters displays a well ordered mesoporous structure from the TEM image (see Fig. S2†). Fig. 2a shows the nitrogen adsorption/desorption isotherms of the MCG1 composite. The BET surface area of the synthesized MCG1 composite is 545.8 m2 g−1, and the corresponding NLDFT pore size distribution (in the inset of Fig. 2a) exhibited a primary mesopore at 4.0 nm. Compared with RGO (see Fig. S3†, 321.2 m2 g−1), the synthesized MCG1 composite has an improved surface area. This phenomenon is attributed to the effective combination between mesoporous carbon and graphene nanosheets, which could prevent the aggregation of graphene nanosheets. The physicochemical properties for all the samples were summarized in Table S2†.
1 prepared at 700 °C was investigated by scanning electron microscopy (SEM) and transmission electron microscopy (TEM). It can be seen that gauzy graphene sheets without aggregation were obtained from the SEM image as shown in Fig. 1b, however, the reduced graphite oxide (RGO) synthesized under the same experimental parameters was severely aggregated due to the strong van der Waals forces among individual graphene nanosheets (Fig. S1†). This further demonstrates that mesoporous carbon combined with graphene can effectively prevent the aggregation of graphene nanosheets. TEM characterization of the synthesized MCG1 composite disclosed that the mesoporous carbon/graphene composite structure was prepared successfully, with mesoporous carbon grown on the graphene nanosheets uniformly (Fig. 1c–e). A typical AFM image is shown in Fig. 1f, indicating the same morphology of nanosheets as in the observations from TEM images with a uniform thickness of about 10 nm (see Fig. 1g). The pure mesoporous carbon (MC) prepared under the same experimental parameters displays a well ordered mesoporous structure from the TEM image (see Fig. S2†). Fig. 2a shows the nitrogen adsorption/desorption isotherms of the MCG1 composite. The BET surface area of the synthesized MCG1 composite is 545.8 m2 g−1, and the corresponding NLDFT pore size distribution (in the inset of Fig. 2a) exhibited a primary mesopore at 4.0 nm. Compared with RGO (see Fig. S3†, 321.2 m2 g−1), the synthesized MCG1 composite has an improved surface area. This phenomenon is attributed to the effective combination between mesoporous carbon and graphene nanosheets, which could prevent the aggregation of graphene nanosheets. The physicochemical properties for all the samples were summarized in Table S2†.
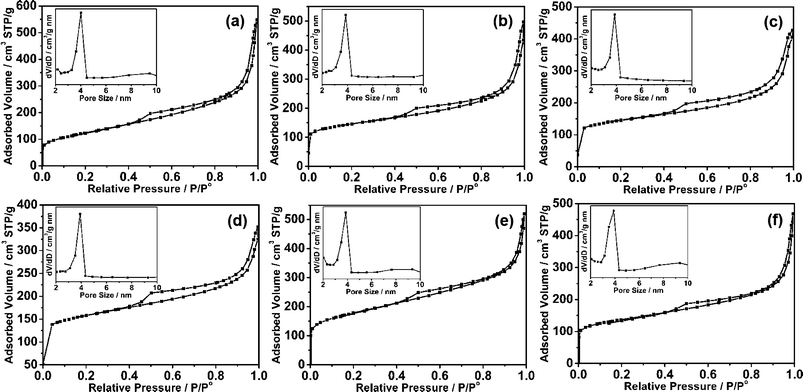 | ||
Fig. 2 Nitrogen adsorption/desorption isotherms of MCG composites synthesized with different mass ratios between mesoporous carbon and graphene, and different carbonization temperatures: (a) MCG1 (mass ratio = 1![[thin space (1/6-em)]](https://www.rsc.org/images/entities/char_2009.gif) : :![[thin space (1/6-em)]](https://www.rsc.org/images/entities/char_2009.gif) 1, 700 °C), (b) MCG2 (mass ratio = 1 1, 700 °C), (b) MCG2 (mass ratio = 1![[thin space (1/6-em)]](https://www.rsc.org/images/entities/char_2009.gif) : :![[thin space (1/6-em)]](https://www.rsc.org/images/entities/char_2009.gif) 2, 700 °C), (c) MCG3 (mass ratio = 2 2, 700 °C), (c) MCG3 (mass ratio = 2![[thin space (1/6-em)]](https://www.rsc.org/images/entities/char_2009.gif) : :![[thin space (1/6-em)]](https://www.rsc.org/images/entities/char_2009.gif) 3, 700 °C), (d) MCG4 (mass ratio = 2 3, 700 °C), (d) MCG4 (mass ratio = 2![[thin space (1/6-em)]](https://www.rsc.org/images/entities/char_2009.gif) : :![[thin space (1/6-em)]](https://www.rsc.org/images/entities/char_2009.gif) 1, 700 °C), (e) MCG5 (mass ratio = 1 1, 700 °C), (e) MCG5 (mass ratio = 1![[thin space (1/6-em)]](https://www.rsc.org/images/entities/char_2009.gif) : :![[thin space (1/6-em)]](https://www.rsc.org/images/entities/char_2009.gif) 1, 600 °C) and (f) MCG6 (mass ratio = 1 1, 600 °C) and (f) MCG6 (mass ratio = 1![[thin space (1/6-em)]](https://www.rsc.org/images/entities/char_2009.gif) : :![[thin space (1/6-em)]](https://www.rsc.org/images/entities/char_2009.gif) 1, 800 °C). 1, 800 °C). | ||
X-Ray photoelectron spectroscopy (XPS) was employed to characterize the surface chemical composition of the as-prepared MCG1. For the GO in Fig. 3a, the main peak at around 284.6 eV is attributed to the graphitic sp2 carbon atom. The bindings for the carbon atoms connecting with the oxygenate groups, namely C–O–C and O–C![[double bond, length as m-dash]](https://www.rsc.org/images/entities/char_e001.gif) O, are located at 286.6 eV and 288.3 eV,32 respectively, and the corresponding contents are about 31.47% and 8.83%. As shown in Fig. 3b, the C1s XPS spectra for the MCG1 sample exhibited a much lower oxygenate group content (only 4.2%), suggesting that the GO was reduced to graphene during the carbonization process. The XPS analyses demonstrate the high quality of the graphene based-carbon products based on the existence of a small amount of oxygen and defect carbon.
O, are located at 286.6 eV and 288.3 eV,32 respectively, and the corresponding contents are about 31.47% and 8.83%. As shown in Fig. 3b, the C1s XPS spectra for the MCG1 sample exhibited a much lower oxygenate group content (only 4.2%), suggesting that the GO was reduced to graphene during the carbonization process. The XPS analyses demonstrate the high quality of the graphene based-carbon products based on the existence of a small amount of oxygen and defect carbon.
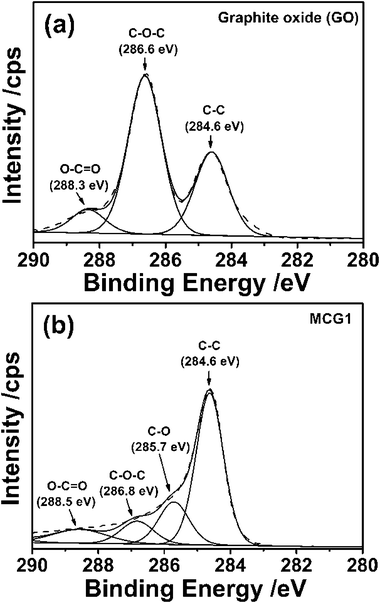 | ||
| Fig. 3 High-resolution XPS spectra of C1s for (a) GO and (b) MCG1 composite. | ||
Notably, the GO ratio significantly affects the structure of the obtained MCG composites. The MCG2, MCG3 and MCG4 composites with a mass ratio between mesoporous carbon and graphene of 2![[thin space (1/6-em)]](https://www.rsc.org/images/entities/char_2009.gif) :
:![[thin space (1/6-em)]](https://www.rsc.org/images/entities/char_2009.gif) 1, 2
1, 2![[thin space (1/6-em)]](https://www.rsc.org/images/entities/char_2009.gif) :
:![[thin space (1/6-em)]](https://www.rsc.org/images/entities/char_2009.gif) 3 and 1
3 and 1![[thin space (1/6-em)]](https://www.rsc.org/images/entities/char_2009.gif) :
:![[thin space (1/6-em)]](https://www.rsc.org/images/entities/char_2009.gif) 2, respectively, were also studied. Although the GO ratio is changed, the loose planar nanostructure could be obtained from the AFM images as shown in Fig. 4a–c. Moreover, the thicknesses of the MCG2, MCG3 and MCG4 composites are 6, 16 and 20 nm, respecively, which could be evidenced from the thickness analyses in Fig. 4d–f. Therefore, it can be concluded that the thickness of the obtained composites increases with the increase of GO ratio. This may be due to the content of mesoporous carbon not being sufficient to completely prevent the aggregation of a large amount of the graphene nanosheets. Moreover, it can be observed that the BET surface area decreases with the increase of GO ratio, which is attributed to the increase of thickness of the synthesized MCG composites (see Fig. 2 and Table S2†). Additionally, the increase of carbonization temperature from 600 °C to 800 °C leads to a decrease of BET surface area from 698.6 m2 g−1 (MCG5, 600 °C) to 507.5 m2 g−1 (MCG6, 800 °C) (see Fig. 2 and Table 1). This may be attributed to the higher carbonization temperature improving the crystallinity of the MCG composites, resulting in a decrease of BET surface area.
2, respectively, were also studied. Although the GO ratio is changed, the loose planar nanostructure could be obtained from the AFM images as shown in Fig. 4a–c. Moreover, the thicknesses of the MCG2, MCG3 and MCG4 composites are 6, 16 and 20 nm, respecively, which could be evidenced from the thickness analyses in Fig. 4d–f. Therefore, it can be concluded that the thickness of the obtained composites increases with the increase of GO ratio. This may be due to the content of mesoporous carbon not being sufficient to completely prevent the aggregation of a large amount of the graphene nanosheets. Moreover, it can be observed that the BET surface area decreases with the increase of GO ratio, which is attributed to the increase of thickness of the synthesized MCG composites (see Fig. 2 and Table S2†). Additionally, the increase of carbonization temperature from 600 °C to 800 °C leads to a decrease of BET surface area from 698.6 m2 g−1 (MCG5, 600 °C) to 507.5 m2 g−1 (MCG6, 800 °C) (see Fig. 2 and Table 1). This may be attributed to the higher carbonization temperature improving the crystallinity of the MCG composites, resulting in a decrease of BET surface area.
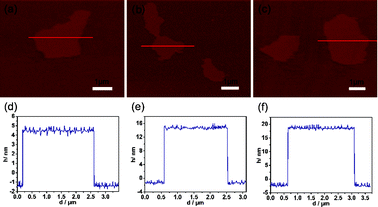 | ||
| Fig. 4 AFM images of the MCG composites: (a) MCG2, (b) MCG3 and (c) MCG4; and the corresponding thickness analyses of the red lines in the AFM images are displayed in (d) MCG2, (e) MCG3 and (f) MCG4. The thicknesses of the MCG2, MCG3 and MCG4 composites calculated based on the AFM analyses are about 6, 16 and 20 nm, respectively. | ||
| Samples | Mass ratio of mesoporous carbon and graphene | Carbonization T (°C) | BET (m2 g−1) | Thickness (nm) | Specific capacitances (F g−1 at 0.5 A g−1) |
|---|---|---|---|---|---|
| MCG1 | 1![[thin space (1/6-em)]](https://www.rsc.org/images/entities/char_2009.gif) : :![[thin space (1/6-em)]](https://www.rsc.org/images/entities/char_2009.gif) 1 1 |
700 | 545.8 | 10 | 242 |
| MCG2 | 2![[thin space (1/6-em)]](https://www.rsc.org/images/entities/char_2009.gif) : :![[thin space (1/6-em)]](https://www.rsc.org/images/entities/char_2009.gif) 1 1 |
700 | 582.3 | 6 | 190 |
| MCG3 | 2![[thin space (1/6-em)]](https://www.rsc.org/images/entities/char_2009.gif) : :![[thin space (1/6-em)]](https://www.rsc.org/images/entities/char_2009.gif) 3 3 |
700 | 485.8 | 16 | 170 |
| MCG4 | 1![[thin space (1/6-em)]](https://www.rsc.org/images/entities/char_2009.gif) : :![[thin space (1/6-em)]](https://www.rsc.org/images/entities/char_2009.gif) 2 2 |
700 | 411.7 | 20 | 159 |
| MCG5 | 1![[thin space (1/6-em)]](https://www.rsc.org/images/entities/char_2009.gif) : :![[thin space (1/6-em)]](https://www.rsc.org/images/entities/char_2009.gif) 1 1 |
600 | 698.6 | 10 | 153 |
| MCG6 | 1![[thin space (1/6-em)]](https://www.rsc.org/images/entities/char_2009.gif) : :![[thin space (1/6-em)]](https://www.rsc.org/images/entities/char_2009.gif) 1 1 |
800 | 507.5 | 10 | 173 |
3.2. Capacitive performance
In recent years, graphene and mesoporous carbon have been applied to supercapacitors electrodes, because of their self-characteristics.33,34 Owing to the special structure of the MCG composites, they would be anticipated to possess high mesoporosity and electrolyte-accessibility like mesoporous carbon, and to eb able to facilitate electron transport due to the highly conductive nature of graphene. Therefore, it could be used as a kind of potential supercapacitor electrode material. The electrochemical testing was carried out by a three-electrode system in 6 M KOH electrolyte at room temperature and the results are listed in Fig. 5. It can be deduced that the electrodes exhibit EDLC behavior due to the quasi rectangular-shape of the cyclic voltammogram (CV) plots under different scan rates as shown in Fig. 5a. Moreover, the quasi rectangular-shape is maintained well even at the high scan speed of 100 mV s−1, demonstrating the ability of rapid ion diffusion of this material, which resulted in the excellent specific capacitance. The galvanostatic charge/discharge cycling curves for the MCG1 composite at different current densities are shown in Fig. 5b, and the quasi triangular-shape of the curves revealed EDLC behavior for the MCG1 electrode.35 The specific capacitances calculated from the galvanostatic charge/discharge curves are summarized in Table S3†. The specific capacitance calculated from the galvanostatic charge/discharge curve is up to 242 F g−1 at the current density of 0.5 A g−1. When the current density was increased to 1, 2 and then to 4 A g−1, the specific capacitances of MCG1 decreased to 203, 168 and 154 F g−1, respectively. Such a decrease is attributed to the insufficient time available for ion diffusion and adsorption inside the smallest pores within the large particles.36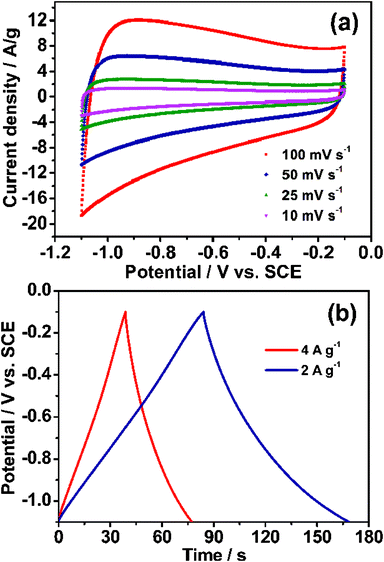 | ||
| Fig. 5 Electrochemical characterization of the synthesized MCG1 in 6 M KOH electrolyte at room temperature: (a) CV curves for MCG1 tested at different scan rates; (b) galvanostatic charge/discharge curves for MCG1 measured at the current densities of 2 and 4 A g−1, revealed a typical characterization of an EDLC. | ||
The capacitive properties for the composites prepared at the carbonization temperature of 700 °C with different mass ratios between mesoporous carbon and graphene were also tested and the results as shown in Table S3†. The specific capacitances for MCG2 (mass ratio = 2![[thin space (1/6-em)]](https://www.rsc.org/images/entities/char_2009.gif) :
:![[thin space (1/6-em)]](https://www.rsc.org/images/entities/char_2009.gif) 1, thickness of 6 nm, BET surface area of 582.3 m2 g−1), MCG3 (mass ratio = 2
1, thickness of 6 nm, BET surface area of 582.3 m2 g−1), MCG3 (mass ratio = 2![[thin space (1/6-em)]](https://www.rsc.org/images/entities/char_2009.gif) :
:![[thin space (1/6-em)]](https://www.rsc.org/images/entities/char_2009.gif) 3, thickness of 16 nm, BET surface area of 485.8 m2 g−1) and MCG4 (mass ratio = 1
3, thickness of 16 nm, BET surface area of 485.8 m2 g−1) and MCG4 (mass ratio = 1![[thin space (1/6-em)]](https://www.rsc.org/images/entities/char_2009.gif) :
:![[thin space (1/6-em)]](https://www.rsc.org/images/entities/char_2009.gif) 2, thickness of 20 nm, BET surface area of 411.7 m2 g−1) are 190, 170 and 159 F g−1 under a current density of 0.5 A g−1, respectively. Furthermore, the specific capacitances for MCG composites with a mass ratio between mesoporous carbon and graphene of 1
2, thickness of 20 nm, BET surface area of 411.7 m2 g−1) are 190, 170 and 159 F g−1 under a current density of 0.5 A g−1, respectively. Furthermore, the specific capacitances for MCG composites with a mass ratio between mesoporous carbon and graphene of 1![[thin space (1/6-em)]](https://www.rsc.org/images/entities/char_2009.gif) :
:![[thin space (1/6-em)]](https://www.rsc.org/images/entities/char_2009.gif) 1 prepared at different carbonization temperatures, namely MCG5 (600 °C, BET surface area of 698.6 m2 g−1) and MCG6 (800 °C, BET surface area of 507.5 m2 g−1), are 153 and 173 F g−1 at the current density of 0.5 A g−1 (see Table S3†), respectively, which is much lower than that of the MCG1 prepared at the carbonization temperature of 700 °C (242 F g−1). The relationship between the physical properties and the specific capacitances of the MCG composites was summarized in Table 1. Consequently, it can be concluded that the mass ratio between mesoporous carbon and graphene, carbonization temperature and thickness are the key factors for MCG composites in the supercapacitors electrodes.
1 prepared at different carbonization temperatures, namely MCG5 (600 °C, BET surface area of 698.6 m2 g−1) and MCG6 (800 °C, BET surface area of 507.5 m2 g−1), are 153 and 173 F g−1 at the current density of 0.5 A g−1 (see Table S3†), respectively, which is much lower than that of the MCG1 prepared at the carbonization temperature of 700 °C (242 F g−1). The relationship between the physical properties and the specific capacitances of the MCG composites was summarized in Table 1. Consequently, it can be concluded that the mass ratio between mesoporous carbon and graphene, carbonization temperature and thickness are the key factors for MCG composites in the supercapacitors electrodes.
| Samples | R s (Ω) | R ct (Ω) | Z w (Ω) | C (F) | Q (F) |
|---|---|---|---|---|---|
| MCG1 | 0.1823 | 0.2081 | 0.2158 | 0.2007 | 0.5314 |
| RGO | 0.2602 | 0.3549 | 2.565 | 0.003331 | 0.05958 |
| MC | 0.2768 | 0.3622 | 3.287 | 0.02668 | 0.0496 |
For comparison with MCG1, the capacitive behaviors of the MC, RGO and a sample formed by physical mixing of mesoporous carbon with graphene (weight ratio = 1![[thin space (1/6-em)]](https://www.rsc.org/images/entities/char_2009.gif) :
:![[thin space (1/6-em)]](https://www.rsc.org/images/entities/char_2009.gif) 1), namely (MC+RGO), were also measured, and the curves of specific capacitance against current density are shown in Fig. 6a. As expected, the highest specific capacitance is observed for the MCG1 composite. The specific capacitances for MC, RGO and MC+RGO are 136, 95 and 142 F g−1 at the current density of 0.5 A g−1, respectively. Notably, the MCG1 electrode also exhibits an extremely higher capacitance of 136 F g−1, at an current density as high as 10 A g−1, than that of the MC, RGO and MC+RGO electrodes, this value is much higher than that of the reported graphene-based carbon electrode materials.37 The superior performance should be attributed to the special structure of the MCG composite, demonstrating that the effective building of the MCG composite indeed plays a significant role in the electrode material of supercapacitors.
1), namely (MC+RGO), were also measured, and the curves of specific capacitance against current density are shown in Fig. 6a. As expected, the highest specific capacitance is observed for the MCG1 composite. The specific capacitances for MC, RGO and MC+RGO are 136, 95 and 142 F g−1 at the current density of 0.5 A g−1, respectively. Notably, the MCG1 electrode also exhibits an extremely higher capacitance of 136 F g−1, at an current density as high as 10 A g−1, than that of the MC, RGO and MC+RGO electrodes, this value is much higher than that of the reported graphene-based carbon electrode materials.37 The superior performance should be attributed to the special structure of the MCG composite, demonstrating that the effective building of the MCG composite indeed plays a significant role in the electrode material of supercapacitors.
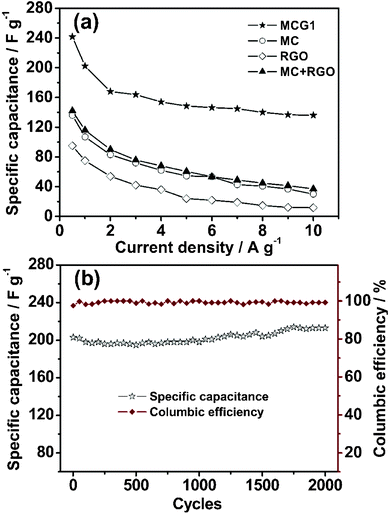 | ||
| Fig. 6 (a) Specific capacitance retention with current density for the synthesized MCG1, and MC, RGO and MC+RGO for comparison. (b) Dependencies of the discharge specific capacitance and the columbic efficiency on the charge/discharge cycle numbers of MCG1 at a current density of 1 A g−1 within the potential window range from −1.1 to −0.1 V (2000 cycles). The charge/discharge cycles were tested in 6 M KOH electrolyte. | ||
Electrochemical impedance spectroscopy (EIS) is a principal method to examine the fundamental behavior of electrode materials for supercapacitors. The impedances for MCG1, RGO and MC tested in the frequency range of 0.01 Hz to 100 kHz at the open circuit potential with a 5 mV amplitude are shown in Fig. 7a. The radius of the semicircle impedance loop in the high frequency region could reflect the resistance to mass transfer/diffusion rate of ions through the mesoporous structure of the carbon material.38 It can be seen that the MCG1 composite has the smallest resistance of electrolyte transport, further demonstrating that the special structure of the MCG1 composite could provide a shortened path for electron transport and electrolyte penetration compared with RGO and MC. Furthermore, the measured impedance spectra analyzed using the coupled nonlinear Schrodinger equation (CNLS) fitting method based on the equivalent circuit is in the inset of Fig. 7a. The equivalent circuit model exhibits that the whole capacitor circuit is constituted by Rs, Zw, Rct, C and Q as shown in Fig. 7b. Rs is the sum of the contact resistance and material resistance, which is related to the ionic conductivity of the electrolyte and electronic conductivity of the electrodes and current collectors.39Zw is the Warburg resistance related to the ion diffusion/transport in the electrolyte.40Rct is the resistance for blocking ions from entering the pores of electrode materials, and also for blocking the movement of ions in solution and separator. C and Q refer to the capacitor layer which formed during the charge–discharge process. The calculated values of impedance for MCG1, RGO and MC electrode materials by using ZSimpWin software are summarized in Table 2. Obviously, the MCG1 electrode material exhibits the smaller Rs value of 0.1823 Ω compared with the RGO and MC electrode materials, indicating that the MCG1 electrode material has a lower contact resistance and better conductivity than those of MC and RGO. Moreover, compared to RGO and MC electrodes, the straight line for the MCG1 electrode at the low frequency region is much closer to 90°, implying that the special structure of MCG1 could have the better capacitance characteristics (vertical line for an ideal capacitor).
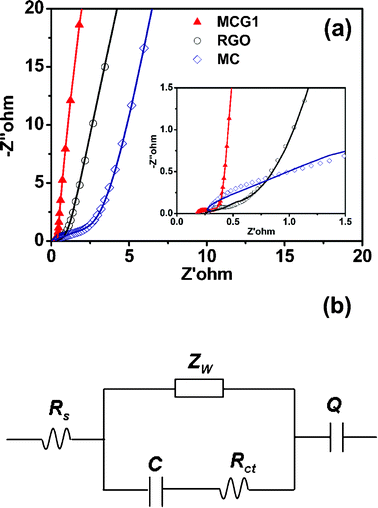 | ||
| Fig. 7 (a) Nyquist plots of the experimental impedance data (scattered points) and the fitting results (solid lines) for the MCG1 composite, RGO and MC, the inset shows the expanded high-frequency region of the plots (10 mHz to 100 kHz, ac amplitude, 5 mV). (b) Shows the corresponding electrical equivalent circuit that was used to fit the impedance spectra. | ||
The stability of an electrode material of a supercapacitor is of great importance to its practical application. Cycling stability tests over 2000 cycles for the MCG1 composite at a current density of 1 A g−1 are shown in Fig. 6b. The MCG1 composite exhibits a good long-term electrochemical stability, and a capacitance increase of ca. 5% of the initial capacitance after 2000 cycles has been observed. A similar trend has been generally reported for RGO-based materials.37,41,42 This abnormal increase in capacitive effect can be attributed to the reduction of the small amount of oxygen groups in the electrode material. Moreover, the columbic efficiency remains above 99% after 2000 cycles (see Fig. 6b). The repetitive charge/discharge cycling does not induce noticeable changes in the structure of the MCG1 composite and the peeling off of electrode material of the MCG1 composite from the nickel foam does not occur. The synthesized MCG1 composite exhibits a much better cycling stability and excellent reversibility in the repetitive charge–discharge cycling compared to that of the previously reported graphene-based materials.25 This should be attributed to the activation of electrode material and the increase of effective interfacial area between the MCG electrode and the electrolyte with the increase of reaction time, indicating a potential application in supercapacitors. To investigate this promising application, a symmetric capacitor consisting of MCG1 as both the negative electrode and the positive electrode was assembled by a 2025-type coin cell. The specific capacitance is about 43.6 F g−1 based on the total mass of the two electrodes at a current density of 1 A g−1. The Ragone plot of the MCG1 composite based symmetric supercapacitors (MCG1/MCG1) in a 6 M KOH electrolyte are shown in Fig. 8. The specific energy density of up to 17.3 W h kg−1 is achieved at an extreme low power density and 15.5 W h kg−1 is retained at a power density as high as 8.9 W kg−1, which is much higher than that of the MCG composite synthesized by the reported hard-template route (3.3 W h kg−1 at 4.2 W kg−1).25 These results further demonstrate the MCG composite synthesized by the present soft-template approach could be used as an outstanding energy storage material.
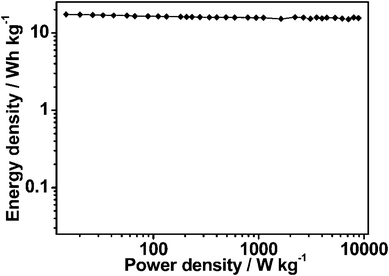 | ||
| Fig. 8 Ragone plot of the two-electrode symmetric supercapacitor made from the MCG1 composite in 6 M KOH electrolyte. | ||
Based on the above analyses, we assumed the scheme of the charging process as shown in Fig. 9. It can be seen that the plentiful mesoporous tunnels in the MCG composite are favorable for the accessibility of the electrolyte and the rapid diffusion of K+ ions. Furthermore, both mesoporous carbon and graphene can play the part of mini-current collectors that are dispersed homogeneously in the electrode. Besides, the existence of graphene will accelerate the electron transport during the processes of charging and discharging because of its high conductivity. When the layer of mesoporous carbon coated onto the graphene nanosheets is too thick, it will result in a poor conductivity due to the intrinsic conductivity of mesoporous carbon being much weaker than that of graphene. Simultaneously, it does not facilitate the rapid diffusion of electrolyte owing to the thicker mesoporous carbon with longer channels of mesopores, and as a result producing a relatively lower capacitance (MCG2 composite). On the contrary, if the layer of coated mesoporous carbon is too thin, it will lead to the incomplete coating and aggregation of graphene nanosheets, which is not beneficial to the diffusion of the electrolyte and the transport of electrons among the graphene nanosheets (MCG3 and MCG4 composites). Therefore, only a moderate thickness of mesoporous carbon coating on graphene nanosheets can meet the requirements of both the rapid diffusion of K+ ions and the transport of electrons, resulting in an excellent capacitive performance, such as in the MCG1 composite.
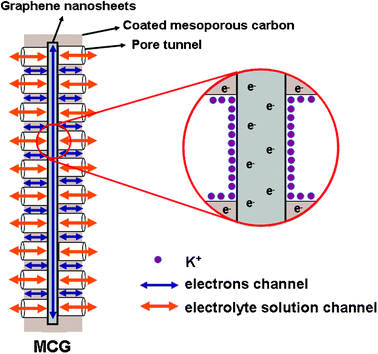 | ||
| Fig. 9 Scheme of the charging status of MCG composite. | ||
Conclusions
In summary, we have demonstrated a novel and effective soft-template route to synthesize MCG composites. The synthesized MCG1 composite has an excellent capacitance of 242 F g−1 at a current density of 0.5 A g−1. The as-prepared MCG1 composite exhibited a higher capacitance than the MC, RGO and MC+RGO. Notably, the final capacitance was up to 105% compared to the initial capacitance and the columbic efficiency was above 99% after 2000 cycles at a current density of 1 A g−1. Moreover, the energy density achieved was as high as 15.5 W h kg−1 at a power density of 8.8 kW kg−1 shown by a two-electrode supercapacitor test. Additionally, the results indicate that the weight ratio between mesoporous carbon and graphene, carbonization temperature and thickness are very significant for the structure and energy storage performance of the MCG composites. It is assumed that the mesoporous carbon in the MCG composite is favorable to the accessibility of the electrolyte and the rapid diffusion of K+ ions, and the existence of graphene could facilitate the transport of electrons during the processes of charging and discharging because of its high conductivity, which leads to the outstanding energy storage performance. It is demonstrated that the synthesized MCG composite could be used as an advanced carbon electrode material for high-performance supercapacitors. In brief, our results may provide new ways for the facile and effective synthesis of MCG composites which display excellent performance in electrode materials for supercapacitors.Acknowledgements
We gratefully acknowledge the support of the Key Program Projects of the National Natural Science Foundation of China (no 21031001), the National Natural Science Foundation of China (no 20971040, 91122018, 21101061), the Cultivation Fund of the Key Scientific and Technical Innovation Project, Ministry of Education of China (no 708029), Youth Foundation of Heilongjiang Province of China (QC2010021).References
- B. E. Conway, Electrochemical Supercapacitors. Scientific Fundamentals and Technological Applications, Kluwer Academic Publishers, Plenum Press: New York, 1999 Search PubMed.
- M. Winter and R. J. Brodd, Chem. Rev., 2004, 104, 4245 CrossRef CAS.
- J. R. Miller and P. Simon, Science, 2008, 321, 651 CrossRef CAS.
- T. A. Centeno and F. Stoeckli, J. Power Sources, 2006, 154, 314 CrossRef CAS.
- W. Zhang, Z. Huang, C. Zhou, G. Cao, F. Kang and Y. Yang, J. Mater. Chem., 2012, 22, 7158 RSC.
- D. W. Wang, F. Li, M. Liu, G. Q. Lu and H. M. Cheng, Angew. Chem. Int. Ed., 2008, 47, 373 CrossRef CAS.
- H. Zhang, G. P. Cao and Y. S. Yang, Energy Environ. Sci., 2009, 2, 932 CAS.
- G. Lota, K. Fic and E. Frackowiak, Energy Environ. Sci., 2011, 4, 1592 CAS.
- J. Wang, Y. L. Xu, X. Chen and X. F. Sun, Compos. Sci. Technol., 2007, 67, 2981 CrossRef CAS.
- Y. Hou, Y. Cheng, T. Hobson and J. Liu, Nano Lett., 2010, 10, 2727 CrossRef CAS.
- J. Zhang, L. B. Kong, J. J. Cai, H. Li, Y. C. Luo and L. Kang, Microporous Mesoporous Mater., 2010, 132, 154 CrossRef CAS.
- M. D. Stoller, S. J. Park, Y. W. Zhu, J. H. An and R. S. Ruoff, Nano Lett., 2008, 8, 3498 CrossRef CAS.
- Y. Wang, Y. Shao, D. W. Matson, J. Li and Y. Lin, ACS Nano, 2010, 4, 1790 CrossRef CAS.
- W. Lv, D. M. Tang, Y. B. He, C. H. You, Z. Q. Shi, X. C. Chen, C. M. Chen, P. X. Hou, X. Liu and Q. H. Yang, ACS Nano, 2010, 3, 3730 CrossRef.
- C. M. Chen, Q. Zhang, C. H. Huang, X. C. Zhao, B. S. Zhang, Q. Q. Kong, M. Z. Wang, Y. G. Yang, R. Caia and D. S. Su, Chem. Commun., 2012, 48, 7149–7151 RSC.
- C. M. Chen, Q. Zhang, M. G. Yang, C. H. Huang, Y. G. Yang and M. Z. Wang, Carbon, 2012, 50, 3572 CrossRef CAS.
- Y. Si and E. Samulski, Nano Lett., 2008, 8, 1679 CrossRef CAS.
- D. Li, M. Muller, S. Gilje, R. Kaner and G. Wallace, Nat. Nanotechnol., 2008, 3, 101 CrossRef CAS.
- E. Yoo, J. Kim, E. Hosono, H. S. Zhou, T. Kudo and I. Honma, Nano Lett., 2008, 8, 2277 CrossRef CAS.
- Z. Fan, J. Yan, L. Zhi, Q. Zhang, T. Wei, J. Feng, M. Zhang, W. Qian and F. Wei, Adv. Mater., 2010, 22, 3723 CrossRef CAS.
- J. Yan, T. Wei, B. Shao, F. Ma, Z. Fan, M. Zhang, C. Zheng, Y. Shang, W. Qian and F. Wei, Carbon, 2010, 48, 1731 CrossRef CAS.
- Z. Fan, Y. Liu, J. Yan, G. Ning, Q. Wang, T. Wei, L. Zhi and F. Wei, Adv. Energy Mater., 2012, 2, 419 CrossRef CAS.
- C. H. Huang, Q. Zhang, T. C. Chou, C. M. Chen, D. S. Su and R. A. Doong, ChemSusChem, 2012, 5, 563 CrossRef CAS.
- S. Yang, X. Feng, L. Wang, K. Tang, J. Maier and K. Müllen, Angew. Chem. Int. Ed., 2010, 49, 4795 CrossRef CAS.
- Z. Lei, N. Christov and X. S. Zhao, Energy Environ. Sci., 2011, 4, 1866 CAS.
- D. A. C. Brownson and C. E. Banks, Electrochem. Commun., 2011, 13, 111 CrossRef CAS.
- D. A. C. Brownson, J. P. Metters, D. K. Kampouris and C. E. Banks, Electroanalysis, 2011, 23, 894 CrossRef CAS.
- W. S. Hummers and R. E. Offeman, J. Am. Chem. Soc., 1958, 80, 1339 CrossRef CAS.
- D. Qu and H. Shi, J. Power Sources, 1998, 74, 99 CrossRef CAS.
- G. Wang, J. Huang, S. Chen, Y. Gao and D. Cao, J. Power Sources, 2011, 196, 5756 CrossRef CAS.
- Z. Chen, J. Wen, C. Yan, L. Rice, H. Sohn, M. Shen, M. Cai, B. Dunn and Y. Lu, Adv. Energy Mater., 2011, 1, 55 Search PubMed.
- A. J. Patil, J. L. Vickery, T. B. Scott and S. Mann, Adv. Mater., 2009, 21, 3159 CrossRef CAS.
- Y. Sun, Q. Wu and G. Shi, Energy Environ. Sci., 2011, 4, 1113 CAS.
- P. J. Hall, M. Mirzaeian, S. I. Fletcher, F. B. Sillars, A. J. R. Rennie, G. O. Shitta-Bey, G. Wilson, A. Cruden and R. Carter, Energy Environ. Sci., 2010, 3, 1238 CAS.
- J. Zhang, J. Jiang and X. S. Zhao, J. Phys. Chem. C, 2011, 115, 6448 CAS.
- L. Wei, M. Sevilla, A. B. Fuertes, R. Mokaya and G. Yushin, Adv. Energy Mater., 2011, 1, 356 CrossRef CAS.
- S. H. Aboutalebi, A. T. Chidembo, M. Salari, K. Konstantinov, D. Wexler, K. H. Liu and S. X. Dou, Energy Environ. Sci., 2011, 4, 1855 CAS.
- W. Li, F. Zhang, Y. Dou, Z. Wu, H. Liu, X. Qian, D. Gu, Y. Xia, B. Tu and D. Zhao, Adv. Energy Mater., 2011, 1, 382 CrossRef CAS.
- X. He, Y. Geng, J. Qiu, M. Zheng, S. Long and X. Zhang, Carbon, 2010, 48, 1662 CrossRef CAS.
- M. D. Stoller, S. Park, Y. Zhu, J. An and R. S. Ruoff, Nano Lett., 2008, 8, 3498 CrossRef CAS.
- Y. Shao, J. Wang, M. Engelhard, C. Wang and Y. Lin, J. Mater. Chem., 2010, 20, 743 RSC.
- Y. Chen, X. Zhang, D. Zhang, P. Yu and Y. Ma, Carbon, 2011, 49, 573 CrossRef CAS.
Footnote |
| † Electronic supplementary information (ESI) available. See DOI: 10.1039/c2ra20845h/ |
| This journal is © The Royal Society of Chemistry 2012 |
