Hollow SnO2 microspheres for high-efficiency bilayered dye sensitized solar cell
Jing
Chen†
*a,
Chen
Li†
a,
Feng
Xu†
b,
Yidan
Zhou
a,
Wei
Lei
a,
Litao
Sun
b and
Yan
Zhang
c
aSchool of Electronic Science and Engineering, Southeast University, Nanjing, 210096, China. E-mail: chenjing@seu.edu.cn; Fax: +86-25-83792662; Tel: +86-25-83792650
bSEU-FEI Nano-Pico Center, Key Laboratory of MEMS of Ministry of Education, Southeast University, Nanjing, 210096, China. E-mail: fxu@seu.edu.cn
cElectrical Engineering Division, Engineering Department, University of Cambridge, 9 JJ Thomson Avenue CB3 0FA, Cambridge, UK. E-mail: yz236@cam.ac.uk
First published on 27th June 2012
Abstract
We synthesized hollow SnO2 microspheres using a hydrothermal method and fabricated bilayered dye sensitized solar cells (DSSCs) with hollow SnO2 microspheres as the top layer and TiO2 as the bottom layer. Due to the reduced transfer resistance, faster diffusion constants, and enhanced light harvesting, the performance of the bilayered DSSC with SnO2 top layer was better than that without SnO2 top layer. A maximum power conversion efficiency (PCE) of 4.15% was obtained for this bilayered DSSC under illumination of one sun (AM 1.5 G, 100 mW cm−2), which exhibited a 19% improvement compared to the QDSSC without a SnO2 layer.
1. Introduction
Dye sensitized solar cells (DSSC) have received considerable research interest due to their low cost, simple fabrication process and relatively high conversion efficiencies1–3.It is well accepted that the performance of DSSCs can be dominated by several factors, for example, the light harvesting ability of dyes, the electron transport rate at the semiconductor interface and the diffusion velocity of electrolyte. Compared to TiO2, SnO2 has a faster electron diffusion rate due to its higher electron-mobility (SnO2, 125–250 cm2 V−1 s−1; TiO2, 0.1∼1.0 cm2 V−1 s−1)4,5. In addition, SnO2 has other unique advantages suitable for a DSSC photoanode. For instance, the larger band gap for SnO2 (3.6 eV) than TiO2 (3.2 eV) can create fewer oxidative holes in the valence band to facilitate the long-term stability of DSSCs6,7. In addition, SnO2 can be used as a reflecting layer, improving the photocurrent density and efficiency due to the Mie scattering effect8.However, few SnO2 nanostructure based DSSCs have been reported and the efficiency is rather low. Qian et al. reported TiO2 coated SnO2 hollow microspheres as a bifunctional photoelectrode material in DSSCs for improving efficiency6. Koo et al. obtained over 10% efficiency for a DSSC with a nano-embossed hollow spherical TiO2 particulate film as an overlayer on a nanocrystalline TiO2 film9. Herein, we reported on the bilayered DSSC using hollow SnO2 microspheres as the top layer and TiO2 as the bottom layer. Taking advantage of the hollow SnO2 structure, the photoanode within the SnO2 hollow microspheres enhances the light harvesting due to multiple light reflections and scattering in the DSSC. Meanwhile, the bilayered photoanode can help improve the energy conversion efficiency by tuning the film structure from monolayer to multilayer10. The hollow SnO2 microspheres were synthesized by a hydrothermal method. A power conversion efficiency (PCE) for the bilayered DSSC of 4.15% was obtained in this work.
2. Experimental
SnO2 was synthesized through a hydrothermal method and the procedure was described elsewhere11. Briefly, 1.75 g Tin(IV) chloride, 1.71 g D–(+)-glucose, 10 ml deionized water, and 1 mmol or 5 mmol sulfuric acid were mixed together and reacted at 190 °C for 24 h. The precipitates were obtained and dried at 600 °C for 3 h. Two kinds of SnO2 hollow microspheres with sizes of 200 nm and 600 nm were prepared. 0.5 g ethylcellulose was added to 5 ml ethanol and stirred for 30 min to form a clear gel. After that, 0.1 g SnO2 powder and 0.4 g terpineol were added into the gel, and then stirred continually to form a homogenous white paste. A 10 μm thick TiO2 film (Ti-Nanoxide T/SP, Solaronix) and a 2.0 μm thick SnO2 film were deposited on FTO glass (SnO2: F, Solaronix) sequentially by the doctor blading method. A bare 12 μm thick TiO2 film was fabricated for comparison. Then, the electrodes were immersed into a 0.3 mM acetonitrile![[thin space (1/6-em)]](https://www.rsc.org/images/entities/char_2009.gif) :
:![[thin space (1/6-em)]](https://www.rsc.org/images/entities/char_2009.gif) tert-butyl alcohol (1
tert-butyl alcohol (1![[thin space (1/6-em)]](https://www.rsc.org/images/entities/char_2009.gif) :
:![[thin space (1/6-em)]](https://www.rsc.org/images/entities/char_2009.gif) 1) solution of cis-bis(isothiocyanato)(2,2′-bipyridyl-4,4′-dicarboxylato) (2,2′-bipyridyl-4,4′-dinonyl) ruthenium(II) (commercially called Z907 dye) for 3 h. The TiO2/SnO2 photoelectrodes were assembled with a 20 nm platinum-coated indium tin oxide (ITO) substrate as the counter electrode. The cell gap was maintained by a 60 μm thermal-plastic spacer. The iodide electrolyte consisting of 0.1 M LiI, 0.05 M I2, 0.6 M 1-methyl-3-propylimidazolium iodide (MPII), and 0.5 M 4-tert-butyl-pyridine (TBP) in acetonitrile was injected into the cells by capillary effect. The area of the electrode was close to 0.16 cm2. The photoanodes fabricated with TiO2/SnO2 (200 nm), TiO2/SnO2 (600 nm) and TiO2 were named cell A, B and C, respectively.
1) solution of cis-bis(isothiocyanato)(2,2′-bipyridyl-4,4′-dicarboxylato) (2,2′-bipyridyl-4,4′-dinonyl) ruthenium(II) (commercially called Z907 dye) for 3 h. The TiO2/SnO2 photoelectrodes were assembled with a 20 nm platinum-coated indium tin oxide (ITO) substrate as the counter electrode. The cell gap was maintained by a 60 μm thermal-plastic spacer. The iodide electrolyte consisting of 0.1 M LiI, 0.05 M I2, 0.6 M 1-methyl-3-propylimidazolium iodide (MPII), and 0.5 M 4-tert-butyl-pyridine (TBP) in acetonitrile was injected into the cells by capillary effect. The area of the electrode was close to 0.16 cm2. The photoanodes fabricated with TiO2/SnO2 (200 nm), TiO2/SnO2 (600 nm) and TiO2 were named cell A, B and C, respectively.
X-ray diffraction (XRD) patterns were obtained on a D8 Advance X-ray diffractometer (Bruker AXS, USA) using Cu-Kα irradiation. Nitrogen adsorption–desorption isotherms were obtained on AS-6B apparatus (Micromeritics Instrument Corp.). All the samples were degassed at 150 °C prior to Brunauer–Emmett–Teller (BET) measurements. The thickness of the film was measured by TENCOR P-10 Surface Profiler. The absorption spectra were recorded using a SHIMADZU MPC-2200 UV-VIS Spectrometer. The current density-voltage (J–V) characteristics were measured with a Keithley 2440 Sourcemeter and the cell was subjected to the irradiation of a solar simulator (Abet-technologies, USA) operating at 100 mW cm−2 (AM 1.5 G). The incident photon to current conversion efficiency (IPCE) was measured with QE/IPCE Measurement Kit (Oriel, USA) in the wavelength range of 350 to 800 nm. Electrochemical impedance spectra (EIS) were measured under open circuit potential with oscillation potential amplitudes of 10 mV from 10−1 to 106 Hz.
3. Results and discussion
3.1 Morphology and structure characterization of the photoanode
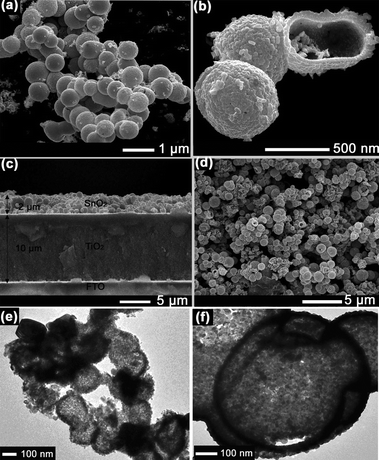
Fig. 1a and b show the scanning electron microscopy (SEM) images of the hollow SnO2 microspheres with a size of ∼600 nm. It is clearly seen that the SnO2 has a hollow structure. Fig. 1c and d show the SEM images of the bare TiO2 film and TiO2/SnO2 film. It can be seen that the 2 μm thick SnO2 microsphere layer was uniformly dispersed on the 10 μm thick TiO2 layer. Most SnO2 microspheres has an open hole on the hollow structure after heat-treatment at 600 °C. Fig. 1e and f show the transmission electron microscopy (TEM) images of two kinds of SnO2 microspheres. It is clear that both SnO2 microspheres have a hollow structure with inner sphere diameters of 200 and 600 nm, respectively. And it has been reported that this hollow structure enhances light harvesting due its multiple light reflecting and scattering effects in the DSSC6,9. | ||
| Fig. 1 (a) SEM image and (b) magnified image of 600 nm SnO2 hollow microspheres (c) cross-section (d) top-view SEM image of TiO2 coated with 600 nm SnO2 film. TEM images of (e) 200 nm and (f) 600 nm SnO2 hollow microspheres. | ||
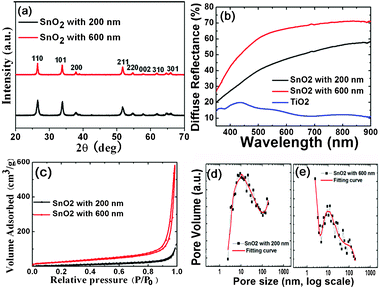
Fig. 2a shows the XRD spectra of 200 and 600 nm SnO2 hollow microspheres. It can be seen that all the diffraction peaks of the SnO2 hollow microspheres are in good agreement with a rutile structure of SnO2 (JCPDS No.41–1445)11. Fig. 2b shows the reflectance measurement of TiO2, TiO2/SnO2 (200 nm), and TiO2/SnO2 (600 nm). It can be seen that the reflecting light in hollow SnO2 is higher than TiO2. TiO2 nanoparticles have very weak reflectance, and the light scattering effect is usually ignored due to their size being smaller than 30 nm12. Therefore, hollow SnO2 can produce a greatly enhanced light harvest due to light multi-reflections and scattering. Fig. 2c shows the nitrogen adsorption and desorption isotherms of 200 nm and 600 nm SnO2 powders. The BET surface areas for the 200 nm and 600 nm SnO2 are 25.8 cm3 g−1 and 93.5 cm3 g−1, respectively. The isotherm curves of 600 nm SnO2 powder correspond to a hysteresis loop of type IV BDDT classification, indicating the presence of mesopores in the SnO2 powder,13–15 which can facilitate the transportation of the electrolyte and the adsorption of the dye in the DSSC16. Fig. 2d and e show the pore-size distribution for the SnO2 with 200 nm and 600 nm. The average pore size for SnO2 is about 10 nm. The dye molecules adsorbed on cell A–C were desorbed by a 0.1 M NaOH solution (water![[thin space (1/6-em)]](https://www.rsc.org/images/entities/char_2009.gif) :
:![[thin space (1/6-em)]](https://www.rsc.org/images/entities/char_2009.gif) ethanol 1
ethanol 1![[thin space (1/6-em)]](https://www.rsc.org/images/entities/char_2009.gif) :
:![[thin space (1/6-em)]](https://www.rsc.org/images/entities/char_2009.gif) 1 vol%) for 24 h. The amounts of dye adsorption on cells A–C are calculated to be 6.6, 6.9 and 7.3 × 10⁻⁶ mol cm−2, respectively.
1 vol%) for 24 h. The amounts of dye adsorption on cells A–C are calculated to be 6.6, 6.9 and 7.3 × 10⁻⁶ mol cm−2, respectively.
 | ||
| Fig. 2 (a) XRD pattern of 200 and 600 nm SnO2 hollow microspheres. (b) Reflectance spectra of TiO2/SnO2 (200 nm), TiO2/SnO2 (600 nm), and TiO2 (c) The N2 adsorption and desorption isotherms of 200 and 600 nm SnO2 powders. (d) and (e) Pore-size distribution of SnO2 with 200 nm and 600 nm analyzed by N2 adsorption. | ||
3.2 Photovoltaic performances of DSSCs
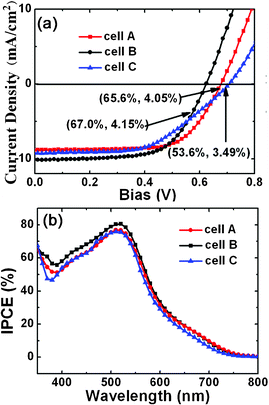
Fig. 3a and b show I–V characteristics and the IPCE spectra of cells A–C at 100 mW cm−2 (AM 1.5 G), whose related photovoltaic parameters were listed in Table 1. Cell A has a PCE of 4.05% with short-circuit current density (Jsc) of 8.83 mA cm−2, open-circuit voltage (Voc) of 0.679 V, and fill factor (FF) of 67.6%. With 600 nm SnO2 hollow microspheres (cell B) the DSSC leads to an improved PCE of 4.15% with Jsc = 9.36 mA cm−2, Voc = 0.662 V, and FF = 67.0%. | ||
| Fig. 3 (a) I–V characteristics (b) IPCE spectra of cell A–C measured under simulated solar illumination (AM 1.5 G) with an intensity of 100 mW cm−2 in iodide electrolyte. The corresponding values of FF and η are shown in the format of (FF, η) in (a). | ||
| Cells | J sc (mA cm−2) | V oc (V) | FF | PCE |
|---|---|---|---|---|
| Cell A | 8.83 | 0.679 | 67.6 | 4.05 |
| Cell B | 9.36 | 0.662 | 67.0 | 4.15 |
| Cell C | 9.23 | 0.706 | 53.6 | 3.49 |
Compared to cell C, the PCE of cell B has improved 19%, which is due to the increased Jsc and FF. The larger Jsc value for cell B is most likely because of enhanced light harvesting due to multiple light reflections within the TiO2/SnO2, rather than an increased surface area. Compared to cell C, the improvement in the FF values of cell A and B is due to the suppressed back electron transfer in the bilayered photoanodes. The Voc for cells A and B were a little decreased. It is because the conduction-band edge of SnO2 is 300 mV more positive than that of TiO2, which leads to the decreased Voc of cells with SnO2 layer. Meanwhile, higher Jsc value for cell B than cell A should result from the larger dye absorption amount due to the enhanced surface areas, light scattering and reflection abilities. Therefore, cell B has the best performance among the three cells.
Fig. 3b presents the IPCE of cells A–C, which were measured in the wavelength range of 350 to 800 nm. The IPCE results are in good agreement with the PCE results shown in Fig. 3a. It can be seen that a maximum IPCE as high as 81% was obtained at 516 nm for cell B. The increment of IPCE for cell A and B is primarily due to the contribution of SnO2 hollow microspheres forming a bilayered structure in the DSSC.
3.3 Diffusion constants and EIS measurements
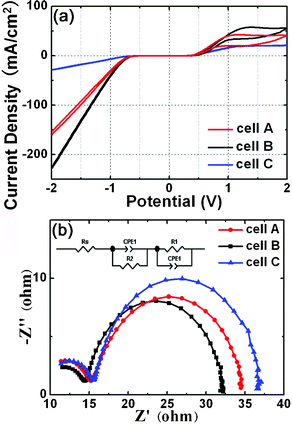
Lastly, to reveal the kinetics of interfacial reactions of photoexcited electrons in DSSCs, we measured the EIS spectra of the as-prepared DSSCs. Fig. 4a shows the steady-state current–voltage curves of samples A–C. The diffusion-limited current density (jlim) eqn (1) is shown as follows,17 | (1) |
![[thin space (1/6-em)]](https://www.rsc.org/images/entities/char_2009.gif) 484 C mol−1),
484 C mol−1),  is the concentration per volume unit of I3−,
  is the diffusion constant of I3−, n is the number of electrons transported in the each reaction (in general, n = 2) and l is the distance between electrodes. The diffusion constants of I3− (
 ) for cells A–C are estimated as 2.0 × 10⁻⁶, 2.9 × 10⁻⁶ and 1.6 × 10⁻⁶ cm2 s−1, respectively. Cell B has the highest diffusion constant among the three cells, which can be beneficial to the charge transfer in cell B.
 | ||
| Fig. 4 (a) steady-state current–voltage curves of cells A–C. (b) Nyquist plots of cells A–C. The electric circuit is shown in the inset of Fig. 4b. | ||
Fig. 4b shows Nyquist plots of cells A–C at an applied bias of Voc and a frequency range from 10−1 Hz to 106 Hz, with AC amplitude of 10 mV under the illumination of one sun (AM 1.5 G, 100 mW cm−2). It can be seen that two semicircles were observed in the high-frequency region (>1k Hz) and middle-frequency region (10–100 Hz), respectively.
It was reported that the middle-frequency peak reflects the properties of the photoinjected electrons with the oxide semiconductor, which can be fitted to a transport resistance (Rw) and a constant phase element. The high-frequency peak can be fitted to a charge-transfer resistance (Rct) and the chemical capacitance, which is due to charge transfer at the interfaces of the redox electrolyte/Pt counter electrode18,19. According to the electric circuit shown in the inset of Fig. 4b, the Rw and Rct can be obtained by Z-view software. The Rw values are 19.6, 17.7 and 21.4 Ω and Rct are 4.03, 2.07 and 4.33 Ω for cells A–C, respectively. Therefore, cell B performs the lowest value of Rw and Rct among the three cells, indicating that more efficient charge transfer process at the interfaces of oxide/dye/electrolyte and electrolyte/Pt electrode3,19. The low resistance and high diffusion constant in the DSSC can facilitate electron transfer and reduce electron recombination, leading to a higher FF value. As a result, the improved performance of DSSCs based on TiO2 coated with hollow SnO2 is ascribed to rapid charge transport with less diffusive hindrance by the presence of hollow SnO2 microsphere layer.
4. Conclusion
Z907 dye sensitized solar cells based on SnO2 hollow microspheres were studied in this work. A TiO2/SnO2/dye bilayered cell has a better performance than a TiO2/dye cell, which is attributed to the multiple light reflection and scattering in the DSSCs by the presence of the SnO2 hollow structure. EIS measurements demonstrated a lower resistance and faster diffusion constant for TiO2/SnO2/dye than TiO2/dye, leading to the reduction of electron recombination and a lower FF value. As a result, a PCE of 4.15% was achieved for TiO2/SnO2/dye, which accounts for a 19% improvement compared to the TiO2/dye cell.References
- E. Guillen, C. Fernandez-Lorenzo, R. Alcantara, J. Martin-Calleja and J. A. Anta, Sol. Energy Mater. Sol. Cells, 2009, 93, 1846–1852 CrossRef CAS.
- S. Hore, C. Vetter, R. Kern, H. Smit and A. Hinsch, Sol. Energy Mater. Sol. Cells, 2006, 90, 1176–1188 CrossRef CAS.
- K. Zhu, N. R. Neale, A. Miedaner and A. J. Frank, Nano Lett., 2007, 7, 69–74 CrossRef CAS.
- E. Hendry, M. Koeberg, B. O'Regan and M. Bonn, Nano Lett., 2006, 6, 755–759 CrossRef CAS.
- S. Gubbala, V. Chakrapani, V. Kumar and M. K. Sunkara, Adv. Funct. Mater., 2008, 18, 2411–2418 CrossRef CAS.
- J. F. Qian, P. Liu, Y. Xiao, Y. Jiang, Y. L. Cao, X. P. Ai and H. X. Yang, Adv. Mater., 2009, 21, 3663 CrossRef CAS.
- S. Chappel, S. G. Chen and A. Zaban, Langmuir, 2002, 18, 3336–3342 CrossRef CAS.
- H. J. Koo, J. Park, B. Yoo, K. Yoo, K. Kim and N. G. Park, Inorg. Chim. Acta, 2008, 361, 677–683 CrossRef CAS.
- H. J. Koo, Y. J. Kim, Y. H. Lee, W. I. Lee, K. Kim and N. G. Park, Adv. Mater., 2008, 20, 195–199 CrossRef CAS.
- Z. S. Wang, H. Kawauchi, T. Kashima and H. Arakawa, Coord. Chem. Rev., 2004, 248, 1381–1389 CrossRef CAS.
- H. X. Yang, J. F. Qian, Z. X. Chen, X. P. Ai and Y. L. Cao, J. Phys. Chem. C, 2007, 111, 14067–14071 CAS.
- J. Yu, J. Fan and K. Lv, Nanoscale, 2010, 2, 2144–2149 RSC.
- K. S. W. Sing, D. H. Everett, R. A. W. Haul, L. Moscou, R. A. Pierotti, J. Rouquerol and T. Siemieniewska, Pure Appl. Chem., 1985, 57, 603–619 CrossRef CAS.
- J. G. Yu, J. C. Yu, M. K. P. Leung, W. K. Ho, B. Cheng, X. J. Zhao and J. C. Zhao, Journal of Catalysis, 2003, 217, 69–78 CAS.
- J. G. Yu, G. H. Wang, B. Cheng and M. H. Zhou, Appl. Catal., B, 2007, 69, 171–180 CrossRef CAS.
- S. Hore, P. Nitz, C. Vetter, C. Prahl, M. Niggemann and R. Kern, Chem. Commun., 2005, 2011–2013 RSC.
- A. Hauch and A. Georg, Electrochim. Acta, 2001, 46, 3457–3466 CrossRef CAS.
- R. Kern, R. Sastrawan, J. Ferber, R. Stangl and J. Luther, Electrochim. Acta, 2002, 47, 4213–4225 CrossRef CAS.
- Q. Wang, S. Ito, M. Gratzel, F. Fabregat-Santiago, I. Mora-Sero, J. Bisquert, T. Bessho and H. Imai, J. Phys. Chem. B, 2006, 110, 25210–25221 CrossRef CAS.
Footnote |
| † These authors contributed equally to this work. |
| This journal is © The Royal Society of Chemistry 2012 |
