Morphosynthesis of framboidal stable vaterite using a salicylic acid-aniline dye as an additive†
Jiban
Saikia
a,
Bedabrata
Saha
b and
Gopal
Das
*ab
aDepartment of Chemistry, Indian Institute of Technology Guwahati, Assam-781039, India
bCentre for the Environment, Indian Institute of Technology Guwahati, Assam-781039, India. E-mail: gdas@iitg.ernet.in; Fax: +91-361-258-2349; Tel: +91-361-258-2313
First published on 23rd August 2012
Abstract
Morphosynthesis and stabilization of pure framboidal vaterite microspheres using a salicylic acid–aniline dye as an additive has been reported in this paper. Formation and stabilization of vaterite crystals could be regulated by changing the dye concentration. Calcite rhombohedra were predominant species when no additive was added. As the concentration of dye was increased vaterite was more pronounced in the solution leading to the formation of pure framboidal vaterite (∼98% at 10 mM dye concentration). The size of these microspheres varied from 0.5 to 4.0 μm. Various instrumental analysis has been incorporated to study the dynamics of phase transformation throughout the process. Detailed analysis of TEM images reveals that vaterite microspheres were in turn aggregates of small vaterite nanospheres. The vaterite microspheres were stable up to a week in solution. The dissolution of the vaterite crystals to calcite was arrested by the presence of the dye at the nucleation process. The stability of the vaterite may be attributed to the strong electrostatic interaction of the Ca ions present on the surface of the crystal with the –COOH group of the dye. This finding opens up a new domain of organic additives to explore.
1. Introduction
Calcium carbonate (CaCO3) for decades has drawn the attention of many researchers due to its marvellous morphological control behavior which has been an important subject in biomineralization processes. Three anhydrous crystalline polymorphs of CaCO3 are known viz. calcite, aragonite, and vaterite. Calcite is thermodynamically the most stable species and abundant in nature followed by aragonite. Vaterite, the least stable polymorph, rarely appears in nature because it transforms into calcite via a solvent mediated dissolution–recrystallization process.1 However, vaterite is a material of high potential application because of its high specific surface area, high solubility, high dispersion, and small specific gravity compared with calcite and aragonite.2 Due to these unique properties formation and stabilization of the vaterite phase is of key concern.Quite a lot of approaches have been taken to deal with polymorph stabilization and to imitate the intricate morphologies of CaCO3, such as initial super saturation, mixing and stirring conditions, temperature, pH, solvents, and the presence of organic or inorganic additives.3 In the absence of any additives calcium and carbonate ions precipitate in the aqueous solution to give rhombohedral calcite crystals.4 Whereas vaterite particles could be fabricated using specific additives in a controlled environment. Anionic dendrimers could induce the formation of spherical vaterite particles.2 Double hydrophilic block copolymers and synthetic polypeptides have been used for the stabilization of the vaterite phase in solution.5 Vogel et al. synthesized vaterite microspheres using a seeded growth method.6 Microwave-assisted synthesis of vaterite has been reported by Qui et al.7 Walsh et al. reported a water-in-oil system with SDS for morphosynthesis of vaterite microsponges.8 Stabilization of vaterite is not commonly observed for small molecules although amino acids and some small alcohols viz. ethanol, isopropanol and diethylene glycol have been reported to do so. However, for the most part, long term stabilization of vaterite is achieved by the use of long chain organic molecules.9,10
The principle behind this stabilization is arresting the metastable phase by delaying the transformation into the more stable calcite form. Electrostatic interaction of the surface Ca ions of the crystal and the anionic site of the additive is sought to be responsible for the stability of the thermodynamically unfavorable vaterite polymorph. Therefore molecules having a suitable site for the Ca ion interaction are a potential additive for stabilizing the vaterite phase. Organic molecules having a carboxylic moiety might prove to be good candidates in this regard. In continuation of our work on mineral crystallization,11 in this work we have used an aniline-salicylic acid dye as an additive in the morphosynthesis of CaCO3 and systematically investigated the stabilizing/destabilizing effect of the dye on the metastable vaterite and the underlying mechanism. The formation and the lifespan of the metastable vaterite phase were increased upon addition of the dye.
2. Materials and methods
All starting materials were of analytical reagent grade: calcium chloride (CaCl2; Sigma-Aldrich) and sodium carbonate (Na2CO3; Merck India). We used ultrapure deionized (DI) water (Milli-Q; resistivity >18 MΩ cm; Millipore Corporation) in all the reactions unless otherwise mentioned. Aniline and salicylic acid were purchased from Merck India and used as received. A known reported protocol by Baul et al.12 was used for the synthesis of the aniline-salicylic acid dye, which was further used as an additive in the mineralization process (ESI†).A simple precipitation method was used to synthesize calcium carbonate in solution. Supersaturated calcium carbonate solutions (saturation index, S.I. = 2.27)13 were prepared by mixing equimolar concentration (2 mM) of CaCl2 and Na2CO3 at RT. The concentration of the dye was varied at RT. Different concentration of the dye in the reaction mixture fabricated different fraction of polymorphs. The phase transformation process was brought to a halt by taking out the precipitates from the solution as reported in the literature.14 Several techniques were employed for the characterization of different morphology and phases of CaCO3 precipitates. FT-IR spectra were recorded at 4 cm−1 resolution with 10 scans with a Perkin-Elmer spectrum one FT-IR spectrometer from 4000 to 450 cm−1. A background spectrum was corrected with pure KBr.
The powder XRD analysis of CaCO3 was conducted using a Bruker D8 Advance diffractometer (bench top) with a CuK source (λ = 1.54 Å) with a scan range from 10 to 70° 2θ and a step size of 0.018° 2θ. The percentage of each polymorph of calcium carbonate was calculated from their characteristic XRD peak intensities (ESI†).
SEM was used to examine the sizes and morphologies of the CaCO3 precipitates. The precipitates were gold sputtered which were then investigated by scanning electron microscopy (SEM) JEOL JSM-6390 microscope at an accelerating voltage of 15 kV.
The transmission electron micrographs (TEM) were obtained with a JEOL 2100 UHR-TEM microscope. An amount of 5 μL of as-synthesized CaCO3 solution was drop-cast on carbon-coated copper grids and subsequently air-dried before TEM analysis. Thermo gravimetric analysis (TGA) was used using at a heating rate of 10 °C min−1 at continuous nitrogen flow.
3. Results and discussion
The dye was characterized using single crystal XRD and the crystallographic details are given in the footnote.‡ An ORTEP representation of the dye is given in Fig. 1.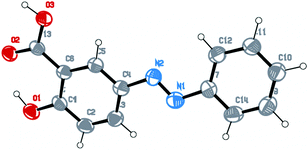 | ||
| Fig. 1 ORTEP representation of the dye (E-2-hydroxy-5-(phenyldiazenyl)benzoic acid). | ||
3.1 Formation of CaCO3 in absence of dye additive
We applied the simple co-precipitation method for the synthesis of CaCO3 as reported earlier.13 Precipitation was carried out by mixing an equimolar solution (2 mM) of CaCl2 and Na2CO3 in the absence of the dye at a flow rate of 5 ml min−1. Amorphous calcium carbonate (ACC) was spontaneously formed in the precipitation process, which subsequently transformed to predominantly calcite polymorph within 2 h. The precipitate was washed with water several times and finally with methanol and then was kept for air drying. The dried samples were then subjected to different analysis. SEM images of the as prepared samples manifest the formation of rhombohedral CaCO3 crystal (Fig. 2a and 2b). The peaks in the XRD pattern support the complete formation of pure calcite crystals in absence of the additive at that time interval (Fig. 2c). The FT-IR data is consistent with the PXRD pattern. The FT-IR spectra obtained showed sharp peak at 712, 875 and 1429 cm−1 respectively (Fig. 2d). The band at 712 cm−1 (v4) is a characteristic band of the calcite and is assigned to the in plane bending of CO32−. The peaks at ∼876 and 1429 are due to the out-of-plane bending (v2), and asymmetric stretching (v3) modes of CO32−, respectively.15 All the characterization data supports the formation of pure calcite phase in the absence of any additive in the given experimental conditions.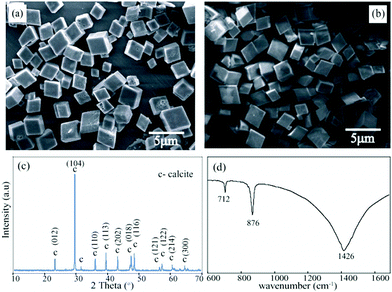 | ||
| Fig. 2 (a) and (b) are SEM micrographs of calcite formed in the absence of the additive; (c) PXRD spectra showing predominant calcite phase; (d) FT-IR spectra showing the characteristic calcite peaks. (Data collected after 2 h at RT). | ||
3.2 Formation and transformation of CaCO3 in the presence of additive
To study the effect of dye in the formation of CaCO3 crystals, the above synthetic protocol was repeated except the dye was added to the Na2CO3 solution prior to addition of CaCl2 solution. For lower concentration range we have used 10 μM concentration of the dye. The dynamics of the transformation were monitored at time intervals using FT-IR and SEM. As before, we have assumed that after removing the precipitates from the solution no further phase transformation is possible. In the presence of the dye a different availability profile of calcite and vaterite was observed. The FT-IR spectra collected after incubation time of 4 h showed the peak at around 745 cm−1, along with calcite peak suggesting the presence of the vaterite phase at that interval whereas in absence of the dye shaper peak of predominant calcite was formed within a hour (Fig. 3). SEM images (Fig. 4a & 4b) give a representative overview of the coexistence of both the phase and also the dissolution of the vaterite and the subsequent growth of calcite suggesting a heterogeneous nucleation mechanism between them.16 Rieger et al. also reported the same phenomenon where the dissoluting vaterite serve as inorganic template and the in situ supplier of calcium and carbonate ions for calcite formation.17,18 SEM micrographs taken after 4 days of incubation shows stacked calcite rhombohedras confirming the complete transformation of the vaterite crystals to the more stable calcite form (Fig. 4c). The morphology of calcite crystals were different than that of the calcite crystals formed in absence of the additive. Almost uniform calcite rhombohedras of size ranging 0.5 to 4 μm were formed in absence of the dye whereas stacked calcite of bigger sizes (average 8–10 μm) were formed at a lower concentration of the dye. The reason for the formation of the stacked calcite morphology might be due to the delay in the dissolution process of the vaterite caused by the electrostatic interaction with the dye. The PXRD (Fig. 4d) also shows characteristic peaks of vaterite and calcite. From the ratio of intensities of the peaks at 110 and 104 the percent fraction of vaterite was calculated and was found to be ∼77%. After an incubation period of 3 days the characteristic ν1 (1088 cm−1) and ν3 (745 cm−1) bands of the vaterite were reduced and calcite peak became more prominent as depicted in FT-IR spectra (Fig. 3).19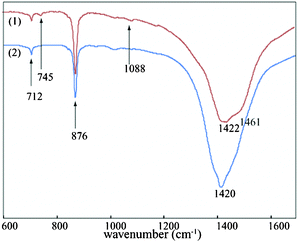 | ||
| Fig. 3 FT-IR spectra at 10 μM dye concentration (1) showing peaks of calcite and vaterite (collected after 4 h); (2) disappearance of the vaterite peak owing to the formation of the stable calcite (collected after 3 days of incubation). | ||
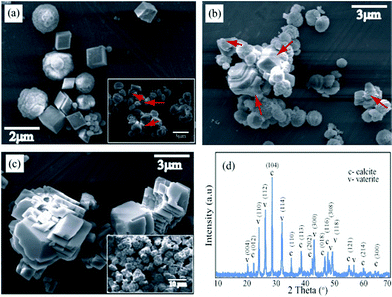 | ||
| Fig. 4 SEM micrographs at 10 μM dye concentration, (a) co-existence of vaterite and calcite; inset: dissolution of vaterite to calcite (time 4 h); (b) vaterite phase transformation by dissolution to calcite (6 h); (c) stacked calcite crystals formed after 4 days of incubation; (d) PXRD spectra collected after 4 h. All data were collected at room temperature. | ||
The dependency of morphologies and phase transformation of CaCO3 was more prominent at a higher concentration of the dye i.e. at 10 mM. Framboidal vaterite spheres of size ranging 0.5 to 4 μm were the major components of the mineralized CaCO3 precipitates (Fig. 5). The stability of the vaterite microspheres formed was dominant as observed after incubation for over a week in solution as apparent from the SEM images. The PXRD data also reveals the occurrence of pure vaterite phase with the other two phases almost absent (Fig. 6a). The detailed analysis of the TEM images (Fig. 6b) confirmed that the vaterite microspheres formed were actually aggregates of vaterite nanocrystals. These findings are similar to the findings reported by Ganguli et al.20 These nano-vaterites of sizes 20–50 nm self assemble to form larger microspheres of vaterite crystals.
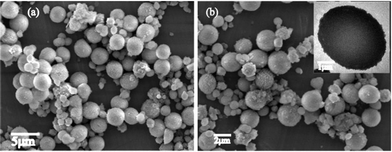 | ||
| Fig. 5 SEM micrographs at dye concentration 10 mM, (a) and (b) vaterite microspheres ranging from 0.5 to 4 μm at different magnification; (inset): magnified TEM image of vaterite crystal. | ||
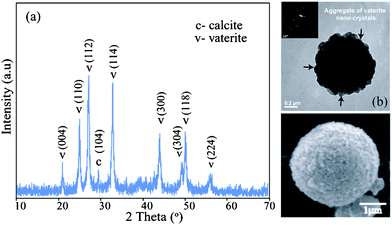 | ||
| Fig. 6 (a) PXRD of the pure vaterite formed at dye concentration of 10 mM after incubation for 1 day; (b) TEM image showing nano vaterite aggregation to form large vaterite microsphere; (inset): SAED of the corresponding particle; (c) magnified SEM image of vaterite microsphere. | ||
The FT-IR data gives the overview of the dynamics of phase transformation of CaCO3 at 10 mM dye concentration (Fig. 7). The spectra taken at the early phase (15 min) of the precipitation process (Fig. 7a) shows the two split peaks at 1418 and 1469 cm−1 along with the characteristic vaterite peak at 746 cm−1 and 1089 cm−1. The presence of these two sets of peaks correspond to the occurrence of the vaterite from the ACC phase. The vaterite was further allowed to incubate in the reaction mixture and precipitates were drawn out at different time scales. The existence of the peak at 746 cm−1 related to vaterite and non occurrence of the calcite peak (712 cm−1) even after incubation of ∼4 days (Fig. 7c) show that the vaterite phase is still present under the aforementioned experimental conditions. A small calcite peak emerged in the FT-IR spectrum after ∼8 days of incubation (Fig. 7d), which was due to the commencement of the formation of calcite by dissolution of the vaterite microspheres. This observation also corresponds to the literature report.21
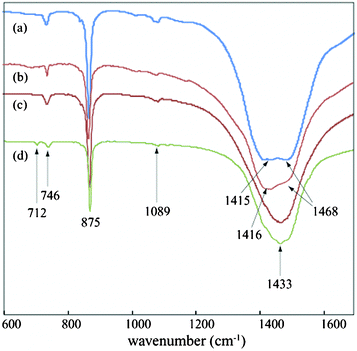 | ||
| Fig. 7 FT-IR spectra of CaCO3 taken after (a) 15 min; (b) 1 day; (c) 4 days; (d) 8 days; of incubation respectively. | ||
3.3 Plausible mechanism for the stabilization of the vaterite phase
From our experimental observation it is clear that with the increase in the dye concentration the stability of the metastable vaterite phase increases. The possible mechanistic aspect could be the interfacial adsorption of the additive (dye) on to the surface of the metastable vaterite resulting in the retardation of the dissolution of the vaterite to calcite.22 The strong interfacial adsorption was favored between the –COOH group of the dye and the Ca2+ ion present in the vaterite surface as reported for the polycarboxylates.23,24 This serves as the nucleation site for the formation of vaterite nano crystals which further aggregate and assemble to form the larger dissolution resistant vaterite microspheres. Fig. 8a demonstrates the stability of the vaterite microspheres after the incubation period of 7 days at a 10 mM dye concentration which probably arrest the vaterite phase and hinders the dissolution of vaterite to calcite. Furthermore the structure of the dye was also accountable for this unusual stability of the vaterite. A control reaction was carried out using exactly the same protocol, except in case of the dye, we have used salicylic acid. The resulting precipitates drawn out for analysis at similar timescales in the presence of dye were found to be calcite predominantly rather than vaterite (ESI†). This finding allows us to conclude that the extended hydrophobic structure of the dye may play a major role in the mineralization process. The requisite hydrophobicity imparted by the aniline moiety may be responsible for the stability of the vaterite formed, both the stereo and electronic factor of the dye molecule take an important role here. The clue from solid-state 3D structure of the ligand is that, they help to form alternate hydrophobic and hydrophilic layers in the assembly (ESI†). This structural arrangement might lead to the formation and stability of the nano-vaterite. After the formation of the nano-vaterite the dye adsorbs onto the surface and the hydrophobic moiety restricts it from going in to the solution phase.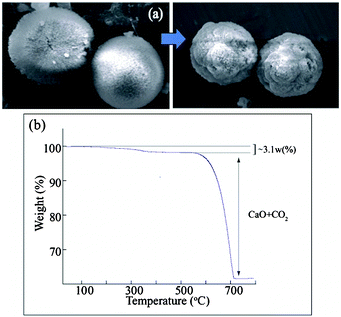 | ||
| Fig. 8 (a) Vaterite microspheres after the incubation period of 7 days. (b) TGA profile of vaterite microspheres obtained at higher concentration ∼10 mM. | ||
The vaterite microspheres obtained at higher concentration ∼10 mM of the dye were subjected to TGA analysis (Fig. 8b). The break at 200 to 500 °C corresponds to a weight loss of about 3.1% which arises due to the thermal decomposition of the dye molecules that were interfacially adsorbed onto the nano-vaterite surfaces and entrapped within the vaterite microspheres. This observation was found to be similar to those reported in the literature.25 The weight loss of ∼35% at 500 to 780 °C was attributed to the decomposition of CaCO3 to CaO and CO2. The CaCO3 precipitates that were formed in the absence of the dye and at lower concentration of the dye were also thermally decomposed (ESI†). No such weight loss or very negligible loss is observed in the 250 to 500 °C region which concludes that there is no adsorptive stabilizing effect.
4. Conclusion
We have reported an organic dye as an additive for the synthesis and stabilization of vaterite microspheres. In the absence of an additive, mixing Na2CO3 and CaCl2 led to the quick formation of pure calcite rhombohedra. However, in the presence of the dye the formation of the metastable vaterite phase was favored and also the process of transformation of the vaterite to calcite was delayed. The formation and the stabilization of the vaterite were highly dependent on the concentration of the dye added. At higher dye concentration (10 mM) the surface coverage increases due to the interfacial adsorption interaction between the Ca2+ and the carboxylate group of the dye. These surface coverings hinder the solution transformation of the vaterite to calcite and stabilize the metastable vaterite phase. Furthermore, the extended hydrophobic structure of the dye also found to play a major role in the mineralization process. A controlled experiment with salicylic acid gave the usual calcite cubes. Thus the structural factor of the dye also plays a prominent role in addition to the coordination ability. This factor could be further exploited for selecting other dyes having different structural aspects such as steric, hydrophopic, different head groups etc, which are in progress in our laboratory.Acknowledgements
G. D. gratefully acknowledges CSIR (01-2235/08/EMR-II) and Department of Science and Technology (DST), New Delhi, India, for the financial support, DST-FIST for the single-crystal X-ray diffraction facility, and Central Instrument Facility at IIT Guwahati. J. S acknowledges the help of Arghya Basu. J. S and B. S acknowledge IIT Guwahati, for a research fellowship.References
- D. Kralj, L. Brecevic and J. Kontrec, J. Cryst. Growth, 1997, 177, 248–257 CrossRef CAS.
- K. Naka, Y. Tanaka and Y. Chujo, Langmuir, 2002, 18, 3655–3658 CrossRef CAS.
- (a) L. Zhang, L. H. Yue, F. Wang and Q. Wang, J. Phys. Chem. B, 2008, 112, 10668–10674 CrossRef CAS PubMed; (b) Z. Nan, B. Yan, X. Wang, R. Guo and W. Hou, Cryst. Growth Des., 2008, 8, 4026–4030 CrossRef CAS; (c) S. F. Chen, S. H. Yu, J. J. F. Li and Y. Liu, Chem. Mater., 2006, 18, 115–122 CrossRef CAS; (d) Q. Shen, L. Wang, X. Li and F. Liu, Cryst. Growth Des., 2008, 8, 3560–3565 CrossRef CAS; (e) Q. Shen, L. Wang, Y. Huang, J. Sun, H. Wang, Y. Zhou and D. Wang, J. Phys. Chem. B, 2006, 110, 23148–23153 CrossRef CAS PubMed; (f) Z. Nan, X. Chen, Q. Yang, X. Wang, Z. Shi and W. Hou, J. Colloid Interface Sci., 2008, 325, 331–336 CrossRef CAS PubMed.
- J. Yu, X. Zhao, B. Cheng and Q. Zhang, J. Solid State Chem., 2005, 178, 861–867 CrossRef CAS.
- (a) S. D. Sims, J. M. Didymus and S. Mann, J. Chem. Soc., Chem. Commun., 1995, 1031–1032 RSC; (b) H. Cölfen and M. Antonietti, Langmuir, 1998, 14, 582–589 CrossRef; (c) J. T. Han, X. Xu, D. H. Kim and K. Cho, Chem. Mater., 2005, 17, 136–141 CrossRef CAS.
- R. Vogel, M. Persson, C. Feng, S. J. Parkin, T. A. Nieminen, B. Wood, N. R. Heckenberg and H. Rubinsztein-Dunlop, Langmuir, 2009, 25, 11672–11679 CrossRef CAS PubMed.
- R. J. Qi and Y. J. Zhu, J. Phys. Chem. B, 2006, 110, 8302–8306 CrossRef CAS PubMed.
- D. Walsh, B. Lebeau and S. Mann, Adv. Mater., 1999, 11, 324–328 CrossRef CAS.
- (a) C. Shivkumara, P. Singh, A. Gupta and M. S. Hegde, Mater. Res. Bull., 2006, 41, 1455–1460 CrossRef CAS; (b) F. Manoli and E. Dalas, J. Cryst. Growth, 2001, 222, 293–297 CrossRef CAS; (c) P. Malkaj and E. Dalas, Cryst. Growth Des., 2004, 4, 721–723 CrossRef CAS; (d) F. Manoli and E. Dalas, J. Cryst. Growth, 2000, 218, 359–364 CrossRef CAS; (e) M. Massi, M. I. Ogden and F. Jones, J. Cryst. Growth, 2012, 351, 107–114 CrossRef CAS; (f) T. Schüler and W. Tremel, Chem. Commun., 2011, 47, 5208–5210 RSC.
- (a) M. Fricke, D. Volkmer, C. E. Krill III, M. Kellermann and A. Hirsch, Cryst. Growth Des., 2006, 6, 1120–1123 CrossRef CAS; (b) J. Rudloff, M. Antonietti, H. Colfen, J. Pretula, K. Kaluzynski and S. Penczek, Macromol. Chem. Phys., 2002, 203, 627–635 CrossRef CAS.
- (a) B. M. Borah, B. J. Bhuyan and G. Das, J. Chem. Sci., 2006, 118, 519–524 CrossRef CAS; (b) B. M. Borah and G. Das, Mater. Sci. Eng., C, 2008, 28, 1173–1182 CrossRef CAS; (c) B. M. Borah, A. Singh, A. Ramesh and G. Das, J. Cryst. Growth, 2009, 311, 2664–2672 CrossRef CAS; (d) H. Thakuria and G. Das, Bull. Mater. Sci., 2011, 34, 97–104 CrossRef CAS; (e) B. M. Borah, S. Dey and G. Das, Cryst. Growth Des., 2011, 11, 2773–2779 CrossRef CAS.
- T. S. Basu Baul, S. Dhar, S. M. Pyke, E. R.T. Tiekink, E. Rivarola, R. Butcher and F.E. Smith, J. Organomet. Chem., 2001, 633, 7–17 CrossRef CAS.
- (a) C. Li, G. D. Botsaris and D. L. Kaplan, Cryst. Growth Des., 2002, 2, 387–393 CrossRef CAS; (b) C. Perdikouri, C. V. Putnis, A. Kasioptas and A. Putnis, Cryst. Growth Des., 2009, 9, 4344–4350 CrossRef CAS; (c) A. G. Stack and M. C. Grantham, Cryst. Growth Des., 2010, 10, 1409–1413 CrossRef CAS; (d) Y. W. Wang, Y. Y. Kim, C. J. Stephens, F. C. Meldrum and H. K. Christenson, Cryst. Growth Des., 2012, 12, 1212–1217 CrossRef CAS.
- Q. Shen, H. Wei, Y. Zhou, Y. P. Huang, H. R. Yang, D. J. Wang and D. F. Xu, J. Phys. Chem. B, 2006, 110, 2994–3000 CrossRef CAS PubMed.
- S. M. D'Souza, D. C. Alexander, S. W. Carr, A. M. Waller, M. J. Whitcombe and E. N. Vulfson, Nature, 1999, 398, 312–316 CrossRef.
- X. Y. Liu, J. Chem. Phys., 2000, 112, 9949–9955 CrossRef CAS.
- J. Rieger, J. Thieme and C. Schmidt, Langmuir, 2006, 16, 8300–8305 CrossRef.
- J. Rieger, T. Frechen, G. Cox, W. Heckmann, C. Schmidt and J. Thieme, Faraday Discuss., 2007, 136, 265–277 RSC.
- (a) H. H. Adler and P. F. Kerr, Am. Mineral., 1962, 47, 700–717 CAS; (b) S. Gunasekaran, G. Anbalagan and S. Pandi, J. Raman Spectrosc., 2006, 37, 892–899 CrossRef CAS.
- J. Ahmed, M. Menaka and A. K. Ganguli, CrystEngComm, 2009, 11, 927–932 RSC.
- X. Wang, C. Wu, K. Tao, K. Zhao, J. Wang, H. Xu, D. Xia, H. Shan and J. R. Lu, J. Phys. Chem. B, 2010, 114, 5301–5308 CrossRef CAS PubMed.
- X. Wang, R. Kong, X. Pan, H. Xu, D. Xia, H. Shan and J. R. Lu, J. Phys. Chem. B, 2009, 113, 8975–8982 CrossRef CAS PubMed.
- A. J. Xie, Z. W. Yuan and Y. H. Shen, J. Cryst. Growth, 2005, 276, 265–274 CrossRef CAS.
- Q. Meng, D. Chen, L. Yue, J. Fang, H. Zhao and L. Wang, Macromol. Chem. Phys., 2007, 208, 474–484 CrossRef CAS.
- K. Naka, S. C. Huang and Y. Chujo, Langmuir, 2006, 22, 7760–7767 CrossRef CAS PubMed.
Footnotes |
| † Electronic supplementary information (ESI) available: Preparation procedure of the dye, SEM images of calcite and dissoluting vaterite, TEM image of vaterite, TGA profiles of CaCO3 precipitates. CCDC reference number 882733. For ESI and crystallographic data in CIF or other electronic format see DOI: 10.1039/c2ra20975f |
| ‡ Crystallographic details of the dye: C13H10N2O3, M = 242.23, Monoclinic (P 21/c), a = 14.1104(8), b = 4.8957(2), c = 21.0199(11) Å, β = 127.357° (3), V = 1154.20(10) Å3, Z = 4, Dc = 1.394 g cm−1, μ = 0.101 mm−1, T = 298(2)K, 14306 reflections, 2839 unique reflections (R1 = 0.0553), wR2 = 0.1702 (all data), GOF = 0.999. |
| This journal is © The Royal Society of Chemistry 2012 |
