Hierarchical bundles structure of β-NaLuF4: facile synthesis, shape evolution, and luminescent properties†
Na
Niu
,
Fei
He
,
Shaohua
Huang
,
Shili
Gai
,
Xiao
Zhang
and
Piaoping
Yang
*
Key laboratory of superlight materials and surface technology, Ministry of education, Harbin Engineering University, Harbin 150001, P. R. China. E-mail: yangpiaoping@hrbeu.edu.cn; Fax: +86 451 852569890; Tel: +86 451 85269890
First published on 4th September 2012
Abstract
Uniform β-NaLuF4 nanorod bundles have been prepared through a facile two-step chemical conversion route without using any surfactants or capping reagents. During the process, lutetium precursors with square morphology were first prepared by a urea-assisted precipitation process, which then grew into the β-NaLuF4 crystals under a mild hydrothermal condition. Different experimental parameters were examined to investigate the growth mechanisms of the lutetium precursors and the NaLuF4 crystals. It is found that uniform hexagonal NaLuF4 nanorod bundles can be obtained via a mild hydrothermal process of 180 °C for 24 h when using 0.5 g NaF and the lutetium precursors prepared with 0.18 g urea. Moreover, the down-conversion (DC) and up-conversion (UC) luminescent properties of NaLuF4 were also investigated through doping different rare earth ions (Eu3+, Tb3+, Ce3+/Tb3+, Yb3+/Er3+, and Yb3+/Ho3+). It has been shown that the existence of Ce3+ ion can dramatically enhance the emission intensity of Ln3+ ion. And under 980 nm laser excitation, the Yb3+/Er3+ and Yb3+/Ho3+ doped NaLuF4 samples exhibit light green and yellowish green UC luminescence, respectively. This effective and low-cost chemical conversion method, combined with the novel structure and excellent optical luminescent properties of the as-prepared β-NaLuF4 nanocrystals, may endow this luminescent structure with promising potential to serve as biomedical candidates, solid-state lasers and display devices.
1 Introduction
In recent years, rare earth (RE) fluorides (NaREF4 and REF3), with high refractive indexes and low phonon energies, have attracted great attention due to their wide potential applications in optical telecommunication, lasers, biochemical probes, infrared quantum counters, and medical diagnostics.1 In particular, the hexagonal β-NaYF4 crystals, with various dimensions and morphologies, have been investigated extensively in the past few years.2 With the same crystalline plane as β-NaYF4, β-NaLuF4 is also expected to be one kind of excellent host material, which however is less reported.3 Moreover, the Lu3+ ion may be more favorable than the Y3+ ion for trivalent lanthanide (Ln3+) dopants’ emission due to the intensity-borrowing mechanism mixing the 4f and 5d orbitals of the Ln3+ ions via the lattice valence band level.4 It was also found that the Lu3+ ion doping can remarkably tune the luminescent properties (e.g. brightness and long afterglow performance) through influence on the emitters’ electronic population life time.5 Therefore, it is expected that the β-NaLuF4 can exhibit some interesting and unexpected optical properties when substituted by various lanthanide ions.The assembling of nanoplates, nanorods, nanotubes, nanowires, and nanospheres into two- (2D) or three-dimensional (3D) hierarchical superstructures is an important subject to build functional nano-systems which has received great research attention.6 This is because from those well-defined architectures can emerge some unique optical and electronic properties in many cases, which endow them with great versatility for some specific applications.7 By now, a number of techniques have been developed to synthesize those special nano-structures, such as sol–gel route,8 solid-state combinatorial chemistry method,9 microwave assisted process,10 and chemical vapor synthesis.11 Besides, the chemical conversion process is also a promising technique to develop some special nano-/micro-structures which might be difficult or impossible to directly synthesize.12 During the reaction process, precursors are first prepared to serve as the further reactants, also to control the shapes of the final products as a template. Therefore, the morphology of final products is usually very similar to that of the initial precursors.13 However, in some cases, a notable change of the morphology may take place between the precursors and final products when the precursors undergo a transformation process from which new forms are produced.14
In the present work, we report for the first time the preparation of β-NaLuF4 nanorod assemblies through a facile hydrothermal assisted chemical conversion process. During the synthesis process, β-NaLuF4 nanorods are attached and aggregated together to form the bundles assembly structure. On the other hand, we investigate both the down- and up-conversion properties of the as-prepared β-NaLuF4 nanocrystals by doping with different kinds of lanthanide ions (Eu3+, Tb3+, Ce3+/Tb3+, Yb3+/Er3+, Yb3+/Ho3+). These doped β-NaLuF4 superstructures display strong DC and UC emissions, and as such they can serve as efficient hosts for both types of luminescent materials. The results indicate that this simple chemical conversion method is an effective way for the preparation of β-NaLuF4 phosphors, which can also be applied to prepare many other types of nanocrystals. Moreover, the special structural geometry and excellent optical luminescent properties of the as-prepared β-NaLuF4 nanocrystals, together with this easy and low-cost synthetic method, will endow this luminescent structure with promising potential to serve as biomedical candidates, solid-state lasers and display devices.
2 Experimental section
Chemicals and materials
The initial materials including analytical grade NaF, HNO3, Ce(NO3)3·6H2O, and urea were purchased from Sinopharm Chemical Reagent Co., Ltd. All the rare earth oxides used in this work including Lu2O3, Eu2O3, Tb4O7, Yb2O3, Er2O3, and Ho2O3 (99.99%) were purchased from Changchun Applied Chemistry Science and Technology Limited, China. All the chemicals were used as received without further purification.Synthesis of lutetium precursor nanoparticles
In a typical procedure, 1 mL of 1 M LuCl3 aqueous solution was first added to 50 mL deionized water. Then a designed amount of urea (0.06 g, 0.12 g, and 0.18 g) was introduced to the solution with magnetic stirring. After additional agitation for 1 h, the solution was moved to a water bath at 90 °C for 4 h. Then it was removed, cooled to room temperature naturally, washed with deionized water several times, and finally redispersed in 5 mL deionized water. Precursors with different reaction times were also prepared to investigate the formation process.Synthesis of NaLuF4 nanorod bundles
Typically, 0.5 g NaF was dissolved in 30 mL deionized water with magnetic stirring for 15 min. Then 5 mL as-prepared precursor suspension was added into the solution slowly with continuous stirring. After additional agitation for 30 min, the mixture was transferred into a 50 mL autoclave held in a stainless steel autoclave, sealed, and maintained at 180 °C for 24 h. After the autoclave cooled to room temperature naturally, the precipitate was separated by centrifugation, washed with deionized water and ethanol several times, and dried at 60 °C for 12 h to obtain the final products. The samples derived from precursors prepared with 0.06, 0.12, and 0.18 g urea are designated as NaLuF4-1, NaLuF4-2, and NaLuF4-3, respectively.In order to investigate the synthesis process, other samples were prepared through a similar procedure using different amounts of NaF or with different reaction times. In addition, NaLuF4:5%Eu3+, NaLuF4:5%Tb3+, NaLuF4:x%Ce3+,5%Tb3+ (x = 2, 5, 8, 10, and 15), NaLuF4:17%Yb3+,3%Er3+, and NaLuF4:17%Yb3+,3%Ho3+ were also prepared through a similar process except for adding a stoichiometric amount of corresponding RECl3 instead of LuCl3 aqueous solution at the initial stage. All the doping ratios of rare-earth ions are molar ratios in our experiments.
Characterization
XRD patterns were obtained on a Rigaku TR III diffractometer at a scanning rate of 10° min−1 in the 2θ range from 5° to 80°, with Cu-Kα radiation (λ = 0.15405 nm), accelerating voltage and emission current of 40 kV and 200 mA. SEM images were obtained using a scanning electron microscope (SEM, S4800, Hitachi) equipped with an energy-dispersive X-ray spectrometer (EDS, JEOL JXA-840). Transmission electron microscopy (TEM) was performed on a FEI Tecnai G2 S-Twin instrument with a field emission gun operating at 200 kV. Images were acquired digitally on a Gatan multiple CCD camera. The X-ray photoelectron spectra (XPS) were taken on a VG ESCALAB MK II electron energy spectrometer using Mg Kα (1253.6 eV) as the X-ray excitation source. Fourier transform infrared spectroscopy (FT-IR) was carried out on an ABB Bomen FTLA2000-100 spectrometer using KBr pellets. The photoluminescence (PL) measurements were performed on a Hitachi F-4500 spectrophotometer equipped with a 150 W xenon lamp as the excitation source. The UV–vis adsorption spectral values were measured on a TU-1901 spectrophotometer. The UC emission spectra were obtained using a 980 nm laser from an OPO (optical parametric oscillator, Continuum Surelite, USA) as the excitation source and detected by R955 (HAMAMATSU) from 400 to 800 nm. All the measurements were performed at room temperature.3 Results and discussion
Phase identification and morphology of lutetium precursor
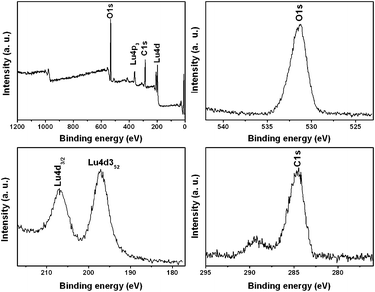
Fig. 1 shows the XRD patterns of the as-prepared lutetium precursors using different amounts of urea. It can be seen that all the diffraction peaks of the three patterns are very sharp and strong, which may indicate a high crystallinity of the samples. However, on the basis of the Joint Committee on Powder Diffraction Standards (JCPDS) reference database, a compound showing such a diffraction pattern cannot be found. Nevertheless, the diffraction peaks of the three samples are quite similar to each other in both their peak positions and the relative intensities, which means the three samples are the same compound. In order to further investigate the phase purity of as-prepared lutetium precursor and define its molecular formula, a series of other measurements were carried out. Fig. 2 gives the XPS results of the lutetium precursor prepared with 0.18 g urea. As shown, the binding energies of Lu 4d3/2, Lu 4d5/2, O1s, and C1s were found to be 207, 197, 531 and 284 eV, respectively, suggesting the existence of these elements in the precursor. The FT-IR spectrum of lutetium precursor prepared with 0.18 g urea is shown in Fig. 3. The broad band centred at 3418 cm−1 can be attributed to the stretching vibration of OH− group in the precursor.15 And the two strong peaks at 1443 and 1653 cm−1 can be assigned to the υ3 mode of carbonate. The other bands at approximately 1079, 842, and 785 (682) cm−1 are attributed to υ1, υ2, and υ4 modes of carbonate, respectively. In addition, the bending (550 cm−1) mode of Lu–OH can also be clearly found.16 It can be inferred from the above analysis that OH−, CO32–, Lu3+ and H2O groups exist in the precursor. Although we still cannot define the precise molecular formula of the precursor, it can be identified as a kind of lutetium subcarbonate (Lu(OH)CO3·nH2O) according to the above analysis and previous reports.17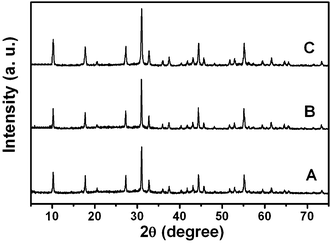 | ||
| Fig. 1 XRD patterns of lutetium precursors prepared with 0.06 g (A), 0.12 g (B) and 0.18 g (C) urea using a water bath at 90 °C for 4 h. | ||
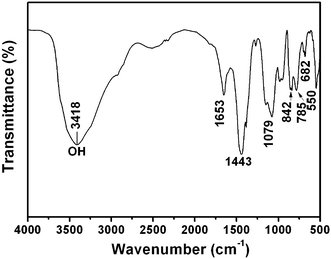 | ||
| Fig. 3 FT-IR spectrum of lutetium precursor prepared with 0.18 g urea using a water bath at 90 °C for 4 h. | ||
The typical SEM images of the lutetium precursors prepared with different amounts of urea (0.06, 0.12, and 0.18 g) are shown in Fig. 4A–C, respectively. As shown, the three samples exhibit a quite similar square morphology which is assembled by some small particles. What is more, when the urea amount is increased from 0.06 g to 0.18 g, the particle sizes of the precursors decrease and the shapes become more regular. In the EDS of the precursor prepared with 0.18 g urea (Fig. 4D), the element signals for Lu, O, and C (Si is due to the silicon slice used in the measurement process) can be detected, fitting well with the previous XPS and FT-IR results. The TEM image of the precursor prepared with 0.18 g urea is shown in Fig. 4E, from which we can clearly see the square morphology of the sample with the length of each side about 150–200 nm. A possible formation process of the lutetium precursor is proposed in Fig. 4F based on the time-dependent experiments (Fig. S1†). At the beginning, the urea breaks down at 90 °C to produce excessive OH− and CO32– in the solution, and small nuclei are formed (Fig. S1A†). With increasing reaction time, these as-formed nuclei slowly grow (Fig. S1B†) and self-assemble into the square shaped particles (Fig. S1B,C†). Further increasing the reaction time to 4 h, more larger and regular assembled particles are obtained (Fig. S1D†). Notably, the small urea amount (molar ratio of Lu/urea is 1–3) plays an important role in the self-assembly process. As the amount of urea is not highly excessive, the formation and growth of nuclei is difficult, and the formed nuclei tend to assemble together. Therefore, a slight increase of the urea amount may lead to a more regular growth of nuclei and a decrease of assembled particles. This can also explain why the precursor prepared here is very different to the previous reports of lutetium precursor nanowires prepared with ammonia and the spherical RE precursors prepared with 1.5 g urea.18
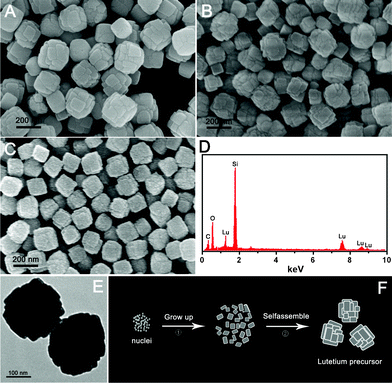 | ||
| Fig. 4 SEM images of lutetium precursors prepared with 0.06 g (A), 0.12 g (B) and 0.18 g (C) urea; EDS of lutetium precursor prepared with 0.18 g urea (D); TEM image of lutetium precursor prepared with 0.18 g urea (E); and schematic illustration for the formation process of lutetium precursor (F). | ||
Phase identification and morphology of NaLuF4
When the precursors reacted with 0.5 g NaF under hydrothermal conditions, hexagonal NaLuF4 crystals could be obtained. Fig. 5 gives the XRD and SEM images of the as-prepared NaLuF4 products using precursors prepared with 0.06, 0.12, and 0.18 g urea. We can see from the XRD patterns (Fig. 5A) that all the three samples can be well indexed to the pure hexagonal NaLuF4 phase (JCPDS No. 27–0726) and no impurity peaks can be observed. The calculated cell lattice parameters for the three samples are listed in Table 1, and the standard data of hexagonal NaLuF4 (JCPDS No. 27–0726) are also given for comparison. It can be seen that the calculated cell lattice parameters of the three samples are consistent with the standard data, revealing the high purity of the samples. Fig. 5B–D exhibit the SEM images of NaLuF4-1, NaLuF4-2, and NaLuF4-3, respectively. As shown, all the three samples exhibit similar nanorod bundles morphology. A more detailed investigation of NaLuF4-3, which possesses more uniform shape and size than those of NaLuF4-1 and NaLuF4-2, has been carried out, as shown in Fig. 6. Fig. 6A,B exhibit the SEM images with different magnifications. As shown, the as-prepared NaLuF4-3 sample is entirely comprised of nanorod bundles with uniform size. It can be seen from the TEM image (Fig. 6C) that the length of those nanorod bundles is about 2 μm, while the width is about 200 nm. The magnified TEM image (Fig. 6D) also reveals the as-prepared bundle-like morphology. And the width of the small nanorods composing the bundles is around 20–25 nm. The EDS pattern (Fig. 6E) of the NaLuF4 bundle reveals the existence of Na, Lu, and F elements (Si is due to the silicon slice used in the measurement process). The molar ratio of Na/Lu/F is determined to be 1/1.043/4.106, agreeing well with the theoretical value of 1/1/4. The HRTEM image (Fig. 6F) displays obvious lattice fringes with an interplanar spacing of 0.293 nm, which matches well with the d value of the (110) plane of the hexagonal-phased NaLuF4.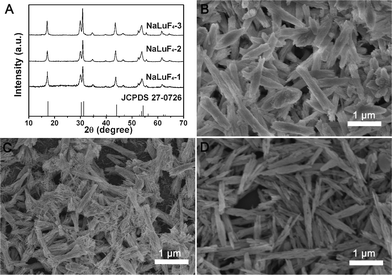 | ||
| Fig. 5 XRD patterns (A) and SEM images of NaLuF4 crystals synthesized at 180 °C for 24 h with different lutetium precursors: precursor prepared with 0.06 g urea (B), precursor prepared with 0.12 g urea (C), and precursor prepared with 0.18 g urea (D). All of the samples were obtained with 0.5 g NaF. | ||
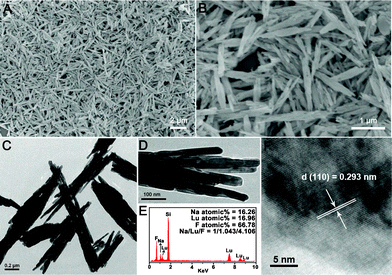 | ||
| Fig. 6 Low (A) and high (B) magnification SEM images, TEM images (C,D), EDS spectrum (D), and HRTEM image (F) of NaLuF4 crystals synthesized at 180 °C for 24 h using 0.5 g NaF and lutetium precursor prepared with 0.18 g urea. | ||
| Samples | a, b/Å | c/Å | Cell volume/Å3 |
|---|---|---|---|
| JCPDS 27–0726 | 5.901 | 3.453 | 104.13 |
| NaLuF4-1 | 5.928 | 3.489 | 104.97 |
| NaLuF4-2 | 5.902 | 3.490 | 104.52 |
| NaLuF4-3 | 5.890 | 3.481 | 104.39 |
It is noticeable that the morphology of the final NaLuF4 product and the precursors are quite different in our case, meaning the hydrothermal process has a significant influence on the morphology of the NaLuF4 crystals. Therefore, a series of time-dependent experiments were performed to gain an insight into the conversion process from the precursor to NaLuF4 crystals. The intermediate products obtained at different hydrothermal times were investigated by XRD and SEM, as shown in Fig. 7.
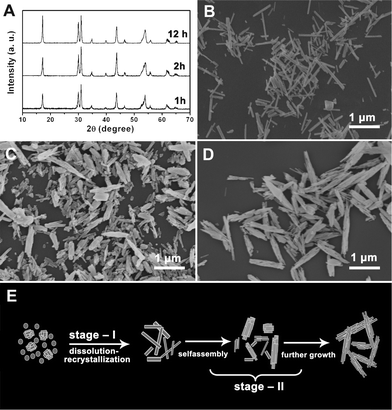 | ||
| Fig. 7 XRD patterns (A) and SEM images of NaLuF4 crystals synthesized at 180 °C for different reaction times: 1 h (B), 2 h (C), and 12 h (D); schematic illustration for the formation process of NaLuF4 crystals (E). All of the samples were obtained using 0.5 g NaF and lutetium precursor prepared with 0.18 g urea. | ||
As can be seen in Fig. 7A, hexagonal phase NaLuF4 was already formed when the reaction was carried out at 180 °C for 1 h, meaning the phase formation process is very fast. On the other hand, the morphology evolution process is gradual and slow, as evidenced by the SEM images. Samples collected after the hydrothermal reaction conducted for 1 h were of some irregular 1D nanorods, as shown in Fig. 7B. Herein, under the hydrothermal condition, the lutetium precursors quickly dissolved and reacted with NaF in the solution to form new NaLuF4 crystals. As the reaction time increased to 2 h, some of the nanorods assembled together into a bundle structure (Fig. 7C). As the reaction time is further increased to 12 h (Fig. 7D), the nanorods continuously aggregated to form more 3D nanorod bundles structures. And finally, well-crystallized β-NaLuF4 with uniform bundles superstructures was obtained (Fig. 6). Although the actual crystallization and growth process in solution is still complex and remains mysterious, we can simply conclude it as a so-called two-stage growth process, which involves a fast nucleation of primary particles and a slow aggregation and growth of primary particles.19 It is worthwhile to point out that the aggregation and growth of the as-prepared NaLuF4 nanorods bundles were totally spontaneous, since no surfactants or capping reagents were used during the formation process. A schematic illustration of the possible conversion processes is demonstrated in Fig. 7E. Initially, hydrothermal treatment of the precursor and NaF mixture led to the formation of NaLuF4 particles through a quick dissolution-recrystallization mechanism.20 The growth rates of different crystal facets were unequal due to the inhomogeneous nucleation and growth of primary particles, and small nanorods appeared. In the following stage, these separate nanorods tend to aggregate together along the long-axis in order to minimize the surface energy by reducing the exposed area. This step may be driven by several factors except for this thermodynamic demand, such as, crystal-face attraction, hydrogen bond interaction, and van der Waals forces.21
The effect of NaF content on the phase and morphology of as-synthesized NaLuF4 was also investigated. Fig. 8 shows the XRD patterns and SEM images of NaLuF4 synthesized using 0.16 g, 0.32 g, and 0.5 g NaF (the corresponding molar ratios of NaF/Lu are 4, 8, 12, respectively). It can be seen that when the NaF/Lu molar ratio is 4, the XRD pattern exhibits pure hexagonal NaLuF4 but with a very low crystallization (Fig. 8A). And its SEM image consists of rods of irregular width and length (Fig. 8B). When the molar ratio reaches 8, crystallization of the NaLuF4 crystals is improved (Fig. 8A). The shape of the sample is more regular and some of the rods assemble together (Fig. 8C). When the molar ratio increases to 12, highly crystalline hexagonal NaLuF4 nanorod bundles are obtained (Fig. 8D). It has been reported that excessive fluoride source in a hydrothermal process can promote the formation of hexagonal-phased NaREF4 since F− ions can decrease its crystallization temperature remarkably.22 The critical value of NaF/Ln for the phase transition from cubic to hexagonal is usually always 12. However, in the present work, when the ratio of NaF/Lu is 4, hexagonal NaLuF4 can be formed. It may be caused by two reasons. Firstly, during the hydrothermal conversion process, the lutetium precursor dissolves and then reacts with NaF which can form an oversaturation of NaF. Secondly, during the synthesis process of lutetium precursor, some of the Lu3+ ions may not react to form the products due to the low amount of urea used. Thus the NaF amount is relatively excessive in the hydrothermal process.
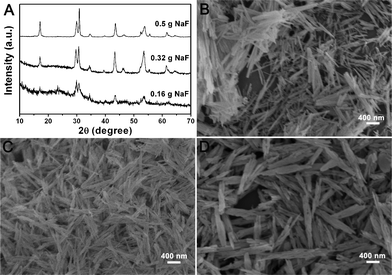 | ||
| Fig. 8 XRD patterns (A) and SEM images of NaLuF4 crystals synthesized at 180 °C for 24 h with different amounts of NaF: 0.16 g (B), 0.32 g (C), and 0.5 g (D). All of the samples were obtained using lutetium precursor prepared with 0.18 g urea. | ||
Luminescent properties
It is well known that β-NaREF4 is an excellent host lattice for the luminescence of various lanthanide ions. To investigate the luminescent properties of the as-prepared β-NaLuF4 nanorod bundles, we discussed the DC and UC luminescent properties of NaLuF4 doped with different RE ions.Fig. 9A exhibits the excitation and emission spectra of the NaLuF4:5%Eu3+, NaLuF4:5%Tb3+, NaLuF4:5%Ce3+,5%Tb3+, and their corresponding photographs taken under 254 nm UV lamp irradiation (all of the samples were synthesized at 180 °C for 24 h using 0.5 g NaF and lutetium precursor prepared with 0.18 g urea). As shown, the excitation and emission spectra of NaLuF4:5%Eu3+ and NaLuF4:5%Tb3+ are very similar to the previous reports of Eu3+ and Tb3+ doped crystals.23 The excitation spectrum of NaLuF4:5%Eu3+ consists of the characteristic excitation lines of Eu3+ within its 4f6 configuration from 200 to 400 nm. The peaks located at 319, 362, 378, and 395 nm can be assigned to the Eu3+ transitions of 7F0 → 5H6, 7F0 → 5D4, 7F0 → 5G2, and 7F0 → 5L6, respectively. Some weak lines at 253, 269, 287 and 299 nm can also be observed which have a small contribution to the excitation of Eu3+. Excitation into the strongest 7F0 → 5L6 transition of Eu3+ at 395 nm yields the emission spectrum of the sample, which is composed of the emission lines ascribed to the Eu3+ characteristic transitions of 5D1 → 7F1 (537 nm), 5D1 → 7F2 (556 nm), 5D0 → 7F1 (593 nm), 5D0 → 7F2 (615 nm). The excitation spectrum of NaLuF4:5%Tb3+ is composed of the characteristic transitions of Tb3+ within its 4f8 configuration, which can be assigned to the respective transitions of 7F6 → 5I6 (285 nm), 7F6 → 5H6 (306 nm), 7F6 → 5D0 (319 nm), 7F6 → 5G2 (342 nm), 7F6 → 5D2 (356 nm), 7F6 → 5G6 (370 nm) and 7F6 → 5D3 (380 nm). Upon excitation into the 7F6 → 5D2 transition at 356 nm, characteristic transitions of Tb3+ ion (5D4 → 7F6 at 491 nm, 5D4 → 7F5 at 544 nm, 5D4 → 7F4 at 585 nm, and 5D4 → 7F3 at 622 nm) can be observed. However, when 5% Ce3+ ion was co-doped with Tb3+ ion into the NaLuF4 matrix, a great change happens in the excitation spectrum. Compared to the excitation spectrum of NaLuF4:5%Tb3+, a broad band at about 250 nm can be observed in NaLuF4:5%Ce3+,5%Tb3+ which can be ascribed to the Ce3+ 4f1–5d1 characteristic transition.24 Moreover, the broad band replaces the Tb3+ 7F6 → 5D2 transition at 356 nm as the strongest excitation peak, indicating the energy transfer from Ce3+ to Tb3+ is dominant in NaLuF4:5%Ce3+,5%Tb3+.25 As for the emission spectra of NaLuF4:5%Ce3+,5%Tb3+, all of the emission lines are located at the same positions to those of NaLuF4:5%Tb3+. Furthermore, NaLuF4:x%Ce3+,5%Tb3+ with different Ce3+ concentrations (0%, 2%, 5%, 8%, 10%, 15%) were prepared. The co-doping of Ce3+ ion does not influence the phase nor the morphology of the NaLuF4 crystals, as can be seen in the XRD and SEM images of NaLuF4:x%Ce3+,5%Tb3+ (Fig. S2†). Fig. 9B shows their emission spectra excited under the same conditions. As can be seen, the emission intensities of the samples first enhance with the increasing of Ce3+ concentration (2% and 5%), and decrease on further increase of the Ce3+ doping concentration (8%, 10%, and 15%). The emission intensity of Tb3+ is enhanced by a maximum of about 11 times when co-doping of 5%Ce3+ ion with 5%Tb3+ ion occurs in the NaLuF4 crystals. It is believed that the energy transfer process plays an important role in improving the emission efficiency of materials. In the Tb3+ ion doped NaLuF4 crystals, the electronic transitions within the 4fn configurations of Tb3+ are strongly forbidden, resulting in the relatively weak emission intensity.26 However, in the 5%Ce3+ and 5%Tb3+ co-doped NaLuF4 samples, the Ce3+ ion acts as sensitizer, first to absorb the excitation energy, and then transfers it to the Tb3+ ions, where the energy is discharged as fluorescent emissions,27 and an effective improvement of the luminescence can be observed. The schematic energy level diagram of Ce3+ and Tb3+ is shown in Fig. S3.† It is worth noting that the enhancement of luminescence can be gained because the energy transfer process from Ce3+ to Tb3+ is efficient and no Ce3+–Ce3+ energy transfer occurs. Therefore, when further increasing the Ce3+ concentration, the more abundant Ce3+ ions may act as energy quenchers and cause the decrease of emission intensity.28
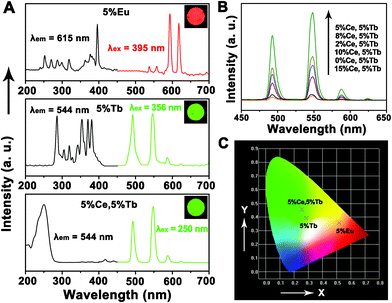 | ||
| Fig. 9 (A) Excitation (left) and emission spectra (right) of NaLuF4:5%Eu3+, NaLuF4:5%Tb3+, and NaLuF4:5%Ce3+,5%Tb3+ (inserts are the corresponding photographs taken under 254 nm UV lamp irradiation); (B) emission spectra of NaLuF4:x%Ce3+,5%Tb3+ (x = 0, 2, 5, 8, 10, 15) excited at 250 nm under the same condition; (C) the CIE chromaticities of NaLuF4:5%Eu3+, NaLuF4:5%Tb3+, and NaLuF4:5%Ce3+,5%Tb3+. | ||
Fig. 9C shows the CIE chromaticity diagram of NaLuF4:5%Eu3+, NaLuF4:5%Tb3+, and NaLuF4:5%Ce3+,5%Tb3+. The black crosses indicate the CIE chromaticity coordinate positions. The CIE coordinates for NaLuF4:5%Eu3+, NaLuF4:5%Tb3+, NaLuF4:5%Ce3+,5%Tb3+ are determined as x = 0.5174, y = 0.3567 (red region), x = 0.2855, y = 0.3925 (green region), and x = 0.2561, y = 0.4554 (green region), respectively. The CIE chromaticity coordinates of the samples agree well with the PL spectra and corresponding photographs in Fig. 9A.
The UC luminescent properties of the NaLuF4 crystals co-doped with 17% Yb3+ and 3% Ln3+ (Ln = Er and Ho) under 980 nm laser diode excitation were also investigated. As shown in Fig. 10A, the UC spectrum of NaLuF4:17%Yb3+,3%Er3+ consists of two green emission bands at 522 and 541, and one red emission band centred at 654 nm, which can be assigned to 2H11/2 → 4I15/2, 4S3/2 → 4I15/2, and 4F9/2 → 4I15/2 transitions of Er3+, respectively.29 As for NaLuF4:17%Yb3+,3%Ho3+ in Fig. 10B, two emission bands centered at 542 (green region) and 648 nm (red region) were observed, which correspond to the 5S2 → 5I8 and 5F5 → 5I8 transitions of Ho3+, respectively.30 Moreover, the positions and splittings of these optical transitions are comparable to those reported for Yb/Er and Yb/Ho co-doped single crystals,31 indicating that these ions have been successfully doped into the host lattice. Yet it should also be noted that the peak broadening and relative intensity ratios show some difference in the corresponding spectra, which may be due to the possible changes in the local structure around Er3+/Ho3+ and different surface group status in the as-prepared nanorod bundles structures.32 In order to investigate thoroughly the involved upconversion mechanisms in the as-prepared NaLuF4:Yb3+,Er3+ and NaLuF4:Yb3+,Ho3+ crystals, the excitation power-dependent UC emissions of green, and red were calculated. It is well known that the output UC luminescent intensity (IUC) is proportional to the infrared excitation power (IIR): IUC ∝ IIRn. Here the n represents the absorbed photon numbers per visible photon emitted, and its value can be obtained from the slope of the fitted line of the plot of log(IUC) versus log(IIR). As shown in Fig. 10C, the slopes of the linear fits of log(IUC) versus log(IIR) for the green, and red emissions in the as-prepared NaLuF4:17%Yb3+,3%Er3+ sample are 1.87, and 1.93, respectively, while the slopes in NaLuF4:17%Yb3+,3%Ho3+ for green, and red emissions are 1.84, and 1.88. The results indicate that a two-photon process is involved to produce the green and red UC emissions, which is consistent with the previous reports of the Yb3+,Er3+ and Yb3+,Ho3+ doped crystals.33 Based on this, the mechanism for the energy transfer process of Yb3+/Er3+/Ho3+ ions in the as-prepared NaLuF4:Yb3+,Er3+ and NaLuF4:Yb3+,Ho3+ crystals under 980 nm LD excitation is depicted in Fig. S4.† It can be seen that the green and red UC emissions of Yb3+/Er3+ and Yb3+/Ho3+ doped NaLuF4 all need a two-photon energy transfer process. The DC and UC luminescence results powerfully manifest that the as-synthesized hexagonal NaLuF4 nanorod bundles are an excellent host lattice for the luminescence of those ions. Fig. 10D shows the CIE chromaticity diagram of NaLuF4:17%Yb3+,3%Er3+, and NaLuF4:17%Yb3+,3%Ho3+. The CIE coordinates for NaLuF4:17%Yb3+,3%Er3+, and NaLuF4:17%Yb3+,3%Ho3+ are determined as x = 0.2722, y = 0.6772 (green region), and x = 0.3346 , y = 0.5831 (yellow region), respectively, which agrees well with the corresponding photographs inserted in Fig. 10A (light-green) and Fig. 10B (yellowish-green).
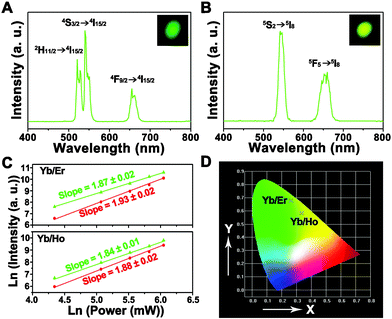 | ||
| Fig. 10 Upconversion luminescence spectra of (A) NaLuF4:17%Yb3+,3%Er3+ and (B) NaLuF4:17%Yb3+,3%Ho3+ crystals under 980 nm LD excitation (inserts are the corresponding photographs); (C) pump power dependence of the green, and red upconverted emissions in NaLuF4:17%Yb3+,3%Er3+ and NaLuF4:17%Yb3+,3%Ho3+; (D) the CIE chromaticities of NaLuF4:17%Yb3+,3%Er3+ and NaLuF4:17%Yb3+,3%Ho3+. | ||
4 Conclusion
In summary, NaLuF4 nanorod bundles have been controllably synthesized through a facile chemical conversion approach. The precursors and NaLuF4 crystals are well characterized by XRD, SEM, EDS, TEM, HRTEM, XPS, FT-IR, and PL. It is found that uniform hexagonal NaLuF4 nanorod bundles can be obtained using 0.5 g NaF and the lutetium precursors prepared with 0.18 g urea via a mild hydrothermal process of 180 °C for 24 h. The formation processes of the lutetium precursors and NaLuF4 nanorod bundles were also discussed based on time-dependant experiments. In addition, the DC luminescent properties of NaLuF4:5%Eu3+, NaLuF4:5%Tb3+, and NaLuF4:x%Ce3+,5%Tb3+, as well as the UC luminescent properties of NaLuF4:17%Yb3+,3%Er3+/Ho3+ were also investigated. It is found that the as-prepared hexagonal NaLuF4 crystals with a novel bundles structure present both excellent DC and UC properties, indicating they are an excellent host lattice, also proving the designed chemical conversion method is an effective way for the preparation of β-NaLuF4 phosphors.Acknowledgements
Financial supports from the National Natural Science Foundation of China (NSFC 21271053), Research Fund for the Doctoral Program of Higher Education of China (20112304110021), Harbin Sci.-Tech. Innovation Foundation (RC2012XK017012) and the Fundamental Research Funds for the Central Universities of China are greatly acknowledged.References
- (a) G. Wang, Q. Peng and Y. Li, Acc. Chem. Res., 2011, 44, 322 CrossRef CAS; (b) D. Tu, L. Liu, Q. Ju, Y. Liu, H. Zhu, R. Li and X. Chen, Angew. Chem., Int. Ed., 2011, 50, 6306 CrossRef CAS; (c) H.-X. Mai, Y. W. Zhang, R. Si, Z. G. Yan, L.D. Sun, L. P. You and C. H. Yan, J. Am. Chem. Soc., 2006, 128, 6426 CrossRef CAS; (d) Q. Ju, D. Tu, Y. Liu, R. Li, H. Zhu, J. Chen, Z. Chen, M. Huang and X. Chen, J. Am. Chem. Soc., 2012, 134, 1323 CrossRef CAS; (e) F. Wang, Y. Han, C. S. Lim, Y. Lu, J. Wang, J. Xu, H. Chen, C. Zhang, M. Hong and X. Liu, Nature, 2010, 463, 1061 CrossRef CAS; (f) H. T. Wong, F. Vetrone, R. Naccache, H. L. W. Chan, J. Hao and J. A. Capobianco, J. Mater. Chem., 2011, 21, 16589 RSC; (g) Z. H. Wang, J. H. Hao, H. L. W. Chan, W.-T. Wong and K.-L. Wong, Small, 2012, 8, 1863 CrossRef CAS; (h) Z. H. Wang, J. H. Hao, H. L. W. Chan, G.-L. Law, W.-T. Wong, K.-L. Wong, M. B. Murphy, T. Su, Z. H. Zhang and S. Q. Zeng, Nanoscale, 2011, 3, 2175 RSC.
- (a) F. Wang, R. Deng, J. Wang, Q. X. Wang, Y. Han, H. Zhu, X. Chen and X. Liu, Nat. Mater., 2011, 10, 968 CrossRef CAS; (b) F. Zhang and D. Zhao, ACS Nano, 2008, 3, 159 CrossRef; (c) G. Wang, Y. Li, B. Jiang, K. Pan, N. Fan, Q. Feng, Y. Chen and C. Tian, Chem. Commun., 2011, 47, 8019 RSC; (d) C. X. Li and J. Lin, J. Mater. Chem., 2010, 20, 6831 RSC; (e) H. T. Wong, H. L. W. Chan and J. Hao, Opt. Express, 2010, 18, 6123 CrossRef CAS; (f) Q. Ju, Y. Liu, D. Tu, H. Zhu, R. Li and X. Chen, Chem.–Eur. J., 2011, 17, 8549 CrossRef CAS; (g) G. P. Dong, B. B. Chen, X. D. Xiao, G. Q. Chai, Q. M. Liang, M. Y. Peng and J. R. Qiu, Nanoscale, 2012, 4, 4658 RSC; (h) Z. Chen, H. Chen, H. He, M. Yu, F. Li, Q. Zhang, Z. Zhou, T. Yi and C. Huang, J. Am. Chem. Soc., 2008, 130, 3023 CrossRef CAS.
- (a) Q. Liu, Y. Sun, T. S. Yang, W. Feng, C. G. Li and F. Y. Li, J. Am. Chem. Soc., 2011, 133, 17122 CrossRef CAS; (b) F. Shi, J. S. Wang, X. S. Zhai, D. Zhao and W. P. Qin, CrystEngComm, 2011, 13, 3782 RSC; (c) C. B. Tan, Y. X. Liu and W. B. Li, J. Mater. Sci., 2011, 46, 3066 CrossRef CAS; (d) C. Li, J. Yang, P. Yang, X. M. Zhang, H. Z. Lian and J. Lin and, Cryst. Growth Des., 2008, 8, 923 CrossRef CAS; (e) T. Yang, Y. Sun, Q. Liu, W. Feng, P. Yang and F. Li, Biomaterials, 2012, 33, 3733 CrossRef CAS; (f) S. Zeng, J. Xiao, Q. Yang and J. Hao, J. Mater. Chem., 2012, 22, 9870 RSC.
- (a) O. Guillot-Noël, B. Bellamy, B. Viana and D. Vivien, Phys. Rev. B: Condens. Matter, 1999, 60, 1668 CrossRef; (b) J. A. Capobianco, F. Vetrone, J. C. Boyer, A. Speghini and M. Bettinelli, Opt. Mater., 2002, 19, 259 CrossRef CAS.
- (a) D. Chen, Y. Wang and F. Weng, J. Phys. Chem. C, 2009, 113, 6406 CrossRef CAS; (b) A. Xia, M. Chen, Y. Gao, D. Wu, W. Feng and F. Li, Biomaterials, 2012, 33, 21 Search PubMed.
- (a) L. Lin, M. Liu, L. Chen, P. Chen, J. Ma, D. Han and L. Jiang, Adv. Mater., 2010, 22, 4826 CrossRef CAS; (b) H. M. Chen, C. K. Chen, Y.-C. Chang, C.-W. Tsai, R.-S. Liu, S.-F. Hu, W.-S. Chang and K.-H. Chen, Angew. Chem. Int. Ed., 2010, 49, 5966 CAS; (c) B. I. Lee and S. H. Byeon, Chem. Commun., 2011, 47, 4093 RSC; (d) Y. Wang, F. Wang, B. Chen, H. Xu and D. Shi, Chem. Commun., 2011, 47, 10350 RSC; (e) Y. Wang, Q. S. Zhu and H. G. Zhang, Chem. Commun., 2005,(41), 5231 RSC; (f) H. S. Cho, Z. Dong, G. M. Pauletti, J. Zhang, H. Xu, H. Gu, L. Wang, R. C. Ewing, C. Huth, F. Wang and D. Shi, ACS Nano, 2010, 4, 5398 CrossRef CAS.
- Z. Li, Z. Wang, L. Wang and H. Qian, CrystEngComm, 2011, 13, 7009 RSC.
- P. Periyat, F. Laffir, S. A. M. Tofail and E. Magner, RSC Adv., 2011, 1, 1794 RSC.
- L. Zhang, G. Xie, J. Hui, B. Xu, G. Xiang and X. Wang, RSC Adv., 2012, 2, 3204 RSC.
- M. L. Moreira, J. Andres, V. R. Mastelaro, J. A. Varela and E. Longo, CrystEngComm, 2011, 13, 5818 RSC.
- H. Sugimura, T. Moriguchi, M. Kanda, Y. Sonobayashi, H. M. Nishimura, T. Ichii, K. Murase and S. Kazama, Chem. Commun., 2011, 47, 8841 RSC.
- (a) H. S. Kim, T. K. Sung, S. Y. Jang, Y. Myung, Y. J. Cho, C. W. Lee, J. Park, J. P. Ahn, J. G. Kim and Y. J Kim, CrystEngComm, 2011, 13, 2091 RSC; (b) U. Jeong, P. H. C. Camargo, Y. H. Lee and Y. Xia, J. Mater. Chem., 2006, 16, 3893 RSC.
- F. Dawood and R. E. Schaak, J. Am. Chem. Soc., 2008, 131, 424 CrossRef.
- (a) G. Jia, H. You, L. Zhang, Y. Zheng, K. Liu, Y. Huang and H. Zhang, CrystEngComm, 2009, 11, 2745 RSC; (b) W. Zhu, X. Wang, X. Zhang, H. Zhang and Q. Zhang, Cryst. Growth Des., 2011, 11, 2935 CrossRef CAS.
- Y. S. Wang, M. S. Hassan, P. Gunawan, R. Lau, X. Wang and R. J. Xu, J. Colloid Interface Sci., 2009, 339, 69 CrossRef CAS.
- J. Yang, C. Li, Z. Quan, C. Zhang, P. Yang, Y. Li, C. Yu and J. Lin, J. Phys. Chem. C, 2008, 112, 12777 CAS.
- (a) P. Yang, S. Gai, Y. Liu, W. Wang, C. Li and J. Lin, Inorg. Chem., 2011, 50, 2182 CrossRef CAS; (b) F. He, P. Yang, D. Wang, C. Li, N. Niu, S. Gai and M. Zhang, Langmuir, 2011, 27, 5616 CrossRef CAS.
- (a) G. Jia, H. P. You, Y. H. Song, J. J. Jia, Y. H. Zheng, L. H. Zhang, K. Liu and H. J. Zhang, Inorg. Chem., 2009, 48, 10193 CrossRef CAS; (b) Z. Xu, Y. Cao, C. Li, P. A. Ma, X. Zhai, S. Huang, X. Kang, M. Shang, D. Yang, Y. Dai and J. Lin, J. Mater. Chem., 2011, 21, 3686 RSC; (c) Z. Xu, P. A. Ma, C. Li, Z. Hou, X. Zhai, S. Huang and J. Lin, Biomaterials, 2011, 32, 4161 CrossRef CAS.
- (a) L.S. Zhong, J. S. Hu, H. P. Liang, A. M. Cao, W. G. Song and L. Wan, Adv. Mater., 2006, 18, 2426 CrossRef CAS; (b) J. Xiao and S. Yang, RSC Adv., 2011, 1, 588 RSC.
- (a) L. Yan, R. Yu, J. Chen and X. Xing, Cryst. Growth Des., 2008, 8, 1474 CrossRef CAS; (b) C. Li, C. Zhang, Z. Hou, L. Wang, Z. Quan, H. Lian and J. Lin, J. Phys. Chem. C, 2009, 113, 2332 CrossRef CAS.
- L. Xu, J. Shen, C. Lu, Y. Chen and W. Hou, Cryst. Growth Des., 2009, 9, 3129 CAS.
- (a) M. Estermann, L. B. Mclusker, C. Baerlocher, A. Merrouche and H. Kessler, Nature, 1991, 352, 320 CrossRef CAS; (b) J. Zhao, Y. Sun, X. Kong, L. Tian, Y. Wang, L. Tu, J. Zhao and H. Zhang, J. Phys. Chem. B, 2008, 112, 15666 CrossRef CAS.
- (a) Y. Liu, D. Tu, H. Zhu, R. Li, W. Luo and X. Chen, Adv. Mater., 2010, 22, 3266 CrossRef CAS; (b) Z. L. Wang, Z. W. Quan, P. Y. Jia, C. K. Lin, Y. Luo, Y. Chen, J. Fang, W. Zhou, C. J. O'Connor and J. Lin, Chem. Mater., 2006, 18, 2030 CrossRef CAS; (c) W. T. Carnall, G. L. Goodman, K. Rajnak and R. S. Rana, J. Chem. Phys., 1989, 90, 3443 CrossRef CAS; (d) Y. Wang, Y. Liu, Q. Xiao, H. Zhu, R. Li and X. Chen, Nanoscale, 2011, 3, 3164 RSC; (e) G. P. Dong, X. F. Liu, X. D. Xiao, B. Qian, J. Ruan, S. Ye, H. C. Yang, D. P. Chen and J. R. Qiu, Nanotechnology, 2009, 20, 055707 CrossRef.
- (a) C. Cao, H. K. Yang, J. W. Chung, B. K. Moon, B. C. Choi, J. H. Jeong and K. H. Kim, J. Mater. Chem., 2011, 21, 10342 RSC; (b) C. K. Duan, P. A. Tanner, V. Makhov and N. Khaidukov, J. Phys. Chem. A, 2011, 115, 8870 CrossRef CAS; (c) R. S. Liu, Y.-H. Liu, N. C. Bagkar and S. F. Hu, Appl. Phys. Lett., 2007, 91 Search PubMed.
- (a) L. Yu, H. Song, Z. Liu, L. Yang and S. L. Z. Zheng, J. Phys. Chem. B, 2005, 109, 11450 CrossRef CAS; (b) T. S. Chan, C. L. Dong, Y. H. Chen, Y. R. Lu, S. Y. Wu, Y. R. Ma, C. C. Lin, R. S. Liu, J. L. Chen, J. Guo, J. F. Lee, H. S. Sheu, C. C. Yang and C. L. Chen, J. Mater. Chem., 2011, 21, 17119 RSC.
- (a) Z. L. Wang, H. Chan, H. Li and J. H. Hao, Appl. Phys. Lett., 2008, 93 Search PubMed; (b) T. S. Chan, C.-C. Kang, R. S. Liu, L. Chen, X. N. Liu, J. J. Ding, J. Bao and C. Gao, J. Comb. Chem., 2007, 9, 343 CrossRef CAS.
- H. Lai, A. Bao, Y. Yang, Y. Tao, H. Yang, Y. Zhang and L. Han, J. Phys. Chem. C, 2008, 112, 282 CAS.
- (a) X. Chen, E. Ma and G. Liu, J. Phys. Chem. C, 2007, 111, 10404 CrossRef CAS; (b) Z. L. Wang, J. H. Hao and H. L. W. Chan, J. Mater. Chem., 2010, 20, 3178 RSC; (c) X. F. Liu, Y. Z. Chi, G. P. Dong, E. Wu, Y. B. Qiao, H. P. Zeng and J. R. Qiu, Opt. Express, 2009, 17, 5885 CrossRef CAS.
- Y. Huang, H. You, G. Jia, Y. Song, Y. Zheng, M. Yang, K. Liu and N. Guo, J. Phys. Chem. C, 2010, 114, 18051 CAS.
- H. L. Wen and P. A. Tanner, Opt. Mater., 2011, 33, 1602 CrossRef CAS.
- (a) S. J. Zeng, G. Z. Ren and Q. B. Yang, J. Alloys Compd., 2010, 493, 476 CrossRef CAS; (b) Y. Guyout, R. Moncorge, L. D. Merkle, A. Pinto, B. Mclntosh and H. Verdun, Opt. Mater., 1996, 5, 127 CrossRef.
- E. W. Barrera, M. C. Pujol, F. Díaz, S. B. Choi, F. Rotermund, K. H. Park, M. S. Jeong and C. Cascales, Nanotechnology, 2011, 22, 075205 CrossRef.
- (a) J. H. Hao, Y. Zhang and X. H. Wei, Angew. Chem., Int. Ed., 2011, 50, 6876 CrossRef CAS; (b) X. Chen, E. Ma, G. Liu and M. Yin, J. Phys. Chem. C, 2007, 111, 9638 CrossRef CAS.
Footnote |
| † Electronic Supplementary Information (ESI) available: SEM images of precursors prepared with different times; XRD patterns and SEM images of NaLuF4 doped with different Ce concentrations; and simplified energy level of Ce/Tb, Yb/Er/Ho. See DOI: 10.1039/c2ra20991h |
| This journal is © The Royal Society of Chemistry 2012 |

