Controlled one dimensional oscillation of the Belousov–Zhabotinsky reaction confined within microchannels
Sammer-ul
Hassan
a,
Fabrice
Gielen
a,
Xize
Niu
*bc and
Joshua B.
Edel
*a
aDepartment of Chemistry, Imperial College London, South Kensington, London, SW7 2AZ, United Kingdom. E-mail: joshua.edel@imperial.ac.uk
bFaculty of Engineering and the Environment, University of Southampton, Southampton, SO17 1BJ, United Kingdom
cInstitute for Life Sciences, University of Southampton, Southampton, SO17 1BJ, United Kingdom. E-mail: x.niu@soton.ac.uk
First published on 13th June 2012
Abstract
The Belousov–Zhabotinsky reaction was performed in microdroplets confined in rectangular microchannels. In addition to producing one-dimensional waves, the reaction showed an increase in oscillation frequency thought to be mainly due to bromine diffusion out of the microdroplets. We found that surfactant loaded mineral oil can be used as an encapsulation agent to not only extend the stable reaction time from 200 s to approximately 800 s, but more importantly to further extend the one-dimensional wave formation from ∼15 s to 800 s.
The Belousov–Zhabotinsky (BZ) reaction is a common form of an oscillatory chemical diffusion limited system. It shows temporal oscillations which can be observed as a colour change. For example, the reaction oscillates between colourless and yellow when cerium ions are used as a catalyst1 or between red and blue when ferroin is used.2 The detailed mechanism of the BZ reaction was first described by Field, Körös, and Noyes3 (FKN). Bromide ions are removed from the system by reaction with bromate ions. Finally Br2 gas is produced which further reacts with malonic acid (MA) to form bromomalonic acid (BrMA). Furthermore, HBrO2 (bromous acid) is also produced in the system and oxidises the metal ion catalyst. BrMA goes on to reduce the metal ion catalyst and results in the formation of bromide ions resulting in the chemical reaction starting over again. This reaction has been shown to produce multiple oscillations by regeneration of the reduced form of the metal ion catalyst and inhibiting the reaction by bromide ions. Therefore controlling the bromide ion concentration is key to the recovery from inhibition and the start of the next wave.4–6
Characterization of this unique reaction has resulted in significant interest over the past couple of years. Examples include external frequency control with temperature,7–9 light induced shifts in chemical oscillations,10–13 and the monitoring of the concentration dependence on frequency.14–16 Recently, miniaturization of the BZ reaction has held great promise in providing well-defined volumes, and boundaries. For example, previous studies17,18 have highlighted that greater control and reproducibility can be achieved by downsizing the reaction in small volume microdroplets. Furthermore, such small volumes have also been used to study the effect on chemical wave formation,19 and the vectorial transport delivered by one-dimensional chemical waves generated in a BZ medium.20
Unfortunately, to date, the exacting nature of the oscillatory pattern has yet to be fully explored within small confined volumes. Herein we study the reaction in a semi-open environment where a single microdroplet is inserted into an open-top rectangular microchannel. We show that confinement in a microchannel allows reproducible production of one-dimensional waves, and that controlled encapsulation using an oil phase not only stabilizes the reaction but also ensures that single frequency one-dimensional waves can be produced over several minutes.
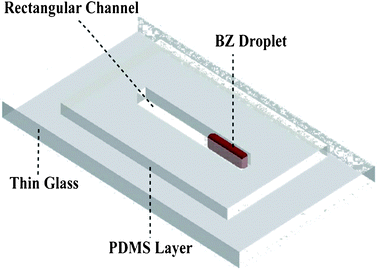
Fig. 1 shows a schematic of the platform used, which consists of a PDMS (SYLGARD® 184 silicone elastomer, Dow Corning) open channel bonded to a thin glass cover slide (borosilicate glass, thickness #1). The channel was fabricated by cutting a block of cured PDMS to a channel dimension of 1.45 cm in length, and 800 μm × 800 μm in width and height. Initially, two solutions were used and incorporated into the channel in the shape of a droplet. Solution A contained sulphuric acid (3 M), malonic acid (1.5 M), sodium bromate (1.125 M) and sodium bromide (0.75 M), and was stirred until the solution became colourless, while solution B contained ferroin (0.005 M). Solutions A and B were mixed with a volume ratio of 70% and 30%, respectively. Upon mixing, the induction time (the time before the start of the oscillations) was found to be dependent on the mixing state of the solution and could not be accurately controlled. Importantly, we found that oscillations can only occur with a detectable colour change when the droplet is static in the channel. Soon after the induction time finished, oscillatory chemical waves were observed as a colour change from red to blue.
 | ||
| Fig. 1 Schematic of the PDMS–glass channel for the observation and control of the BZ reaction. | ||
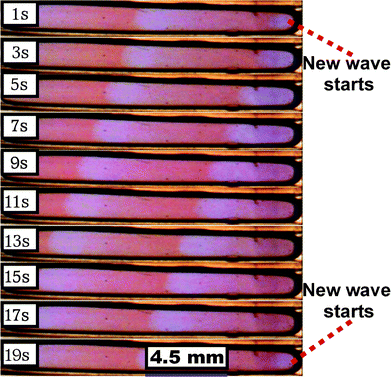
As shown in Fig. 2, the length of the droplet is much bigger than its width and height and as a result one-dimensional oscillations were observed. The direction of the oscillatory chemical waves followed the longitudinal axis of the droplet. Oscillatory waves started from one point which is known as the excitatory point and gradually moved away to the other side of the droplet. Occasionally, two different excitatory points were observed; however, they eventually merged into a one-dimensional wave.
 | ||
| Fig. 2 Images of one-dimensional waves produced in a 1.5 μl droplet taken between time periods between 1–19 s. | ||
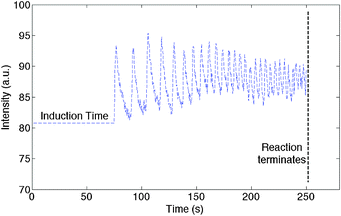
ImageJ processing software was used to characterize the temporal colour change as shown in Fig. 3 as a plot of average pixel intensity (measured in the middle of the droplet) versus time. A gradual increase in the oscillation frequency was observed as time increased. This was found to be consistent for droplets ranging between 0.1 to 5 μL. Such an increase is believed to be due to the gradual loss of bromine in the reactants over the time period of the oscillations.18 Correspondingly the amount of bromomalonic acid produced in the system decreases and hence the reduction of the metal ion decreases, which can be observed as the reduced intensity of the red colour in the droplet. In the system described, the reaction ended and the droplet turned blue after approximately 250 to 300 s. Here, malonic acid decomposes in the presence of concentrated sulphuric acid and evolves carbon dioxide as an oscillatory gas.21 We observed the evolution of carbon dioxide gas and bubble generation in the droplet. The bubbles can deform the chemical waves but have no detectable effect on the frequency of the oscillation.
 | ||
| Fig. 3 Monitoring the frequency of the colour change as a function of time in a 1.5 μl droplet. | ||
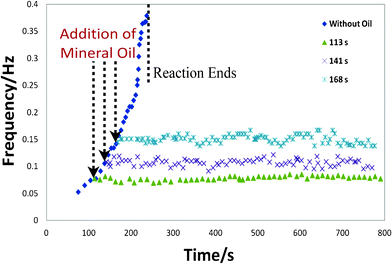
Water in oil microdroplets have been used extensively in recently years to further understand the BZ reaction.22, 23 For example, Gorecka and co-workers24 studied the effects of reagent concentration on oscillatory behaviour within droplets surrounded by hydrocarbons. Interestingly, the droplets proved to be both highly chemically and mechanically stable. In our experiments below, we develop this further, by encapsulating the droplet within oil. This process directly controls the rate of release of bromine from the droplet to the local surroundings. To this end, we added 2 μl mineral oil with 3% ABIL surfactant into the channel. As the aqueous droplet is denser than the mineral oil, the droplet was fully encapsulated within the oil phase. We found that such an encapsulation process elongates the reaction time dramatically to more than 800 s. This is approximately 4 times longer than what is shown in both Fig. 3 and the literature. Furthermore, it was found that the thickness of the oil layer was an important parameter in controlling the stability of the reaction. Generally, the greater the thickness of the encapsulating oil, the more stable the reaction. Experimentally, we found that a volume of 2 μl of the encapsulating oil was sufficient to ensure a stable reaction for more than 800 s. This method of stabilizing the bromine concentration was an effective method for controlling the reaction in a facile manner. Furthermore, this encapsulation process allowed for the precise control over the oscillating frequency. To demonstrate the level of control that can be obtained, Fig. 4 highlights that the reaction can be easily stabilized at varying frequencies between 0.05–0.16 Hz with a negligible change in the oscillation rate over the course of the reaction simply by adding the oil at varying time points from the onset of the reaction.
 | ||
| Fig. 4 A comparison between the reaction being performed with and without oil encapsulation. The oil was added at varying time points (113, 141, and 168 s) from the onset of the reaction. | ||
In summary, we have presented a microfluidic system that can be used to characterize BZ reactions in microlitre droplets. We show that we can precisely control the frequency of the reaction simply by varying the quantity and incorporation time of the oil phase. Such a system holds great promise in providing a better understanding of the one-dimensional oscillatory behaviour.
References
- A. T. Winfree, J. Chem. Educ., 1984, 61, 661 CrossRef.
- A. M. Zhabotinsky, Nature, 1970, 225, 535 Search PubMed.
- R. J. Field, E. Körös and R. M. Noyes, J. Am. Chem. Soc., 1972, 94, 8649 CrossRef CAS.
- V. Petrov, Q. Ouyang and H. L. Swinney, Nature, 1997, 388, 655 CrossRef CAS.
- D. Golomb and G. B. Ermentrout, Phys. Rev. Lett., 2001, 86, 4179 CrossRef CAS.
- V. K. Vanag, A. M. Zhabotinsky and I. R. Epstein, Phys. Rev. Lett., 2001, 86, 552 CrossRef CAS.
- P. Ruoff, Phys. D, 1995, 84, 204–211 CrossRef CAS.
- M. Macia, N. Marchettini, V. Zambrano and M. Rustici, Chem. Phys. Lett., 2001, 341, 285–291 CrossRef.
- J. Novak, B. W. Thompson, M. C. T. Wilson, A. F. Taylor and M. M. Britton, Phys. Chem. Chem. Phys., 2011, 13, 12321–12327 RSC.
- V. Petrov, Q. Ouyang, G. Li and H. L. Swinney, J. Phys. Chem., 1996, 100, 18992–18996 CrossRef CAS.
- B. Marts, D. J. W. Simpson, A. Hagberg and A. L. Lin, Phys. Rev. E, 2007, 76, 026213 CrossRef.
- M. K. Ram Reddy, Zs. Nagy-Ungvarai and S. C. Muller, J. Phys. Chem., 1994, 98, 12255–12259 CrossRef CAS.
- K. Martinez, A. L. Lin, R. Kharrazian, X. Sailer and H. L. Swinney, Phys. D, 2002, 168–169, 1–9 CrossRef CAS.
- M. D. Eager, M. Santos, M. Dolnik, A. M. Zhabotinsky, K. Kustin and I. R. Epstein, J. Phys. Chem., 1994, 98, 42 CrossRef.
- M. Leda, M. Toiya, A. M. Zhabotinsky and I. R. Epstein, J. Phys. Chem, A, 2009, 11, 5644–5648 Search PubMed.
- L. Treindl and P. Ruoff, J. Phys. Chem. A, 1997, 101, 4606–4612 CrossRef CAS.
- M. Toiya, H. O. Gonzalez-Ochoa, V. K. Vanag, S. Fraden and I. R. Epstein, J. Phys. Chem. Lett., 2010, 1, 1241–1246 CrossRef CAS.
- J. Delgado, N. Li, M. Leda, H. O. Gonzalez-Ochoa, S. Fraden and I. R. Epstein, Soft Matter, 2011, 7, 3155 RSC.
- Hi. Kitahata, N. Yoshinaga, K. H. Nagai and Y. Sumino, Phys. Rev. E, 2011, 84, 015101(R) CrossRef.
- T. Ichino, T. Asahi, H. Kitahata, N. Magome, K. Agladze and K. Yoshikawa, J. Phys. Chem. C, 2008, 112, 3032–3035 CAS.
- P. Syevcik, D. Misicak and L. Adamcikova, J. Phys. Chem. A, 2007, 111, 10050–10054 CrossRef.
- A. B. Theberge, F. Courtois, Y. Schaerli, M. Fischlechner, C. Abell, F. Hollfelder and W. T. S. Huck, Angew. Chem. Int. Ed, 2010, 49, 5846–5868 CAS.
- A. Huebner, S. Sharma, M. Sirisa-Art, F. Hollfelder, J. B. Edel and A. J. deMello, Lab Chip, 2008, 8, 1244–1254 RSC.
- J. Gorecki, J. Szymanski and J. N. Gorecka, J. Phys. Chem. A, 2011, 115, 8855–8859 CrossRef CAS.
| This journal is © The Royal Society of Chemistry 2012 |
