DOI:
10.1039/C2RA21052E
(Paper)
RSC Adv., 2012,
2, 10907-10915
Fluorescein-polyethyleneimine coated gadolinium oxide nanoparticles as T1 magnetic resonance imaging (MRI)–cell labeling (CL) dual agents†
Received
28th May 2012
, Accepted 7th September 2012
First published on 11th September 2012
Abstract
We report the synthesis, characterization and application of highly water-soluble fluorescein-polyethyleneimine (PEI) coated gadolinium oxide (Gd2O3) nanoparticles to magnetic resonance imaging (MRI) and cell labeling (CL). The average particle diameter and average hydrodynamic diameter were estimated to be 3.92 and 7.5 nm, respectively. Fluorescein-PEI was prepared from EDC/NHS coupling method. The surface coating was characterized by the FT-IR absorption spectrum and the surface coating amount was estimated to be 22.42 wt% from a TGA analysis, corresponding to 0.65 nm−2 grafting density. The fluorescein-PEI coated gadolinium oxide nanoparticles showed r1 and r2 of 6.76 and 20.27 s−1mM−1, respectively, and a strong fluorescence at ∼527 nm. A pronounced positive contrast enhancement was clearly observed in 3 tesla T1 MR images of a rat with a liver tumor after injection of an aqueous sample solution into a rat tail vein. After treatment of DU145 cells with a sample solution, a strong fluorescence in confocal images was also observed. These two results together confirm the excellent MRI-CL dual functionality of fluorescein-PEI coated gadolinium oxide nanoparticles.
Introduction
Highly sensitive dual molecular imaging agents will play a vital role in diagnosing diseases in the near future because they can provide complementary information in analyzing diseases.1,2 For example, a magnetic resonance imaging (MRI) agent combined with a cell labeling (CL) agent can be used in labeling cancer cells and acquiring high resolution spatial images around them. Cancer cells can then be analyzed after sampling out from the body. In this work, a highly sensitive gadolinium oxide nanoparticle as a T1 MRI contrast agent is combined with fluorescein as a CL agent.
MRI is a very useful technique in diagnosing diseases because of its high spatial resolution and good sensitivity.3 Detection of diseases can be further improved by using MRI contrast agents through contrast enhancement.4–10 MRI can be also combined with a variety of other molecular imaging techniques such as X-ray computed tomography (CT), positron emission tomography (PET) and fluorescent imaging (FI). Therefore, development of dual imaging agents is very important.
This work deals with fluorescein coated gadolinium oxide nanoparticles. They are promising candidates as either T1 MRI-CL or MRI-FI dual agents because gadolinium oxide nanoparticles show a longitudinal relaxivity (r1) which is much larger than those of Gd(III)-chelates11–26 while dyes generally provide a very strong fluorescent intensity.27 The enhanced r1 of gadolinium oxide nanoparticles with respect to those of Gd(III)-chelates is due to a high density of probing Gd(III) ions in nanoparticles.
Various dyes had been combined with MRI contrast agents so far. For instance, Cy5.5-cross linked iron oxide (CLIO) nanoparticles in which Cy5.5 is a near-infrared emitter, has been applied to pre-operative MRI and intra-operative optical brain tumor delineation to determine tumor margins for surgery.28 Fluorescent hydrid paramagnetic Gd2O3 nanoparticles conjugated with FITC, RBITC and Cy5 have been also applied to in vivo MRI-FI dual imaging.20 Fluorescein-loaded PLGA nanoparticles with surface modification with monoclonal antibody have been applied to targeting and labeling cancer cells.29 Note that for clinical applications, gadolinium oxide nanoparticles must be biocompatible and completely excreted from the body through the renal system to avoid any danger such as nephrogenic systemic fibrosis.30 Therefore, nanoparticles should be well-coated with water-soluble and biocompatible ligands. In this work, fluorescein is conjugated to hydrophilic and biocompatible polyethyleneimine (PEI) (Mn = ∼1200 amu) to improve both water-solubility and biocompatibility of fluorescein through the EDC/NHS coupling method.31 Finally, fluorescein-PEI was conjugated to gadolinium oxide nanoparticles.
In this work, we demonstrated MRI-CL dual functionality of fluorescein-PEI coated gadolinium oxide nanoparticles both in vivo and in vitro. We measured relaxivities and 3 tesla T1 MR images of a rat with a liver tumor after injection of a sample solution into a rat tail vein. We took fluorescent confocal images of DU145 cells after incubating them with a sample solution.
Experimental
Synthesis
GdCl3·xH2O (99.9%), NaOH (>99.9%), H2O2 (50% in water), triethylene glycol (99%), polyethylenimine (PEI) (50% in water, Mn = ∼1200 amu), phosphate buffer solution (PBS) (pH = 7.2), HCl (>99%), N-hydroxysuccinimide (NHS) (98%), 1-ethyl-3 (3-dimethylaminopropyl) carbodiimide (EDC) (>97%), fluorescein (95%), D2O (100%) and dimethyl sulfoxide (DMSO-d6) (99.96%) were used. These chemicals were purchased from Sigma-Aldrich and used as received. Sterile phosphate buffer saline solution, DMEM and RPMI1640 culture media were purchased from GIBCO BRL, USA. Triply distilled water was used throughout the experiments.
A reaction scheme is presented in Fig. 1a. 2 mmol of GdCl3·xH2O was added to 20 mL of triethylene glycol in a three-necked flask and magnetically stirred at 80 °C and under atmospheric condition until the precursor was completely dissolved in triethylene glycol. Then, 6 mmol of NaOH was added to the precursor solution and magnetic stirring continued for 2 h. Then, 3.5 mL of H2O2 solution was added to the reaction solution which was then magnetically stirred for an additional 2 h. The product solution was cooled to room temperature and then transferred into a 1 L beaker containing 500 mL of triply distilled water. It was magnetically stirred for 30 min and stored for a week or so until nanoparticles settled down to the beaker bottom. The top transparent solution was decanted and the remaining product solution was again washed with triply distilled water. This procedure was repeated three times.
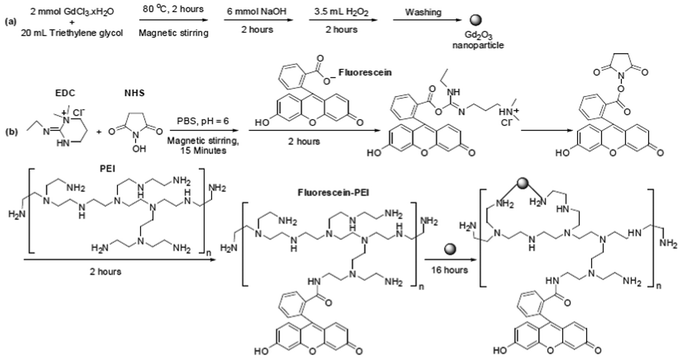 |
| | Fig. 1 Reaction schemes for the syntheses of (a) gadolinium oxide nanoparticles and (b) fluorescein-PEI and fluorescein-PEI coated gadolinium oxide nanoparticles. Here, the above fluorescein-PEI structure is only one of the possible structures because fluorescein can form amide bonds with any of the amine groups in PEI. | |
Fluorescein-PEI was synthesized by using the EDC/NHS coupling method.31 A reaction scheme for this process is shown in Fig. 1b. Briefly, 2 mmol of EDC and 2 mmol of NHS were added to 20 mL of PBS (pH = 6) at room temperature and under atmospheric condition. Here, a pH = 6 of PBS was obtained by slowly adding 1 mM HCl dropwise to the original PBS with pH = 7.2. After magnetic stirring for 15 min, 0.1 mmol of fluorescein was added to the solution and then the solution was magnetically stirred for 2 h. Then, 1.2 mL of PEI solution was added to the above solution with magnetic stirring for an additional 2 h to obtain fluorescein-PEI. Here, the fluorescein-PEI structure given in Fig. 1b is arbitrary (i.e., one of a possible number of structures) because fluorescein can form amide bonds with any of the amine groups in PEI.
As shown in Fig. 1b, gadolinium oxide nanoparticles were added to the above fluorescein-PEI solution. Here, it is known that the amine group can tightly bind to a nanoparticle.32–34 This can occur through donation of a pair of non-bonding electrons of a nitrogen atom to an empty orbital of a metal ion on a nanoparticle surface. Since there are many amine groups in a PEI, any of them can contribute to the bonding; the bonding structure shown in Fig. 1b is just one of possible ones. The reaction mixture was magnetically stirred for 16 h, the product solution was transferred into a 1 L beaker containing 500 mL of triply distilled water, and then washed with triply distilled water three times by using the same procedure used in washing the gadolinium oxide nanoparticles. Half the volume of the sample was converted to a powder by drying it in air and the remaining half was diluted with triply distilled water to prepare sample solutions for both MRI and CL experiments.
Characterization
A nuclear magnetic resonance (NMR) spectrometer (Bruker, AVANCE digital 400) was used to confirm the synthesis of fluorescein-PEI. After the reaction was complete, the solvent was removed under vacuum to dryness. The residue was washed by ethanol and then dissolved in D2O for measurement. A high resolution transmission electron microscope (HRTEM) (JEOL, JEM 2100F, 200 kV acceleration voltage) was used to measure the particle diameter (d) of fluorescein-PEI coated gadolinium oxide nanoparticles. A copper grid (PELCO No. 160, TED PELLA, INC.) covered with an amorphous carbon membrane was placed onto a filter paper and then, a surface coated nanoparticle solution diluted in triply distilled water was dropped over the copper grid by using a micropipette (Eppendorf, 2–20 μL). A dynamic light scattering (DLS) particle size analyzer (UPA-150, Microtrac) was used to measure the hydrodynamic diameter (a) of the surface coated nanoparticles dispersed in triply distilled water. To measure this, an aqueous 0.125 mM Gd sample solution was used. An X-ray diffraction (XRD) spectrometer (Philips, X'PERT PRO MRD) with unfiltered Cu-Kα radiation (λ = 1.54184 Å) was used to measure the crystal structure of fluorescein-PEI coated gadolinium oxide nanoparticles. The scanning step and the scan range in 2θ were 0.033° and 15–100°, respectively. An inductively coupled plasma atomic emission spectrometer (ICPAES) (Thermo Jarrell Ash Co., IRIS/AP) was used to measure the Gd concentration in a sample solution. A Fourier transform-infrared (FT-IR) absorption spectrometer (Mattson Instruments, Inc., Galaxy 7020A) was used to verify the surface coating of the nanoparticles. Before measuring a FT-IR absorption spectrum, a powder sample was dried on a hot plate at 50 °C in a hood for a week or so to minimize the water content. To record a FT-IR absorption spectrum (400–4000 cm−1) a pellet of a powder sample in KBr was prepared. A thermogravimetric analyzer (TGA) (TA Instruments, SDT-Q 600) was used to estimate the amount of surface coated fluorescein-PEI from the mass loss in the TGA curve. TGA curves of powder samples were recorded between room temperature and 900 °C under an air flow. A superconducting quantum interference device (SQUID) magnetometer (Quantum Design, MPMS-7) was used to measure the magnetic properties of fluorescein-PEI coated gadolinium oxide nanoparticles. Both magnetization (M) vs. applied field (H) (i.e., M–H) curves (−5 ≤ H ≤ 5 tesla) at temperatures (T) = 5 and 300 K and zero-field-cooled (ZFC) M–T curves (3 ≤ T ≤ 330 K) at H = 100 oersted (Oe) were recorded. In order to measure both M–H and M–T curves, a weighed powder sample was loaded into a non-magnetic gelatin capsule. A very small diamagnetic contribution from the capsule has a negligible contribution to the overall M, which is dominated by the sample. The observed M was mass-corrected by using both sample mass and weight percent of gadolinium oxide nanoparticles in the sample which was estimated from a TGA curve. A photoluminescence (PL) spectrometer (JASCO, FP-6500) was used to record PL spectra of both fluorescein-PEI coated gadolinium oxide nanoparticles and pure fluorescein dispersed in triply distilled water at a high resolution mode. The excitation wavelength (λex) was 470 nm. A quartz cuvette with four optically clear sides (Sigma-Aldrich, 3 mL) was filled with a sample solution for measurement.
Relaxivity measurement
A 1.5 tesla MRI instrument (GE 1.5 T Signa Advantage, GE medical system) equipped with the knee coil (EXTREM) was used to measure both longitudinal (T1) and transverse (T2) relaxation times. A series of aqueous sample solutions with different concentrations (0.25, 0.125, 0.0625 and 0 mM Gd) were prepared by diluting an original sample solution with triply distilled water. The longitudinal (r1) and transverse (r2) water proton relaxivities were then estimated from the slopes in the plots of 1/T1 (= R1) and 1/T2 (= R2) vs. Gd concentration, respectively. The typical measurement parameters are as follows: external MR field (H) = 1.5 tesla, temperature (T) = 22 °C, number of acquisitions (NEX) = 1, field of view (FOV) = 16 cm, phase FOV = 1, matrix size = 512 × 512, slice thickness = 5 mm, spacing gap = 0, pixel bandwidth = 61.0547, repetition time (TR) = 2009 ms, and time to echo (TE) = 9 ms.
In vitro cytotoxicity test
A CellTiter-Glo Luminescent Cell Viability Assay (Promega, WI, USA) was used to measure the cellular toxicity of an aqueous sample solution. In this assay, a luminometer (Victor 3, Perkin-Elmer) was used to quantify the intracellular ATP. Both human prostate cancer (DU145) and normal mouse hepatocyte (NCTC1469) cell lines were used as test cells. DMEM and RPMI1640 culture media were used for NCTC1469 and DU145 cells, respectively. Cells were seeded on a 24-well cell culture plate and incubated for 24 h (5 × 10⁴ cell density, 500 μL cells per well, 5% CO2, 37 °C). A series of test sample solutions (0, 5, 10, 25 and 50 μM) were prepared by diluting an original sample solution with a sterile phosphate buffer saline solution; ∼2 μL of each test sample solution was treated into the cell culture media. The treated cell culture media were then incubated for 48 h. Each cell viability was measured and normalized with respect to that of the control cell line with 0.0 M Gd concentration. The measurement was repeated twice for each test solution to obtain the average cell viabilities.
In vivo T
1 MR image measurement
A 3 tesla MRI instrument (SIEMENS 3.0 T MAGNETOM Trio a Tim) was used to take in vivo T1 MR images of a rat with a N1S1 liver tumor and with weight of ∼300 g. The rat was anesthetized by 1.5% isoflurane in oxygen. Measurements were made before and after injection of a sample solution into a rat tail vein. The injection dose was 0.1 mmol Gd kg−1. After measurement, the rat was revived from anesthesia and placed in a cage with a free access to both food and water. During measurement, the rat was maintained at ∼37 °C by using a warm water blanket. The typical imaging parameters for T1 3D fast SPGR (spoiled GRASS) images are as follows: H = 3 tesla, T = 37 °C, NEX = 3–4, FOV = 100 mm, phase FOV = 0.5, matrix size = 320 × 290, slice thickness = 1–2 mm, spacing gap = 0–0.5 mm, pixel bandwidth = 15.63, TR = 11 ms, and TE = 3.2 ms.
In vivo TEM analysis of accumulation of nanoparticles in a normal liver
For in vivo TEM analysis of nanoparticles accumulated in a normal liver, an aqueous sample solution was injected into a rat tail vein and then the liver was taken out from the rat 36 h after injection by anesthetizing and killing the rat by means of exsanguination from the vena cava. Ultra-thin sections of liver cells were obtained by using a LKB ultramicrotome (RMC, MT-X) and these were then doubly stained with both uranyl acetate and lead citrate solution. After these, the sections were imaged with a TEM (Hitachi, H-7600) at an acceleration voltage of 100 kV.
Fluorescent confocal cell image measurement
A confocal laser scanning microscope (Carl Zeiss, LSM 700) equipped with a solid-state laser was used to record fluorescent confocal images of DU145 cells treated with a sample solution. The λex and the laser power were 488 nm and ∼8 watts, respectively. The DU145 cells were seeded onto two 35 mm cell culture dishes at a density of 2.5 × 10⁵ with 2 mL volume per dish (5% CO2, 37 °C). After 24 h, one of the above two cell dishes was treated with ∼50 μL of an aqueous sample solution and incubated for 4 h. The treated cells were washed twice with sterile phosphate buffer saline solution. The untreated cells in the other dish served as control cells. The cells in both dishes were fixed with 4% PFA (paraformaldehyde) in sterile phosphate buffer saline solution for 10 min at room temperature. After this, the cells in both dishes were washed three times with a sterile phosphate buffer saline solution. The cell nuclei in both dishes were then stained with DAPI (4′,6-diamidino-2-phenylindole) for counterstaining and then, washed again three times with a sterile phosphate buffer saline solution. The cells were mounted by using Prolong Gold (Invitrogen, Carlsbad, CA, USA) for imaging.
Results and discussion
Particle diameter (d) and hydrodynamic diameter (a) of gadolinium oxide nanoparticles
HRTEM images of fluorescein-PEI coated gadolinium oxide nanoparticles are shown in Fig. 2a and b. The nanoparticles range from 2 to 6 nm. A log–normal function fit to the observed particle diameter distribution provides an davg of 3.92 nm (Fig. 2c). An average hydrodynamic diameter (aavg) was estimated to be 7.5 nm from a DLS pattern of fluorescein-PEI coated gadolinium oxide nanoparticles dispersed in triply distilled water (0.125 mM Gd) (Fig. 2d). We also measured XRD patterns of powder samples of both as-prepared and TGA analyzed fluorescein-PEI coated gadolinium oxide nanoparticles (ESI†). The lattice constant estimated from the (222) peak of a TGA analyzed powder sample is consistent with that reported in PCPDFWIN.35
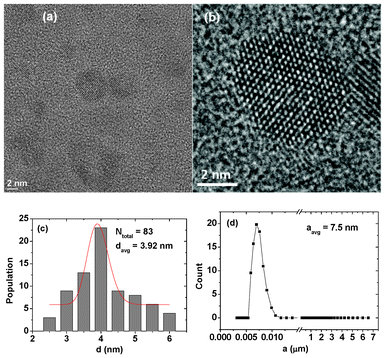 |
| | Fig. 2 (a) and (b) HRTEM images, (c) a log–normal function fit to the observed particle diameters, and (d) a DLS pattern of an aqueous solution of fluorescein-PEI coated gadolinium oxide nanoparticles. | |
Surface coating with fluorescein-PEI
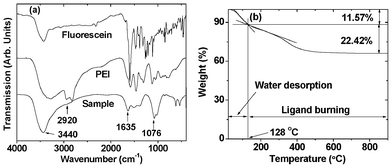
Gadolinium oxide nanoparticles were coated with fluorescein-PEI to make them water-soluble and biocompatible as well as to label them with fluorescein. In order to prove the successful synthesis of fluorescein-PEI, a 400 MHz NMR spectrum of fluorescein-PEI was taken. In addition to this, NMR spectra of fluorescein, PEI, and a physical mixture of all reactants (i.e., PEI, fluorescein, EDC, NHS and PBS solution) were also taken for comparison. These NMR spectra clearly confirmed the successful synthesis of fluorescein-PEI (ESI†). As mentioned before, any amine groups in a PEI can be conjugated to a nanoparticle.32–34 In order to confirm the presence of a surface coating, the FT-IR absorption spectrum of a powder sample of fluorescein-PEI coated gadolinium oxide nanoparticles was recorded. FT-IR spectra of both fluorescein and PEI were also taken as reference spectra (Fig. 3a). Here, water was completely removed from PEI by heating a 50% PEI aqueous solution at 70 °C for a week or so. From comparison of FT-IR absorption spectrum of the powder sample with those of both fluorescein and PEI, it is clear that gadolinium oxide nanoparticles are coated with fluorescein-PEI. Characteristic IR absorption frequencies at 3440 and 1635 cm−1 are assigned as N–H stretch and bend (or scissoring), respectively, that at 2920 cm−1 as C–H stretch, and that at 1076 cm−1 as C–N stretch.36–38 The broad peak at 3440 cm−1 is due to overlap with the OH stretch. The amount of surface coating was estimated to be 22.42 wt% from the TGA curve (Fig. 3b). An initial mass loss of 11.57% between room temperature and 128 °C is mainly due to water desorption while mass loss above 128 °C is mainly due to ligand combustion. Here, the boundary between water desorption and ligand burning was estimated by the crossing of the two slopes (Fig. 3b). From this, a grafting density39 was estimated to be 0.65 nm−2 by using davg of 3.92 nm from HRTEM images and bulk density of 7.407 g mL−140 of Gd2O3. This value shows a sufficient surface coating. In addition to the FT-IR absorption spectrum and TGA data, futher evidence for a surface coating was seen. These include a pale pink colored sample solution, a fluorescent sample solution after UV irradiation, and a photoluminescence (PL) spectrum, as will be discussed later.
Magnetic properties
The magnetic properties of fluorescein-PEI coated gadolinium oxide nanoparticles were characterized by recording both M–H curves (−5 ≤ H ≤ 5 tesla) at T = 5 and 300 K and ZFC M–T curves (5 ≤ T ≤ 330 K) at H = 100 Oe (Fig. 4). The net magnetization of gadolinium oxide nanoparticles was estimated by using the net mass of gadolinium oxide nanoparticles estimated from a TGA analysis. Both coercivity and remanence in M–H curves are zero (i.e. no hysteresis). This lack of hysteresis and no magnetic transition down to T = 5 K in the M–T curve show that gadolinium oxide nanoparticles are paramagnetic down to 5 K, which is consistent with a previous neutron beam experiment.41 From the M–H curves, saturation magnetizations of gadolinium oxide nanoparticles were estimated to be 177.78 and 6.63 emu g−1 at T = 5 and 300 K, respectively. These magnetizations are large even for inducing water proton relaxations even though gadolinium oxide nanoparticles are paramagnetic. This results from a large number of pure S-state 7 unpaired 4f-electrons of Gd(III) ion.
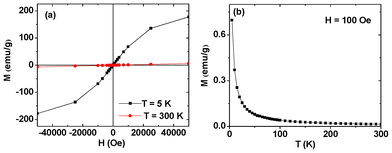 |
| | Fig. 4 Mass corrected (i.e., net) (a) M–H and (b) ZFC M–T curves of gadolinium oxide nanoparticles in fluorescein-PEI coated gadolinium oxide nanoparticles. | |
Relaxivities
The r1 and r2 were estimated to be 6.76 and 20.27 s−1 mM−1 from the slopes in the plots of 1/T1 and 1/T2 as a function of Gd concentration, respectively (Fig. 5). The measured relaxivities are also provided in Table 1, together with those of other chemicals. The value of r1 is ∼2 times larger than those4,5 of commercial Gd(III)-chelates. This is due to a high density of probing Gd(III) ions in the nanoparticles. Also Gd(III) ion has the largest spin magnetic moment (S = 7/2) among the elements in the periodic table45 and thus, can very efficiently induce the longitudinal relaxation of water protons.4,5 On the other hand, r2 is smaller than those of superparamagnetic iron oxide (SPIO) nanoparticles (Table 1). This is due to much smaller magnetizations of gadolinium oxide nanoparticles than those of iron oxide nanoparticles at room temperature because SPIO nanoparticles are easily saturated at relatively low applied fields at room temperature.43,44,46
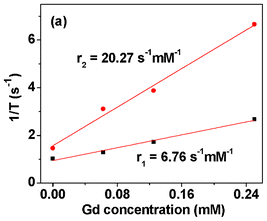 |
| | Fig. 5 Plot of 1/T1 and 1/T2 as a function of Gd concentration. The slopes correspond to r1 and r2, respectively. | |
Table 1 Water proton relaxivities (r1 and r2) of various chemicals
| Chemical |
Ligand |
d
avg/nm |
r
1/s−1 mM−1 |
r
2/s−1 mM−1 |
Applied field/tesla |
T/°C |
Ref. |
|
Diethylenetriaminepentaacetic acid.
|
| Gd(III)–H2O |
DTPAa |
— |
4.1 |
4.5 |
0.47 |
35 |
4
|
| Gd2O3 |
D-Glucuronic acid |
1.0 |
9.9 |
10.5 |
1.5 |
22 |
13
|
| Gd2O3 |
PEG-silane |
2.2 |
8.8 |
11.4 |
7 |
25 |
20
|
| MnO |
D-Glucuronic acid |
2.5 |
7.02 |
47.97 |
1.5 |
22 |
42
|
| Fe3O4/γ-Fe2O3 (Resovist) |
Carboxydextran |
4.2 |
19.4 |
185.8 |
0.47 |
37 |
43
|
| Fe3O4 (Feridex) |
Dextran |
4.96 |
23.7 |
107 |
0.47 |
37 |
44
|
| Gd2O3 |
Fluorescein-PEI |
3.92 |
6.76 |
20.27 |
1.5 |
22 |
This work |
Fluorescent properties
The fluorescent properties of fluorescein-PEI coated gadolinium oxide nanoparticles diluted in triply distilled water were characterized by recording a PL spectrum at the excitation wavelength (λex) of 470 nm (Fig. 6a). By comparison with a reference PL spectrum of a free fluorescein solution (Fig. 6a), a maximum emission of the sample solution at ∼527 nm can be assigned as due to fluorescein. A red shift by 15 nm from a free fluorescein was observed, which is likely due to conjugation of fluorescein to PEI. A fluorescent sample solution after irradiated with a mercury lamp with λex of 365 nm is shown in Fig. 6b, showing a fluorescence in the green region, which is due to absorption at ∼527 nm.
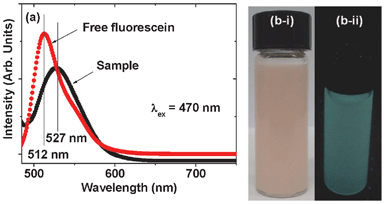 |
| | Fig. 6 (a) PL spectra of both aqueous solutions of fluorescein-PEI coated gadolinium oxide nanoparticles and free fluorescein and pictures of (b-1) an aqueous sample solution and (b-ii) a fluorescent aqueous sample solution after irradiation with a mercury lamp with λex of 365 nm. | |
In vitro cytotoxicity
Fluorescein-PEI coated gadolinium oxide nanoparticles should be non-toxic for in vivo applications. An in vitro cytotoxicity test was performed by using both NCTC1469 and DU145 cell lines with Gd concentrations up to 50 μM (Fig. 7), showing that PEI-fluorescein coated Gd2O3 nanoparticles are slightly toxic. PEI is known to be more or less toxic.47,48 The cytotoxicity slightly increased with increasing sample concentration, as consistent with this expectation. Finally, the cell viability at 50 μM Gd reached ∼65% for both cell lines due to this toxicity of PEI.
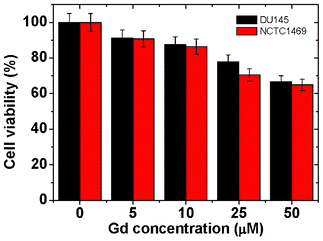 |
| | Fig. 7 Cytotoxicity results of an aqueous sample solution by using both NCTC1469 and DU145 cell lines with Gd concentrations up to 50 μM. | |
In vivo 3 tesla T1 MR images of a rat with a N1S1 liver tumor
To find out the effectiveness of fluorescein-PEI coated gadolinium oxide nanoparticles as a T1 MRI contrast agent in vivo, we took 3 tesla T1 MR images. 0.1 mmol Gd kg−1 of an aqueous sample solution was injected into a rat tail vein and a series of T1 MR images were recorded as a function of time. We observed a clear positive contrast enhancement in a N1S1 liver tumor after injection of the sample solution (Fig. 8). This clear contrast enhancement proves that fluorescein-PEI coated gadolinium oxide nanoparticles are functioning as a T1 MRI contrast agent. This liver tumor model perhaps suggests the possibility of early detection of tumors.
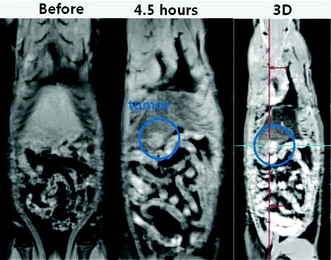 |
| | Fig. 8 3 tesla T1 spin echo MR images of a rat with a N1S1 liver tumor before and 4.5 h after injection of an aqueous sample solution of fluorescein-PEI coated gadolinium oxide nanoparticles into a rat tail vein. A three-dimensional (3D) flash (i.e., volume interpolated breathhold examination) T1 MR image also clearly indicates the location of the liver tumor through positive contrast enhancement. | |
The nanoparticles, which had no active targeting ligands on their surfaces, were not targeted to liver tumor. Instead, nanoparticles seem to be naturally more accumulated in liver tumor than in normal liver tissue. The accumulation of nanoparticles in cells can be generally accomplished by active phagocytosis action of the reticuloendothelial system (RES) cells.49,50 Therefore, the higher contrast enhancement in liver tumor than normal liver in MR images is likely due to this.
Accumulation of nanoparticles in a normal liver
Since a typical biodistribution study of nanoparticles for various organs in a rat needs time and is also expensive, we simply confirmed the accumulation of nanoparticles into a normal liver by taking in vivo TEM images. This will also confirm the contrast enhancement of the normal liver tissue as well as liver tumor. It is well-known that nanoparticles are uptaken by liver RES cells after intravenous injection.49,50 In order to see this, we took a TEM images of a normal liver 36 h after an aqueous sample solution was injected into a rat tail vein (Fig. 9). TEM images of vesicles in a liver RES cell clearly showed the internalization of nanoparticles into liver RES cells (Fig. 9). Some of vesicles are filled with nanoparticles whereas some of them are likely to be ruptured. In the latter case, some internalized nanoparticles as aggregates appeared to be released into the cytoplasm by ruptured trafficking vesicles (Fig. 9c).
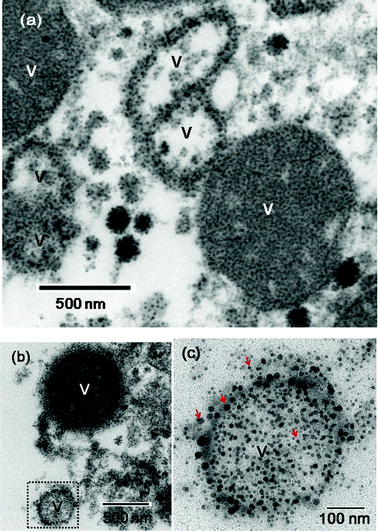 |
| | Fig. 9 TEM images of fluorescein-PEI coated gadolinium oxide nanoparticles in vesicles (labelled as V) of a liver RES cell. (a) and (b) Filled and likely ruptured vesicles are shown. A dotted square region in (b) is magnified in (c) in which nanoparticles (as examples, four nanoparticles are labelled with arrows) can be seen in a likely ruptured vesicle. Here, many of nanoparticles appear as aggregates. | |
In vitro fluorescent confocal images
In order to prove CL, fluorescent confocal images of DU145 cells were taken after incubating them with a sample solution. The violet tinted cell nuclei are due to counterstaining with DAPI. Strongly fluorescent confocal images in the green region were observed in the cells after irradiation with a solid-state laser with 488 nm and ∼8 watts (Fig. 10). This strong fluorescence is due to fluorescence from fluorescein-PEI coated gadolinium oxide nanoparticles internalized into DU145 cells. No fluorescence was, however, observed in control cells which were not treated with a sample solution.
 |
| | Fig. 10 Confocal images of DU145 cells: (a) and (b) control cells, (c) and (d) sample cells. Images (a) and (c) were obtained before and (b) and (d) after irradiation with a laser (λex = 488 nm and ∼8 watts). No fluorescence was observed in control cells (i.e., (b)) whereas a strong fluorescence in the green region was observed in sample cells (i.e., (d)). The cells were imaged at a magnification of 400. | |
Conclusion
In summary, fluorescein-PEI coated gadolinium oxide nanoparticles were synthesized and their MRI-CL dual functionality was studied both in vivo and in vitro. The core davg and aavg of fluorescein-PEI coated gadolinium oxide nanoparticles were estimated to be 3.92 and 7.5 nm, respectively. These nanoparticles showed r1 and r2 of 6.76 and 20.27 s−1 mM−1, respectively, and fluorescence at ∼527 nm (green region). The MRI functionality was demonstrated through a clear positive contrast enhancement in 3 tesla T1 MR images of a rat with a N1S1 liver tumor after intravenous injection of a sample solution into a rat tail vein while the CL functionality, through fluorescent confocal images of DU145 cells after incubation with a sample solution. These two results together clearly show the excellent T1 MRI-CL dual functionality of fluorescein-PEI coated gadolinium oxide nanoparticles.
Acknowledgements
This work was supported by Grant No. RTI04-01-01 from the Regional Technology Innovation Program of the Ministry of Commerce, Industry, and Energy funded by the Korean Government, Kyungpook National University Research Fund (2012), the Basic Science Research Program through the National Research Foundation funded by the Ministry of Education, Science, and Technology (2012R1A1B3004241 to K. S. C., 2011-0015353 to Y. C., and 2010-0002436 to G. H. L.), and the R&D program of MKE/KEIT (10040393, development and commercialization of molecular diagnostic technologies for lung cancer through clinical validation). We thank the Korea Basic Science Institute for allowing us to use their HRTEM and XRD spectrometer.
References
- M. Lewin, N. Carlesso, C. –H. Tung, X. –W. Tang, D. Cory, D. T. Scadden and R. Weissleder, Tat peptide-derivatized magnetic nanoparticles allow in vivo tracking and recovery of progenitor cells, Nat. Biotechnol., 2000, 18, 410–414 CrossRef CAS.
- F. Lux, A. Mignot, P. Mowat, C. Louis, S. Dufort, C. Bernhard, F. Denat, F. Boschetti, C. Brunet, R. Antoine, P. Dugourd, S. Laurent, L. V. Elst, R. Muller, L. Sancey, V. Josserand, J.–L. Coll, V. Stupar, E. Barbier, C. Rémy. A. Broisat, C. Ghezzi, G. L. Duc, S. Roux, P. Perriat and O. Tillement, Ultrasmall rigid particles as multimodal probes for medical applications, Angew. Chem., Int. Ed., 2011, 50, 12299–12303 CrossRef CAS.
-
R. H. Hashemi, W. G. Bradley and C. J. Lisanti, MRI The Basics, Lippincott Williams & Wilkins, New York, 2004 Search PubMed.
- R. B. Lauffer, Paramagnetic metal complexes as water proton relaxation agents for NMR imaging: theory and design, Chem. Rev., 1987, 87, 901–927 CrossRef CAS.
- P. Caravan, J. J. Ellison, T. J. McMurry and R. B. Lauffer, Gadolinium(III) chelates as MRI contrast agents: structure, dynamics, and applications, Chem. Rev., 1999, 99, 2293–2352 CrossRef CAS.
- C. F. G. C. Geraldes and S. Laurent, Classification and basic properties of contrast agents for magnetic resonance imaging, Contrast Media Mol. Imaging, 2009, 4, 1–23 CrossRef CAS.
- G. J. Strijkers, W. J. M. Mulder, G. A. F. van Tilborg and K. Nicolay, MRI contrast agents: current status and future perspectives, Anti-Cancer Agents Med. Chem., 2007, 7, 291–305 CrossRef CAS.
- J. D. Rocca and W. Lin, Nanoscale metal–organic frameworks: magnetic resonance imaging contrast agents and beyond, Eur. J. Inorg. Chem., 2010, 3725–3734 CrossRef.
- C. P. Constantin, A. Doaga, A. M. Cojocariu, I. Dumitru and O. F. Caltun, Improved contrast agents for magnetic nuclear resonance medical imaging, J. Adv. Res. Phys., 2011, 2(1), 011106 Search PubMed (4 pages).
- I. Coroiu, Al. Darabont and D. E. Demco, Potential contrast agents for magnetic resonance imaging, Appl. Magn. Reson., 1998, 15, 531–538 CrossRef CAS.
- J. Y. Park, E. S. Choi, M. J. Baek, G. H. Lee, S. Woo and Y. Chang, Water-soluble ultra small paramagnetic or superparamagnetic metal oxide nanoparticles for molecular MR imaging, Eur. J. Inorg. Chem., 2009, 2477–2481 CrossRef CAS.
- E. S. Choi, J. Y. Park, M. J. Baek, W. Xu, K. Kattel, J. H. Kim, J. J. Lee, Y. Chang, T. J. Kim, J. E. Bae, K. S. Chae, K. J. Suh and G. H. Lee, Water-soluble ultra-small manganese oxide surface doped gadolinium oxide (Gd2O3@MnO) nanoparticles for MRI contrast agent, Eur. J. Inorg. Chem., 2010, 4555–4560 CrossRef CAS.
- J. Y. Park, M. J. Baek, E. S. Choi, S. Woo, J. H. Kim, T. J. Kim, J. C. Jung, K. S. Chae, Y. Chang and G. H. Lee, Paramagnetic ultrasmall gadolinium oxide nanoparticles as advanced T1 MRI contrast agent: account for large longitudinal relaxivity, optimal particle diameter, and in vivo T1 MR images, ACS Nano, 2009, 3, 3663–3669 CrossRef CAS.
- M. Engström, A. Klasson, H. Pedersen, C. Vahlberg, P. –O. Käll and K. Uvdal, High proton relaxivity for gadolinium oxide nanoparticles, Mag. Reson. Mater. Phys. Biol. Med., 2006, 19, 180–186 Search PubMed.
- M.–A. Fortin, R. M. Petoral Jr, F. Söderlind, A. Klasson, M. Engström, T. Veres, P.–O. Käll and K. Uvdal, Polyethylene glycol-covered ultra-small Gd2O3 nanoparticles for positive contrast at 1.5 T magnetic resonance clinical scanning, Nanotechnology, 2007, 18, 395501 CrossRef (9 pages).
- R. M. Petoral Jr, F. Söderlind, A. Klasson, A. Suska, M. A. Fortin, N. Abrikossova, L. Selegård, P.–O. Käll, M. Engström and K. Uvdal, Synthesis and characterization of Tb3+-doped Gd2O3 nanocrystals: a bifunctional material with combined fluorescent labeling and MRI contrast agent properties, J. Phys. Chem. C, 2009, 113, 6913–6920 Search PubMed.
- M. Ahrén, L. Selegård, A. Klasson, F. Söderlind, N. Abrikossova, C. Skoglund, T. Bengtsson, M. Engström, P.–O. Käll and K. Uvdal, Synthesis and characterization of PEGylated Gd2O3 nanoparticles for MRI contrast enhancement, Langmuir, 2010, 26, 5753–5762 CrossRef.
- A.-A. Guay-Bégin, P. Chevallier, L. Faucher, S. Turgeon and M.-A. Fortin, Surface modification of gadolinium oxide thin films and nanoparticles using poly(ethylene glycol)-phosphate, Langmuir, 2012, 28(1), 774–782 CrossRef.
- N. J. J. Johnson, W. Oakden, G. J. Stanisz, R. S. Prosser and F. C. J. M. van Veggel, Size-tunable, ultrasmall NaGdF4 nanoparticles: insight into their T1 MRI contrast enhancement, Chem. Mater., 2011, 23, 3714–3722 CrossRef CAS.
- J. –L. Bridot, A.–C. Faure, S. Laurent, C. Rivière, C. Billotey, B. Hiba, M. Janier, V. Josserand, J.–L. Coll, L. V. Elst, R. Muller, S. Roux, P. Perriat and O. Tillement, Hybrid gadolinium oxide nanoparticles: multimodal contrast agents for in vivo imaging, J. Am. Chem. Soc., 2007, 129, 5076–5084 CrossRef CAS.
- J. Miyawaki, M. Yudasaka, H. Imai, H. Yorimitsu, H. Isobe, E. Nakamura and S. Iijima, Synthesis of ultrafine Gd2O3 nanoparticles inside single-wall carbon nanohorns, J. Phys. Chem. B, 2006, 110, 5179–5181 CrossRef CAS.
- H. Hifumi, S. Yamaoka, A. Tanimoto, D. Citterio and K. Suzuki, Gadolinium-based hybrid nanoparticles as a positive MR contrast agent, J. Am. Chem. Soc., 2006, 128, 15090–15091 CrossRef CAS.
- I. –F. Li, C.–H. Su, H.–S. Sheu, H.–C. Chiu, Y.–W. Lo, W.–T. Lin, J.–H. Chen and C.–S. Yeh, Gd2O(CO3)2.H2O particles and the corresponding Gd2O3: synthesis and applications of magnetic resonance contrast agents and template particles for hollow spheres and hybrid composites, Adv. Funct. Mater., 2008, 18, 766–776 CrossRef CAS.
- I.-F. Li and C.-S. Yeh, Synthesis of Gd doped CdSe nanoparticles for potential optical and MR imaging applications, J. Mater. Chem., 2010, 20, 2079–2081 RSC.
- F. Evanics, P. R. Diamente, F. C. J. M. van Veggel, G. J. Stanisz and R. S. Prosser, Water-soluble GdF3 and GdF3/LaF3 nanoparticles-physical characterization and NMR relaxation properties, Chem. Mater., 2006, 18, 2499–2505 CrossRef CAS.
- W. J. Rieter, K. M. L. Taylor, H. An, W. Lin and W. Lin, Nanoscale metal–organic frameworks as potential multimodal contrast enhancing agents, J. Am. Chem. Soc., 2006, 128, 9024–9025 CrossRef CAS.
- J. L. Kovar, M. A. Simpson, A. Schutz – Geschwender and D. M. Olive, A systematic approach to the development of fluorescent contrast agents for optical imaging of mouse cancer models, Anal. Biochem., 2007, 367, 1–12 CrossRef CAS.
- M. F. Kircher, U. Mahmood, R. S. King, R. Weissleder and L. Josephson, A multimodal nanoparticles for preoperative magnetic resonance imaging and intraoperative optical brain tumor delineation, Cancer Res., 2003, 63, 8122–8125 CAS.
- P. Kocbek, N. Obermajer, M. Cegnar, J. Kos and J. Kristl, Targeting cancer cells using PLGA nanoparticles surface modified with monoclonal antibody, J. Controlled Release, 2007, 120, 18–26 CrossRef CAS.
- H. S. Thomsen, Nephrogenic systemic fibrosis: a serious late adverse reaction to gadodiamide, Eur. Radiol., 2006, 16, 2619–2621 CrossRef.
- H. Cao and S.-Y. Xu, EDC/NHS-crosslinked type II collagen-chondroitin sulfate scaffold: characterization and in vitro evaluation, J. Mater. Sci.: Mater. Med., 2008, 19, 567–575 CrossRef CAS.
- B. Steitz, H. Hofmann, S. W. Kamau, P. O. Hassa, M. O. Hottiger, B. von Rechenberg, M. Hofmann-Amtenbrink and A. Petri-Fink, Characterization of PEI-coated superparamagnetic iron oxide nanoparticles for transfection: size distribution, colloidal properties and DNA interaction, J. Magn. Magn. Mater., 2007, 311, 300–305 CrossRef CAS.
- H. Duan, M. Kuang, X. Wang, Y. A. Wang, H. Mao and S. Nie, Reexamining the effects of particle size and surface chemistry on the magnetic properties of iron oxide nanocrystals: new insights into spin disorder and proton relaxivity, J. Phys. Chem. C, 2008, 112, 8127–8131 CAS.
- F. Yu, Y. Huang, A. J. Cole and V. C. Yang, The artificial peroxidase activity of magnetic iron oxide nanoparticles and its application to glucose detection, Biomaterials, 2009, 30, 4716–4722 CrossRef CAS.
- Card number 43–1014, PCPDFWIN, Version 1.30, 1997.
- X. Xu, J.-F. Zhang and Y. Fan, Fabrication of cross-linked polyethyleneimine microfibers by reactive electrospinning with in situ photo-cross-linking by UV radiation, Biomacromolecules, 2010, 11, 2283–2289 CrossRef CAS.
- I. Yudovin-Farber, N. Beyth, E. I. Weiss and A. J. Domb, Antibacterial effect of composite resins containing quaternary ammonium polyethyleneimine nanoparticles, J. Nanopart. Res., 2010, 12, 591–603 CrossRef CAS.
- C. Liu, P. Zhang, X. Zhai, F. Tian, W. Li, J. Yang, Y. Liu, H. Wang, W. Wang and W. Liu, Nano-carrier for gene delivery and bioimaging based on carbon dots with PEI-passivation enhanced fluorescence, Biomaterials, 2012, 33, 3604–3613 CrossRef CAS.
- M. K. Corbierre, N. S. Cameron and R. B. Lennox, Polymer-stabilized gold nanoparticles with high grafting densities, Langmuir, 2004, 20, 2867–2873 CrossRef CAS.
-
R. C. Weast, CRC Handbook of Chemistry and Physics, 65th edn, Boca Raton, CRC Press, Inc., 1984–1985. p. B-96 Search PubMed.
- R. M. Moon and W. C. Koehler, Magnetic properties of Gd2O3, Phys. Rev. B, 1975, 11, 1609–1622 CrossRef CAS.
- M. J. Baek, J. Y. Park, W. Xu, K. Kattel, H. G. Kim, E. J. Lee, A. K. Patel, J. J. Lee, Y. Chang, T. J. Kim, J. E. Bae, K. S. Chae and G. H. Lee, Water-soluble MnO nanocolloids for a molecular T1 MR imaging: a facile one-pot synthesis, in vivo T1 MR images, and account for relaxivities, ACS Appl. Mater. Interfaces, 2010, 2(10), 2949–2955 CAS.
- P. Reimer and T. Balzer, Ferucarbotran (Resovist): a new clinically approved RES-specific contrast agent for contrast-enhanced MRI of the liver: properties, clinical development, and applications, Eur. Radiol., 2003, 13, 1266–1276 Search PubMed.
- C. W. Jung and P. Jacobs, Physical and chemical properties of superparamagnetic iron oxide MR contrast agents: ferumoxides, ferumoxtran, ferumoxsil, Magn. Reson. Imaging, 1995, 13(5), 661–674 CrossRef CAS.
-
F. A. Cotton and G. Wilkinson, Advanced Inorganic Chemistry, 4th edn, A Wiley-Interscience Publication, New York, 1980, p. 984 Search PubMed.
- J. Lodhia, G. Mandarano, N. J. Ferris, P. Eu and S. F. Cowell, Development and use of iron oxide nanoparticles (Part 1): synthesis of iron oxide nanoparticles for MRI, Biomed. Imaging Interv. J., 2010, 6(2), e12 CrossRef CAS (11 pages).
- A. C. Hunter, Molecular hurdles in polyfectin design and mechanistic background to polycation induced cytotoxicity, Adv. Drug Delivery Rev., 2006, 58, 1523–1531 CrossRef CAS.
- M. Breunig, U. Lungwitz, R. Liebl and A. Goepferich, Breaking up the correlation between efficacy and toxicity for nonviral gene delivery, Proc. Natl. Acad. Sci. U. S. A., 2007, 104, 14454–14459 CrossRef CAS.
- B. E. V. Beers, C. Sempoux, R. Materne, M. Delos and A. M. Smith, Biodistribution of ultrasmall iron oxide particles in the rat liver, J. Magn. Reson. Imaging, 2001, 13, 594–599 CrossRef.
- R. Weissleder, G. Elizondo, J. Wittenberg, C. A. Rabito, H. H. Bengele and L. Josephson, Ultrasmall superparamagnetic iron oxide: characterization of a new class of contrast agents for MR imaging, Radiology, 1990, 175, 489–493 CAS.
Footnote |
| † Electronic supplementary information (ESI) available: XRD patterns of both as-prepared and TGA analyzed powder samples of fluorescein-PEI coated gadolinium oxide nanoparticles, a HRTEM image of the TGA analyzed powder sample, and NMR spectra. See DOI: 10.1039/c2ra21052e |
|
| This journal is © The Royal Society of Chemistry 2012 |
Click here to see how this site uses Cookies. View our privacy policy here. 

