Stability of mesoporous silica under acidic conditions†
Sabah
El Mourabit
a,
Marie
Guillot
ab,
Guillaume
Toquer
a,
Julien
Cambedouzou
a,
Frédéric
Goettmann
b and
Agnès
Grandjean
*a
aInstitut de Chimie Séparative de Marcoule, ICSM, UMR5257 CEA-CNRS-UM2-ENSCM, 30207 Bagnols sur Cèze, France. E-mail: agnes.grandjean@cea.fr; Fax: +33 4 6679 7611; Tel: +33 4 6679 6622
bCEA/DEN/DTCD/SPDE/Laboratoire de Chimie des Fluides Complexes et Irradiation, BP17171, Bagnols sur Cèze, France
First published on 6th September 2012
Abstract
The stability of various structured mesoporous materials (SBA-1, SBA-3, SBA-15, MCM-41, MCM-48) was tested under acidic stress in order to understand the mechanism of their alteration. The native materials and the materials resulting from acidic attack under various conditions were analysed by small angle X-ray scattering coupled with nitrogen adsorption and solid 29Si NMR. Among three acid media (HCl, H2SO4, H3PO4) at similar ionic strength, we focused particularly on phosphoric acid, which proved to have the strongest impact on the starting materials. The results are discussed by correlating the wall thickness and pore diameter values with regard to stability. In particular, the alteration kinetics were interpreted for the case of SBA-15 in the following scenario: the micropores were first damaged by the acidic stress, and then the mesopores were partially collapsed or partially blocked. We show that a material's resistance against acidic media is linked to a critical wall thickness–pore diameter threshold.
1. Introduction
Ordered mesoporous silicas, which are already widely using in applications such as catalysis,1–5 sensing,6,7 drug delivery 8–10 and optics,11,12 are also promising materials for applications in the field of ion separation, environmental remediation,13 metallurgical purposes14,15 or even nuclear science.16 Thus far, numerous (hybrid) mesoporous solids have been investigated as solid ligands, particularly for extracting heavy metal cations from waste fluxes.17–21The synthesis of ordered mesostructures can be effectively achieved by two main pathways: the cooperative self-assembly and “true” liquid-crystal template processes.22 These processes are based on the interactions between organic templates (surfactant micelles or liquid crystal structures) and inorganic precursors, such as silica, that form stable mesostructured composites.23 The thermal or chemical removal of templates yields ordered mesoporous materials that are characterised by a narrow and most often organised pore structures. The obtained porous solids feature a very high surface area, which is the origin of the interest in them for the aforementioned applications. Unfortunately, these solids are metastable and their porosity can collapse under external stresses.24–26
Most such solids are based on silica which is known to be soluble in basic media. Therefore, the use of mesoporous silica is restricted to organic solvents or neutral and slightly acidic aqueous media. However, in the fields of ion separation (be it for environmental remediation or hydrometallurgical ore processing) the fluxes to be treated are often acidic or even very acidic. The applicability of mesoporous solids in these fields relies heavily upon their chemical and mechanical stability in such aggressive media. Consequently, it is necessary to carry out stability studies of these materials under conditions similar to the ones in which they are going to be employed. To the best of our knowledge, little stability data have been reported27–30 and alteration mechanisms in these materials still remain unclear.
To determine the behaviour of mesoporous silicas in different kinds of acids, the stability of mesoporous silicas, synthesised under varying reaction conditions (i.e., the pH of the synthesis, the employed surfactant, the presence of catalysts, etc) and thus featuring different morphologies (cubic, hexagonal, etc), were tested under strongly acidic conditions. From these experimental data, new insights into the alteration mechanisms of mesoporous silica are provided.
2. Experimental section
2.1. Materials
All products were purchased from Sigma-Aldrich and used without further purification.2.2. Synthesis of mesoporous silicas
Different types of mesoporous silicas were synthesised by a sol–gel process according to established procedures. SBA-1 type silica was produced following Kim et al.,31 SBA-3 was produced following Anunziata et al.,32 SBA-15 was produced following Zhao et al.,33 MCM-41 was produced following Kumar et al.,34 and MCM-48 was produced following Xu et al.35Detailed synthesis procedures can be found in the ESI.†Table 1 summarises the synthesis conditions of the different mesoporous silicas.
| Silicas | SBA-3 | SBA-15 | MCM-41 | SBA-1 | MCM-48 |
|---|---|---|---|---|---|
| a Hex : hexagonal; Cub : cubic. | |||||
| Space groupa | P6mm (Hex) | P6mm (Hex) | P6mm (Hex) | Pm3n (Cub) | Ia3d (Cub) |
| H2O (mL) | 100 | 262 | 120 | 42.8 | — |
| HCl (mL) | 40 | 50 | — | 18.2 | — |
| NaOH (2 M) (mL) | — | — | — | — | 10 |
| NH4OH (mL) | — | — | 8 | — | — |
| Silica source TEOS (mL) | 10 | 22.5 | 10 | — | 10 |
| CTEAB | — | — | — | 1.2 g | — |
| CTAB | 2 g | — | 2.4 g | — | 88 g in water 10% wt. |
| P123 | — | 10 g | — | — | |
| Soxhlet extraction | EtOH (8 h) | — | — | — | — |
| Calcination | 550 °C | 550 °C | 550 °C | 450 °C | 550 °C |
| 8 h (air) | 5 h (air) | 3 h (air) | 4 h (air) | 2 h N2 + 5 h O2 | |
2.3. Characterisation
The porous texture was determined via nitrogen adsorption–desorption at the boiling temperature (77 K) using an ASAP 2020 instrument from Micromeritics. Prior to recording the measurements, the samples were evacuated at 350 °C for 4 h.Nitrogen adsorption allows the determination of many important parameters:36 (i) the specific surface areas obtained by applying the Brunauer–Emmet–Teller (BET) method 37 which gives the total surface available to nitrogen molecules, including microporous surface; (ii) the microporous surface calculated using the t-plot method, then by subtracting the BET surface to this microporous surface, the external surface can be evaluated; and (iii) the average pore size estimated by the Barret–Joyner and Halenda (BJH) formulae.38 More accurate methods are available such as those based on non local density functional theory (NLDFT).39 NLDFT method is very accurate in the case of cynlindrical structures but requires the use of complex analytical equations and needs an adaptation for cubic structures. Here, we assume that the underestimation of the mean pore size done by the BJH method is around the same for all porous silica studied. In materials with 2–4 nm, the BJH method underestimates the pore size by ca. 1 nm.40 The average size of the wall thickness is then calculated according to the equations given in the ESI,† from the geometrical description of the porous structure. With the previous hypothesis, in the case of a hexagonal structure, the wall thickness is then size underestimated by about 1 nm and for a cubic structure of about 0.5 nm.
Small angle X-ray scattering (SAXS) was used to determine the material microstructure. The SAXS experiments were conducted using a Guinier-Mering setup with a 2D image plate detector. The X-ray source was a molybdenum anode that delivered a high-energy monochromatic beam (λ = 0.71 Å, E = 17.4 keV), providing structural information over scattering vectors q ranging from 0.02 to 1.5 Å−1. The sample acquisition time was 3600 s. Data correction and radial averaging were performed according to standard procedures. The SAXS results allow the determination of (i) the inter-reticular distance and of (ii) the wall thickness by also using the total pore volume obtained from the nitrogen adsorption experiment.41 Additional X-ray scattering experiments (XRS) were performed on a Bruker D8 diffractometer operating in the Bragg-Brentano geometry and using a lower-energy monochromatic beam (λ = 1.54 Å, E = 8 keV). The degree of condensation of the silica wall thickness was characterised using cross-polarisation magic angle spinning (CP-MAS) solid-state 29Si NMR. Spectra were recorded on a Varian 300 MHz spectrometer, equipped with a 7.5 mm probe. The spin rate was 5 kHz and the contact time was 5 s.
2.4. Material resistance tests in acidic conditions
All of the experiments were carried out by contacting 500 mg of silica (powder) with 15 mL of concentrated acid solution. The mixture was stirred mechanically to disperse the powder in the solution at room temperature. After each acidic treatment, the solution was filtered and the powder was washed with ultra-pure water before characterisation via nitrogen adsorption, SAXS experiments and solid state 29Si CP-MAS NMR.First, SBA-3 and SBA-15 were chosen for study in different acidic media to determine which acid had the most effect on the silica structure. Then, a kinetic study was conducted on SBA-15 with the most efficient “destructive” acid. Four experiments were performed with different periods: 24 h, 48 h, 72 h and 96 h.
Finally, all of the different mesoporous silicas reported on Table 1 were compared in this acidic solution to correlate the mesoporous silicas properties (synthesis medium and mesoporous structure) to the acid effect.
3. Results and discussion
3.1. Properties of the synthesised silicas
As previously stated, we wanted to correlate the impact of various acids on given mesoporous silica to their structure and also to their synthesis method.Numerous synthesis parameters can be varied, and we selected the most straightforward ones: the pH of the synthesis medium (acidic for the SBA and basic for the MCM family, see Table 1), and the nature and concentration of the surfactants (cationic or non-ionic ones), which result in different pore structures and sizes as well as various wall thicknesses.41
As expected, the mesoporous solids obtained after the usual synthesis, consolidation and surfactant removal featured the typical properties of their material families. Table 2 summarises the most useful data for each solid.
| S BET (m2 g−1) | S ext (m2 g−1) | S μ (m2 g−1) | D p (nm) | t wall (nm) | DP (%) | |
|---|---|---|---|---|---|---|
| a S BET, the specific surface areas obtained by the BET method to the lower part of the isotherm; Sext and Sμp, respectively, the external surface and the microporous surface obtained using the t-plot method; Dp, the pore diameter calculated by means of the BJH method from the adsorption branch of the isotherm; twall, the wall thickness calculated from SAXS and using the formulae described in ESI;† DP. (%) the degree of condensation calculated from 29Si NMR spectra. | ||||||
| SBA-15 | 780 | 560 | 230 | 6.9 | 4.9 | 92 |
| SBA-3 | 1390 | 40 | 1350 | 2.2 | 1.4 | 91 |
| MCM-41 | 1460 | 1440 | 20 | 2.9 | 1.5 | 94 |
| SBA-1 | 950 | 40 | 910 | 2.1 | 8.6 | 93 |
| MCM-48 | 690 | 440 | 250 | 2.5 | 1.4 | 93 |
Two types of mesopore geometries were studied: 2D hexagonal and 3D cubic.
SBA-15, SBA-3 and MCM-41 have cylindrical mesopores with a 2D-hexagonal arrangement. SBA-15 features mesopores (6.9 nm pore diameter) that are interconnected by microporous channels (inside the walls), whereas SBA-3 and MCM-41 have non-connected porosities (2.2 nm and 2.9 nm pore diameter respectively). As is known, SBA-15 has thicker walls with larger pores compared to SBA-3 and MCM-41 (see Table 2).
Concerning cubic silicas, SBA-1 and MCM-48 both have small pores diameters of 2.1 and 2.5 nm, respectively. However, their wall thicknesses are quite different: 8.6 nm for SBA-1 and 1.4 nm for MCM-48. It is worth noting here that, due to the thermal treatment employed to remove the organic templates, the degrees of condensation of our materials are very similar (90%) regardless of the pH of synthesis.
3.2. Stability of SBA-3 and SBA-15 silicas in different acid media
For the first series of test, we aimed at testing the impact of various acids. The silicas were thus mixed, under magnetic stirring, with the required acids for 24 h at room temperature. Three common acids were selected for these experiments: a monoacid HCl, a diacid H2SO4 and a triacid H3PO4. The normality of solutions was fixed at 6 N.Two types of 2D-hexagonal silicas were tested, namely SBA-3 and SBA-15. Fig. 1 displays the SAXS and XRS spectra corresponding to SBA-silicas before and after acid attack.
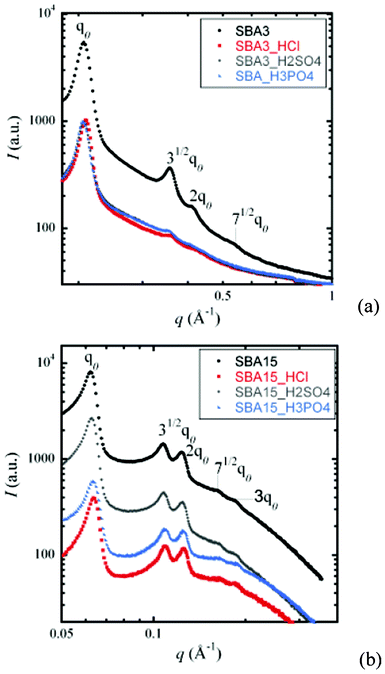 | ||
| Fig. 1 (a) SAXS spectra of SBA-3 and (b) X-ray scattering spectra of SBA-15 before and after acid attack (for 24 h). | ||
In every instance, three well-defined pseudo-Bragg peaks are observed, which are characteristic of a 2D-hexagonal arrangement (P6mm symmetry group).32 These results show that the mesoporous arrangement is preserved even after the different acid attacks (HCl, H2SO4, H3PO4). However, for the SBA-3 sample, the indexed peaks (31/2qo) and (2qo) tend to disappear. Furthermore, a decrease in the intensity is observed after the different acid attacks, suggesting either partial pore collapse or partial pore obstruction phenomena resulting from a contrast in lower electronic density.
The results obtained from nitrogen adsorption and X-ray scattering are summarised in Table 3.
| S BET (m2 g−1) | V p (cm3 g−1) | D p (nm) | d 100 (nm) | a (nm) | t wall (nm) | DP (%) | |
|---|---|---|---|---|---|---|---|
| a S BET, the specific surface areas obtained by applying the BET method to the lower part of the isotherm; Vp, the mesoporous volumes estimated by BJH formulae; d100, the inter-reticular distance calculated by the formulae of a two-dimensional hexagonal phase from SAXS spectra; a, the unit cell parameter calculated by SAXS data a = (2d100)/√3); Dp, the pore diameter calculated by means of the BJH method from the adsorption branch of the isotherm; twall, the wall thickness calculated from twall = a − Dp. Degree of polycondensation (DP) calculated from 29Si NMR spectra. | |||||||
| SBA3 | 1390 | 0.691 | 2.2 | 3.1 | 3.6 | 1.4 | 91 |
| SBA3-HCl | 900 | 0.386 | 2.2 | 3.1 | 3.6 | 1.4 | 89 |
| SBA3-H2SO4 | 1090 | 0.176 | 2.4 | 3.0 | 3.5 | 1.1 | 82 |
| SBA3-H3PO4 | 670 | 0.104 | 2.4 | 3.0 | 3.4 | 1.0 | 89 |
| SBA15 | 780 | 1.070 | 6.9 | 10.1 | 11.6 | 4.9 | 92 |
| SBA15-HCl | 630 | 0.807 | 7.0 | 9.9 | 11.4 | 4.4 | 92 |
| SBA15-H2SO4 | 680 | 0.875 | 7.0 | 10.0 | 11.6 | 4.6 | 94 |
| SBA15-H3PO4 | 600 | 0.746 | 6.8 | 9.9 | 11.4 | 4.6 | 92 |
The corresponding N2 sorption isotherms are displayed in the ESI.† For both silicas, the acidic attack reduced the specific surface area regardless of the acid. The surface losses for SBA-15 and SBA-3 samples were on average −20% and −60%, respectively. The porous volume also followed this trend, whereas the pore diameter and the degree of condensation did not vary significantly after the different acid attacks. SBA-15 seemed to be less affected than SBA-3. The difference in wall thickness is the most obvious cause of this observation. Indeed, the SBA-15 walls are almost five times thicker than those of SBA-3, resulting in strengthening of the structure, as reported by A. Davidson.43
As mentioned in the introduction, it is well known that silica is not stable under basic conditions. On the contrary, it is widely believed that silica, and even mesoporous silica, is relatively stable under acidic conditions.
The results displayed in Table 3 demonstrate that (strongly) acidic media influence the typical properties of mesoporous silicas. The fact that the nature of the acid also plays a role is even more surprising. Indeed, for both SBA-3 and SBA-15, the loss in, for example, the BET specific surface area was significantly higher for phosphoric acid and significantly lower for sulphuric acid, as observed in Fig. 2.
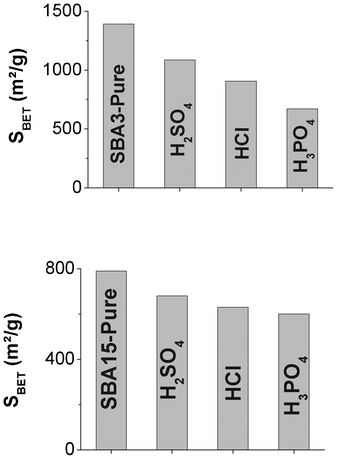 | ||
| Fig. 2 Evolution of specific surface area for (A) SBA-3 and (B) SBA-15 in different acids for 24 h. | ||
This result implies that protons are playing a role not only in the acidic alteration process of silica but also in the conjugated base. To shed some light on this phenomenon, it is useful to remember which role catalysts can play in sol–gel processes. Indeed, Brinker et al.,44 on the one hand, and Corriu et al.,42 on the other hand, have previously reported the possibility of accelerating sol–gel reactions (Fig. 3a) using catalysts. Typical nucleophilic catalysts, such as fluorides (as in the case of MSU synthesis45) or amines46,47 can be employed for this reaction.
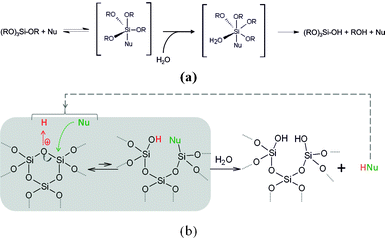 | ||
| Fig. 3 (a) Hydrolysis by nucleophilic activation (scheme inspired by Corriu et al.42) and (b) hydrolysis and condensation reversible mechanism involving nucleophilic species. | ||
Fig. 3a shows how the catalysis proceeds in the case of tetraalcoxysilane hydrolysis. Nucleophilic catalysis also impacts the condensation and permits better polycondensation of silica.48–50 Condensation is a reversible phenomenon (see Fig. 3b), and, as always in catalysis, what hastens the forth reaction also hastens the back reaction. Thus it is not such a surprise that the silica stability is impacted by the nature of the acid. A typical example of this phenomenon is the fact that hydrofluoric acid, which is a weak acid, is able to completely dissolve silica.
In our case, the corresponding anions (SO42−, Cl− and PO43−) might act as nucleophilic catalysts to different degrees. In actuality, while phosphine oxides (featuring electronic properties close to those of phosphates)51 and chloride anions52,53 have already been described as able to act as nucleophilic catalysts (in organic reactions), to the best of our knowledge, nothing has been reported regarded sulfates as Lewis basic catalysts. This notion fits well with our own observations.
As phosphoric acid appears to be the most active acid in both cases, the next set of experiments was carried out in this medium.
3.3. Understanding the mechanisms of SBA-15 in H3PO4 solution
Surfactant elimination during the synthesis of SBA-15 results in the creation of mesoporosity in addition to some microporosity within the walls. This interconnected pore morphology can influence the stability of the material under acidic conditions. To understand the mechanism of the silica degradation, a kinetic study was carried out. The SBA-15 samples from the same batch were placed in contact with concentrated phosphoric acid (5 M) at room temperature, under stirring. Four experiments were performed with different durations: 24 h, 48 h, 72 h and 96 h.The nitrogen adsorption–desorption isotherms for SBA-15 (Fig. 4a) before and after each acid attack feature hysteresis loops (type H1) in the mesopore range for all contact time, thus demonstrating the existence of open-ended mesopores with narrow pore size distributions. This nitrogen adsorption curve is characteristic of SBA-15 mesoporous matrices.33 This result indicates that the initial structure is most probably conserved throughout the acidic treatment.
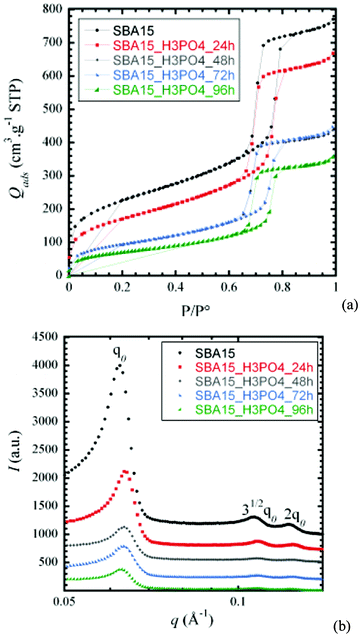 | ||
| Fig. 4 (a) N2 sorption isotherms and (b) XRS spectra for SBA-15 before and after contact with phosphoric acid (0 h, 24 h, 48 h, 72 h, 96 h). | ||
The SAXS spectra of SBA-15 (Fig. 4b) show three typical well-resolved peaks corresponding to P6mm hexagonal symmetry. Concerning the unit cell parameter a calculated from the inter-reticular distance at q0, there is no noticeable variation before and after acid attack. This structure remains globally stable after phosphoric acid attack. Nevertheless, a progressive decrease of intensity and a smoothing of the pseudo-Bragg peaks are observed.
The main textural and structural features derived from the results from N2 adsorption-isotherm results and XRS data (or SAXS) are summarised in Table 4. The BET surface area, porous volume and wall thickness decrease as the contact time with phosphoric acid increases. On the contrary, the pore diameter (Dp) increases (approximately 7 nm in the initial stages up to 8 nm after 96 h).
| S BET (m2 g−1) | S ext (m2 g−1) | S μp (m2 g−1) | V p (cm3 g−1) | D p (nm) | a (nm) | t wall (nm) | DP (%) | |
|---|---|---|---|---|---|---|---|---|
| a S BET, the specific surface areas obtained by applying BET method to the lower part of the isotherm. Sext and Sμp, the external surface and the microporous surface obtained using t-plot method, respectively; Vp, the mesoporous volumes estimated by BJH formulae; a, the unit cell parameter calculated by SAXS data a = (2d100)/√3); Dp, the pore diameter calculated by means of the BJH method from the adsorption branch of the isotherm; twall, the wall thickness calculated from twall = a − Dp; and DP (%) the degree of condensation calculated from 29Si NMR spectra. | ||||||||
| SBA15–0 h | 780 | 564 | 229 | 1.070 | 6.9 | 11.6 | 4.9 | 92 |
| SBA15–24 h | 610 | 520 | 87 | 0.960 | 7.0 | 11.3 | 4.3 | 92 |
| SBA15–48 h | 340 | 338 | 6 | 0.646 | 7.6 | 11.3 | 3.8 | 92 |
| SBA15–72 h | 340 | 327 | 14 | 0.661 | 7.5 | 11.3 | 3.8 | 96 |
| SBA15–96 h | 260 | 245 | 14 | 0.527 | 8.1 | 11.4 | 3.3 | 98 |
The external surface, calculated by the t-plot model, which corresponds to the mesoporous surface and the surface of grains, decreases very slightly (−8%) from 0 to 24 h whereas the microporous surface decreases drastically (−60%) after the same treatment time. After 48 h, the microporous surface is now negligible and the external surface begins to decrease significantly. These results indicate that micropores are the first to be impacted by the acidic attack. This finding is consistent with previous reports that state that phosphates can interact with surface silanols and thus obstruct the microporosity.28 In a second step, both the mesoporous volume and the peak intensity in the scattering spectra decrease sensibly, which demonstrates that the mesopores start getting attacked when the micropores are completely closed.
In summary, the data calculated from the BET model show a progressive elimination of the microporosity, which indicates that the micropores inside the SBA-15 walls are collapsed or partially blocked (e.g. closed at the ends). Here, the SAXS spectra (for 24 h upon acid exposure) do not allow us to discriminate between these two hypotheses.
After 48 h of acid exposure, no microporosity remains, and the mesoporosity starts to be affected, as we can notice from the nitrogen adsorption data. Two successive mechanisms might be activated: first, the disappearance of microporosity, and second, an alteration of mesoporosity.
The degree of condensation is stable after short periods and begins to increase after 48 h of acid exposure, from 92 to 98%. These results suggest a densification of silica that can be explained by the removal of microporosity that was observed previously from nitrogen adsorption measurements.
3.4. Stability of several mesoporous silicas in phosphoric acid
Considering the aforementioned background, we investigated how different synthesis parameters and different silica structures influence the stability of mesoporous silica against acidic attack. Therefore, the mesoporous silicas reported previously were mixed with concentrated phosphoric acid (5 M) under stirring for 24 h at room temperature. The evolution of the structure was tracked using nitrogen adsorption, SAXS and 29Si CP-MAS NMR. Then, a comparison between these mesoporous silicas allowed us to propose a general mechanism of phosphoric acid attack on these samples.Fig. 5 displays the surface area losses of the different silicas before and after contact with phosphoric acid for 24 h. These results show that all our mesoporous silicas were altered within 24 h under acidic conditions. However, the extent of specific surface loss is very different from one silica type to another. The main differences between these silica samples are the porous network geometry (hexagonal or cubic), the porous structure (pore size and wall thickness) and the synthesis medium (acidic or basic). All of these data before phosphoric acid are reported in Table 2, and the data after treatment are reported in the ESI.† These nitrogen adsorption isotherm results obtained after phosphoric acid attack, coupling with the SAXS experiments were correlated to the physico-chemical properties of these mesoporous silica.
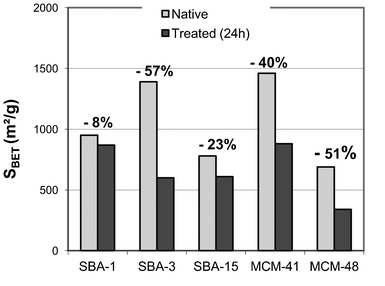 | ||
| Fig. 5 Evolution of specific surface area of the different silicas before and after phosphoric acid attack. | ||
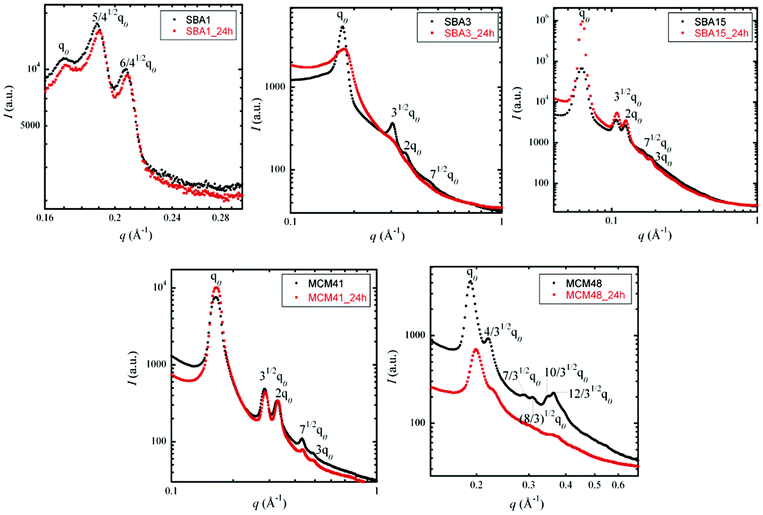 | ||
| Fig. 6 SAXS spectra of SBA-1, SBA-3, SBA-15, MCM-41 and MCM-48 before (black dots) and after (red dots) acid exposure. | ||
As observed from these SAXS spectra, none of the structures completely collapsed during the acidic treatment, even when high specific surface losses were recorded. MCM-41 for example lost up to 40% of its surface but no significant change in the intensity was observed in the spectrum. Likewise, in the other samples, no obvious correlations between the intensity and surface losses were clearly detectable. These results led us to the assumption that, in addition to the collapse of the microporosity, the decrease in mesoporous volume might originate from pore closure rather than from pore collapse, i.e. the opening of the collapsed pores first transforms the open porosity (which is visible both by nitrogen adsorption and SAXS) into closed porosity (which can only be detected by SAXS).
Effect of the synthesis medium (acidic or basic). Neither of the silicas synthesised under basic conditions, MCM-41 and MCM-48, resist upon acid exposure. Concerning the silicas synthesised under acidic conditions, there are two trends: a group that is resistant and another that collapses.
SBA-15 and SBA-3 were both synthesised in acidic media. After 24 h of phosphoric acid exposure, a structure alteration is observed for SBA-3, followed by a loss of BET specific surface of approximately 60%. Whereas SBA-15 seems to be unaffected by this acid exposure with a loss of BET specific surface of approximately 23% and quite the same intensity level of the order of magnitude of SAXS results before and after treatment. This comparison between SBA-3 and SBA-15 clearly shows that the synthesis medium of the silica samples cannot be explained easily or solely by invoking the effect of the phosphoric attack on these mesoporous silicas. Moreover, due to calcination treatment of all the mesoporous silicas studied, the degree of silica condensation before attack is high in all cases, even if the syntheses were performed under basic conditions. Moreover, after phosphoric acid attack, this degree of condensation does not vary significantly.
Effect of the porous network geometry (hexagonal or cubic). SBA-1 and MCM-48 both display a cubic structure with typical indexed peaks corresponding to Pm3n symmetry and Ia3d symmetry, respectively. The damage under phosphoric acid stress is very different: SBA-1 seems not to be affected by acid exposure with a BET specific surface area loss of only 8% and the same level of magnitude of SAXS intensity before and after acid exposure. In comparison, MCM-48 is strongly affected by this acidic treatment with a loss of BET specific surface of approximately 51%. Moreover, the initial MCM-48 SAXS data show five peaks characteristic of a three-dimensional pore system (Ia3d symmetry). After acid exposure, MCM-48 exhibits only three peaks implying the initiation of microstructure alteration.
Moreover, MCM-41, SBA-3 and SBA-15 all display the same hexagonal P6m symmetry: interconnections between the mesopores due to the micropores in the silica wall are observed in the case of SBA-15, and a lack of interconnections between the mesopores in the case of SBA-3 is observed. However, once again, the damage under phosphoric acid stress is very different among these hexagonal samples. On the one hand, both MCM-41 and SBA-3 show a great loss of surface area (40 and 57%, respectively). On the other hand, MCM-41 seems to conserve its microstructure contrary to SBA-3 according to the SAXS data. On the contrary, SBA-15 conserves its microstructure and its loss of surface area is low.
We thus can conclude that there is no obvious influence of the porous network on the resistance of our silicas to phosphoric acid.
Effect of the porous structure (pore size and wall thickness). One last difference between all these samples comes from the porous structure and more particularly, from the coupling of pore size and silica wall thickness.
After 24 h of acid exposure, the mesoporous silica samples that exhibit the lowest in the BET specific surface areas are SBA-15 and SBA-1, with a loss of 23 and 8% respectively. As shown in the SAXS spectra, both of these samples conserve their mesoporous structure after acidic treatment, indicating a minimal effect of phosphoric acid on these samples. Interestingly, both the pore diameters and structures of these mesoporous silicas are still quite different. These two samples have the greatest wall thickness among all of the samples: 8.6 and 4.9 nm for SBA-1 and SBA-15, respectively. Their large wall thickness might account for their resistance to phosphoric acid.
These silicas have the smallest pore diameters: 2.5 and 2.2 nm, respectively for MCM-48 and SBA-3. They also have a small wall thickness of 1.4 nm. We argue that the weak resistance to phosphoric acid of these samples might come from this combination of small pore diameter and small wall thickness.
MCM-41 exhibits an intermediate loss in surface area, thought its structure seems to resist acid exposure, as shown in the SAXS spectra (Fig. 6). This effect might be due to its pore diameter and wall thickness slightly larger than those of SBA-3 and MCM-48. MCM-41 seems to be the threshold of acidic stress resistance between the two latter series. In this case, the decrease in the mesoporous surface area obtained by nitrogen adsorption isotherms might originate from pore closure rather from pore collapse, i.e. the opening of the pores collapses first, transforming the open porosity (which is visible both in nitrogen adsorption and in SAXS) into closed porosity (which can be detected only by SAXS).
4. Conclusions
Stability tests of different mesoporous silicas in acidic solutions reveal that silicas are all partially attacked by the tested media. The degradation of silicas results in some loss of their textural and structural properties. However, the degradation rate depends on the nature of the acidic media and also on type of silica.From these observations, we have summarised in Fig. 7 the main mechanisms driving the observed changes:
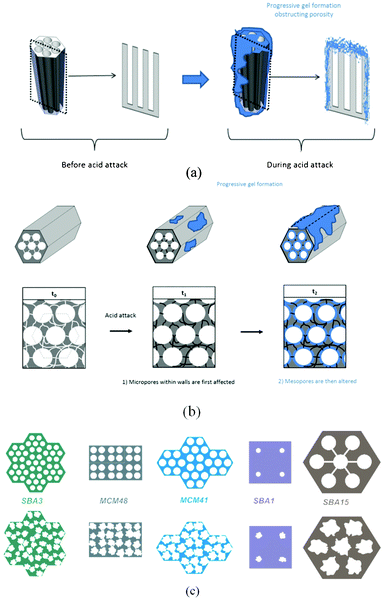 | ||
| Fig. 7 (a) Global gel formation, (b) mechanism of porosity filling in SBA15, and (c) acidic effects on different mesoporous silica depending both on the pore size and wall thickness. | ||
1. The action of the acids results in the formation of a small volume fraction of “gel” consisting mostly of (SiOH2)n. This gel results from the action of a proton that interacts with the bridging oxygen and breaks the Si–O bond to form a silanol Si–OH. The counter-ion “Nu”, then compensates the positive charge created on the silicon to obtain a system of Si–OH/Si–Nu (see Fig. 3b). The equilibrium of this reaction is strongly shifted to condensation. The formation kinetics of this gel are strongly dependent on the catalytic activity of the anion associated to the employed acid. The order from the most “destructive” acid to the least was PO43− > Cl− > SO42− and was related to the nucleophilic character of the counterions.
2. Micropores are the first to be impacted by phosphoric acid attack. Indeed, the gel that forms fills the small micropores first, as evidenced in the case of SBA-15 (micropores in the wall) and as seems reasonable for SBA-3 and MCM-48 (which feature very small pores and both of whose specific surface area and the SAXS data indicate collapse).
3. The gel recondenses into a thermodynamically stable matrix.
These experiments demonstrated that the effects of phosphoric acid damage depend strongly on the wall thickness of silica used and also the pore size of the mesoporous structure. Fig. 7c sketches these effects. In this scheme each pore size and wall thickness has been drawn at the same scale. SBA-3 and MCM-48 show the same wall thickness (1.4 nm) but the acid damages seem to be more important for the SBA-3 structure. As SBA-3 has a pore diameter lower than MCM-48, the obstruction of pores led by the acid is faster and results in a decrease of specific surface area (BET) correlated to a loss of 2D-hexagonal structure (SAXS). MCM-48 also loses a part of its surface but its structure is more slowly affected. To sum up, after 24 h of contact with acid, the specific surface areas of SBA-3 and MCM-48 decrease significantly but contrary to SBA-3, which loses its structure at the same time, MCM-48 globally conserves its structure (see ESI†). Concerning MCM-41, which has nearly the same wall thickness than SBA-3 and MCM-48 (1.5 nm) but a pore size higher than its (2.9 nm), we can notice that its 2D-hexagonal structure is perfectly conserved (see SAXS ESI†).
So, it is important to keep in mind that silica stability in acidic media is not only due to the wall thickness but also and above all due to the pore diameter. These two parameters are strongly dependent.
These results support the existence of a critical pore size and a critical wall thickness below which samples do not exhibit any resistance to phosphoric acid.
Acknowledgements
This work was supported by CEA. We acknowledge Marc Delpech for fruitful discussion, and Cyrielle Rey for her help with the nitrogen adsorption experiments.References
- J. R. Cabrero-Antonino, T. Garcia, P. Rubio-Marques, J. A. Vidal-Moya, A. Leyva-Perez, S. S. Al-Deyab, S. I. Al-Resayes, U. Diaz and A. Corma, ACS Catal., 2011, 1, 147–158 CrossRef CAS.
- A. Corma, U. Diaz, T. Garcia, G. Sastre and A. Velty, J. Am. Chem. Soc., 2010, 132, 15011–15021 CrossRef CAS.
- A. Taguchi and F. Schuth, Microporous Mesoporous Mater., 2005, 77, 1–45 CrossRef CAS.
- R. J. White, R. Luque, V. L. Budarin, J. H. Clark and D. J. Macquarrie, Chem. Soc. Rev., 2009, 38, 481–494 RSC.
- J. M. Notestein and A. Katz, Chem.–Eur. J., 2006, 12, 3954–3965 CrossRef CAS.
- F. Goettmann, A. Moores, C. Boissiere, P. Le Floch and C. Sanchez, Small, 2005, 1, 636–639 CrossRef CAS.
- P. Le Floch, C. Sanchez, F. Goettmann, A. Moores and C. Boissiere, Thin Solid Films, 2006, 495, 280–285 CrossRef.
- J.-F. Chen, H.-M. Ding, J.-X. Wang and L. Shao, Biomaterials, 2004, 25, 723–727 CrossRef CAS.
- T. Heikkilä, J. Salonen, J. Tuura, M. S. Hamdy, G. Mul, N. Kumar, T. Salmi, D. Y. Murzin, L. Laitinen, A. M. Kaukonen, J. Hirvonen and V. P. Lehto, Int. J. Pharm., 2007, 331, 133–138 CrossRef.
- P. Munusamy, M. N. Seleem, H. Alqublan, R. Tyler Jr, N. Sriranganathan and G. Pickrell, Mater. Sci. Eng., C, 2009, 29, 2313–2318 CrossRef CAS.
- P. Yang, G. Wirnsberger, H. C. Huang, S. R. Cordero, M. D. McGehee, B. Scott, T. Deng, G. M. Whitesides, B. F. Chmelka, S. K. Buratto and G. D. Stucky, Science, 2000, 287, 465–467 CrossRef CAS.
- G. Wirnsberger, P. Yang, B. J. Scott, B. F. Chmelka and G. D. Stucky, Spectrochim. Acta, Part A, 2001, 57, 2049–2060 CrossRef CAS.
- C. Delchet, A. Tokarev, X. Dumail, G. Toquer, Y. Barre, Y. Guari, C. Guerin, J. Larionova and A. Grandjean, RSC Adv., 2012, 2, 5707–5716 RSC.
- D. J. M. Meyer, S. Bourg, O. Conocar, J.-C. Broudic, J. J. E. Moreau and M. W. C. Man, C. R. Chim., 2007, 10, 1001–1009 CrossRef CAS.
- P. J. Lebed, K. de Souza, F. Bilodeau, D. Lariviere and F. Kleitz, Chem. Commun., 2011, 47, 11525–11527 RSC.
- P. Makowski, X. Deschanels, A. Grandjean, D. Meyer, G. Toquer and F. Goettmann, New J. Chem., 2012, 36, 531 RSC.
- L. Bai, H. Hu, W. Fu, J. Wan, X. Cheng, L. Zhuge, L. Xiong and Q. Chen, J. Hazard. Mater., 2011, 195, 261–275 CrossRef CAS.
- B. Lee, Y. Kim, H. Lee and J. Yi, Microporous Mesoporous Mater., 2001, 50, 77–90 CrossRef CAS.
- M. Najafi, Y. Yousefi and A. A. Rafati, Sep. Purif. Technol., 2012, 85, 193–205 CrossRef CAS.
- H. Yang, R. Xu, X. Xue, F. Li and G. Li, J. Hazard. Mater., 2008, 152, 690–698 CrossRef CAS.
- Z. Zhu, X. X. Yang, L. N. He and W. Li, RSC Adv., 2012, 2, 1088–1095 RSC.
- Y. Wan and D. Y. Zhao, Chem. Rev., 2007, 107, 2821–2860 CrossRef CAS.
- M. J. Wasbrough, K. J. Edler, A. M. Hawley, J. A. Holdaway and G. J. Price, Soft Matter, 2012, 8, 3357–3362 RSC.
- R. Mokaya, J. Phys. Chem. B, 1999, 103, 10204–10208 CrossRef CAS.
- R. Ryoo and S. Jun, J. Phys. Chem. B, 1997, 101, 317–320 CrossRef CAS.
- W. Vogelsberger, M. Lobbus, J. Sonnefeld and A. Seidel, Colloids Surf., A, 1999, 159, 311–319 CrossRef CAS.
- G. B. Alexander, W. M. Heston and R. K. Iler, J. Phys. Chem., 1954, 58, 453–455 CrossRef CAS.
- L. M. Huang and Q. Z. Li, in Studies in Surface Science and Catalysis, ed. S. Abdelhamid and J. Mietek, Elsevier, 2000, pp. 93–98 Search PubMed.
- I. Izquierdo-Barba, M. Colilla, M. Manzano and M. Vallet-Regí, Microporous Mesoporous Mater., 2010, 132, 442–452 CrossRef CAS.
- J. F. Bardeau, A. Gourbil, M. Dutreilh-Colas, S. Dourdain, A. Mehdi and A. Gibaud, Thin Solid Films, 2006, 495, 191–196 CrossRef CAS.
- M. J. Kim and R. Ryoo, Chem. Mater., 1999, 11, 487–491 CrossRef CAS.
- O. A. Anunziata, A. R. Beltramone, M. L. Martinez and L. L. Belon, J. Colloid Interface Sci., 2007, 315, 184–190 CrossRef CAS.
- D. Y. Zhao, J. L. Feng, Q. S. Huo, N. Melosh, G. H. Fredrickson, B. F. Chmelka and G. D. Stucky, Science, 1998, 279, 548–552 CrossRef CAS.
- D. Kumar, K. Schumacher, C. D. F. von Hohenesche, M. Grun and K. K. Unger, Colloids Surf., A, 2001, 187, 109–116 CrossRef.
- J. Xu, Z. H. Luan, H. Y. He, W. Z. Zhou and L. Kevan, Chem. Mater., 1998, 10, 3690–3698 CrossRef CAS.
- K. S. W. Sing, Adv. Colloid Interface Sci., 1998, 76–77, 3–11 CrossRef CAS.
- S. Brunauer, P. H. Emmett and E. Teller, J. Am. Chem. Soc., 1938, 60, 309–319 CrossRef CAS.
- E. P. Barrett, L. G. Joyner and P. P. Halenda, J. Am. Chem. Soc., 1951, 73, 373–380 CrossRef CAS.
- P. I. Ravikovitch, D. Wei, W. T. Chueh, G. L. Haller and A. V. Neimark, J. Phys. Chem. B, 1997, 101, 3671–3679 CrossRef CAS.
- P. I. Ravikovitch and A. V. Neimark, Colloids Surf., A, 2001, 187, 11–21 CrossRef.
- A. Grandjean, G. Toquer and T. Zemb, J. Phys. Chem. C, 2011, 115, 11525–11532 CAS.
- R. J. P. Corriu, C. Guerin, B. J. L. Henner and Q. Wang, Organometallics, 1991, 10, 3200–3205 CrossRef CAS.
- A. Davidson, Curr. Opin. Colloid Interface Sci., 2002, 7, 92–106 CrossRef CAS.
- C. J. Brinker, J. Non-Cryst. Solids, 1988, 100, 31–50 CrossRef CAS.
- C. Boissiere, A. Larbot and E. Prouzet, Chem. Mater., 2000, 12, 1937–1940 CrossRef CAS.
- E. Economopoulos and T. Ioannides, J. Sol-Gel Sci. Technol., 2009, 49, 347–354 CrossRef CAS.
- T. N. M. Bernards, M. J. Van Bommel and J. A. J. Jansen, J. Sol-Gel Sci. Technol., 1998, 13, 749–752 CrossRef CAS.
- R. K. Iler, J. Phys. Chem., 1952, 56, 680–683 CrossRef CAS.
- A. P. Tai, Scientia Sinica, 1963, 12, 1311 CAS.
- K. D. Keefer, Advances in Chemistry Series, 1990, 227–240 Search PubMed.
- S. E. Denmark and G. L. Beutner, Angew. Chem., Int. Ed., 2008, 47, 1560–1638 CrossRef CAS.
- C. Carrignon, P. Makowski, M. Antonietti and F. Goettmann, Tetrahedron Lett., 2009, 50, 4833–4837 CrossRef CAS.
- H. Kaper, M. Antonietti and F. Goettmann, Tetrahedron Lett., 2008, 49, 4546–4549 CrossRef CAS.
Footnote |
| † Electronic Supplementary Information (ESI) available: description of the synthesis of mesoporous silicas; nitrogen adsorption isotherm for SBA-15 and SBA-3 before and after acid attacks; textural and structural parameters for all silicas before and after tests in phosphoric acid; wall thickness calculation details; nitrogen adsorption isotherm, SAXS spectra and NMR spectra before and after phosphoric acid attack for SBA-1, SBA-3, SBA-15, MCM-41, and MCM-48. See DOI: 10.1039/c2ra21569a |
| This journal is © The Royal Society of Chemistry 2012 |
