Enhanced quantum efficiency for Dy3+ Emissions in water dispersible PbF2 nanocrystals†
Shyam
Sarkar
a,
Chanchal
Hazra
a,
Manjunath
Chatti
a,
Vasanthakumaran
Sudarsan
b and
Venkataramanan
Mahalingam
*a
aDepartment of Chemical Sciences, Indian Institute of Science Education and Research (IISER), Kolkata, Mohanpur, West Bengal 741252, India. E-mail: mvenkat@iiserkol.ac.in; Tel: +91(0)9007603474
bChemistry Division, Bhabha Atomic Research Centre, Trombay, Mumbai 400085, India. Fax: 91-22-25505151; Tel: 91-22- 25590289
First published on 26th July 2012
Abstract
PbF2 nanocrystals found to be a better host for Dy3+ ions to exhibit better quantum efficiency. The optimum dopant concentration is found to be higher than that observed in several bulk materials. The nanocrystals are rendered water dispersible by coating poly(acrylic acid) over their surface.
The Lanthanide (Ln3+)-doped nanomaterials are currently getting much attention due to their rich optical properties which arise from their inner 4f electrons.1 These 4f electrons undergo transition within the 4f orbitals which are generally forbidden, but allowed due to partial admixing of states. The forbidden nature of these 4f transitions lengthens the excited state life time resulting in narrow emission signal.2 Moreover, the 4f orbitals are less influenced by the ligand orbitals causing hardly any shift in the peak position. A wide range of emission signals from UV to NIR can be obtained by choosing suitable Ln3+ ions.3 In addition, the Ln3+ ions can exhibit the upconverting property, which is the conversion of low energy radiation into high energy radiation.4
Among the various Ln3+-doped materials, literature reports on Dy3+-doped nanomaterials are quite scarce. One of the reasons is that Dy3+ is quite prone to concentration quenching in several hosts.5 For example, the optimum concentration of Dy3+ is only 2 % in Dy3+-doped oxides such as La3Ga5.5Nb0.5O14, ZrO2 nanocrystals, etc.6 Similarly, Dy3+-doped GdVO4 nanoparticles exhibit the highest luminescent intensity for 2 % Dy3+ doping.5 In addition to the concentration quenching, the luminescence efficiency is further reduced due to presence of defects near the surface of the nanoparticles. However, they exhibit several interesting optical characteristics. First, they display two strong emissions one in the blue region (479 nm) and the other in the yellow (580 nm) region of the electromagnetic spectrum.7 The appropriate combination of these two emissions will lead to the production of white light emission without the addition of any other lanthanide ions.8 Second, Dy3+ possesses several excitation levels in the 340–480 nm spectral range which allow it to be excited easily with the commercially available ultraviolet or blue light emitting diodes (LEDs). Finally, Dy3+ exhibits multiple emissions in the near infrared region like 0.9, 1.1, 1.3, 1.7 and 3 μm which are very important for telecommunication applications.9
All the above points demand an improvement in the luminescence efficiency of Dy3+-doped nanomaterials, as Dy3+ ions are very prone to concentration quenching and enhancement is still a challenge. In fact, achieving this in aqueous medium is particularly interesting as this would widen the scope of their application particularly in the development of sol–gel based glasses.10 We chose PbF2 as the host matrix for Ln3+ ions for the following reasons. First, PbF2 is a highly transparent material allowing a wide range of light to pass through without much attenuation in luminescence. Second, the phonon energy is below 250 cm−1, which is much lower than that of other lanthanide fluorides (350–400 cm−1).11 Third, PbF2 undergoes a phase transition from α→β at temperatures above 335 °C, making it interesting for structure–property studies.12 In addition, to the best of our knowledge, only very few reports are available on Ln3+-doped PbF2 nanoparticles.13 For example, Tikhomirov et al., have reported the synthesis of Ln3+-doped PbF2 nanoparticles through chemical etching of the bulk glass ceramic.13 Yb/Er-doped PbF2 nanoparticles have been made via the microemulsion method. However, the synthetic routes provided nanoparticles devoid of any capping ligands for stabilization or dispersion in various medium. All these factors motivate us to develop a synthetic route for Dy3+-doped PbF2 nanocrystals.
In this paper, we report the synthesis of water dispersible Dy3+-doped PbF2 nanocrystals via the hydrothermal method (see ESI† for more details). The nanocrystals are stabilized with poly(acrylic acid)(PAA) which render them water dispersible. The nanocrystals show strong Dy3+ luminescence signals in water. Moreover, the optimum concentration of Dy3+ in PbF2 nanocrystals is about 5 mol%, which is more than that observed for Dy3+ in other superior matrices such as Gd2O3, GdVO4,etc.
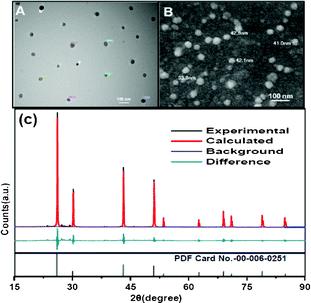
Fig. 1 (A and B) shows the TEM and FESEM images of the PAA-coated PbF2 nanocrystals. The images indicate the formation of spherical shape nanocrystals with an average size of 50 nm. Additional microscopic images are shown in Fig. S1 and S2 (see ESI†). The phase analysis of the series of PAA-coated PbF2:Dy3+(x %), [x = 0, 1, 2, 5, 8] nanocrystals was performed using X-ray diffraction (XRD). The XRD pattern for 5 % Dy3+-doped PbF2 is shown in Fig. 1C. The pattern clearly indicates the formation of pure cubic phase. All diffraction peaks are perfectly indexed to the cubic PbF2 systems which are in good agreement with the standard pattern of cubic PbF2 crystals (PDF card No. 00-006-0251). Furthermore, the calculated Rietveld refinement of the resulting pattern matches with the experimental one. The PXRD patterns for PbF2 with different Dy3+ doping concentrations are shown in Fig. S3, ESI†. The crystallite size, calculated using the Scherer equation, t = (0.9λ/βcosθ), is found to be 48 nm. This is in agreement with the size measured from the microscopic analyses.
 | ||
| Fig. 1 TEM (A) and FESEM (B) images of Dy3+-doped PbF2 nanocrystals. (C) Experimental, Rietveld refined pattern of PbF2 nanocrystals along with the standard XRD pattern for PbF2. | ||
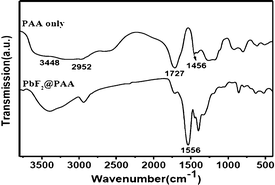
The binding of the PAA molecules to the PbF2 nanocrystals is confirmed by FTIR spectrum shown in Fig. 2 along with that of pure PAA. For the free PAA, five major peaks are observed near 3448, 2952, 1727, 1455 and 1407 cm−1. The strong and broad stretching vibration band centered at 3448 cm−1 is due to O–H in a –COOH group and the peak at 2952 cm−1 is attributed to the methylene (CH2) stretching vibrations of the alkyl chains of PAA. The band at 1727 cm−1 is assigned to the C![[double bond, length as m-dash]](https://www.rsc.org/images/entities/char_e001.gif) O stretching vibration of the –COOH group, and the bands at 1456 and 1407 cm−1 are due to asymmetric and symmetric stretching vibrations, respectively, of the C–O in –COOH group of the PAA coated over PbF2.14 It is quite clear, that the intensity of the carbonyl stretching near 1727 cm−1 for the free PAA is reduced and a new peak appears near 1556 cm−1. This clearly suggests that –COO groups are attached strongly to the Pb2+ of PbF2. The weak intensity of 1727 cm−1 peak indicates that most of the –COO− are attached to the Pb2+ ions in the PbF2 nanocrystals. Moreover, for the free PAA molecules, the region between 3500 and 2800 cm−1 is quite broad indicating the presence of different types of OH groups (i.e. some are hydrogen bonded). However, upon binding to the PbF2, the OH peaks are comparatively narrowed suggesting that the OH groups of the PAA are in a structured environment. It is this PAA coating that makes these nanocrystals water dispersible. In addition, the PAA coating protects the Pb2+ ions from leaching out from the nanocrystals surface which is important for their potential for any biological study. A schematic of the PAA binding to the PbF2 nanocrystals is illustrated in Fig. S2.
O stretching vibration of the –COOH group, and the bands at 1456 and 1407 cm−1 are due to asymmetric and symmetric stretching vibrations, respectively, of the C–O in –COOH group of the PAA coated over PbF2.14 It is quite clear, that the intensity of the carbonyl stretching near 1727 cm−1 for the free PAA is reduced and a new peak appears near 1556 cm−1. This clearly suggests that –COO groups are attached strongly to the Pb2+ of PbF2. The weak intensity of 1727 cm−1 peak indicates that most of the –COO− are attached to the Pb2+ ions in the PbF2 nanocrystals. Moreover, for the free PAA molecules, the region between 3500 and 2800 cm−1 is quite broad indicating the presence of different types of OH groups (i.e. some are hydrogen bonded). However, upon binding to the PbF2, the OH peaks are comparatively narrowed suggesting that the OH groups of the PAA are in a structured environment. It is this PAA coating that makes these nanocrystals water dispersible. In addition, the PAA coating protects the Pb2+ ions from leaching out from the nanocrystals surface which is important for their potential for any biological study. A schematic of the PAA binding to the PbF2 nanocrystals is illustrated in Fig. S2.
 | ||
| Fig. 2 FTIR spectra of PAA alone and the same coated over PbF2 nanocrystals. | ||
To further confirm the PAA coating onto PbF2 nanocrystals, TGA analysis was conducted. The TGA curves for both PAA coated PbF2 and free PAA are shown in Fig. S3, ESI†. For the free PAA the major weight loss is noted from 200 to 550 °C due to the decomposition of PAA molecules. For the PAA coated PbF2 nanocrystal, the onset of decomposition is shifted to higher temperature (∼340 °C). This substantiates the FTIR result that the PAA molecules are attached strongly to the PbF2 surface. In addition, the narrow decomposition range indicates that all the nanocrystals are more or less evenly coated with the PAA.
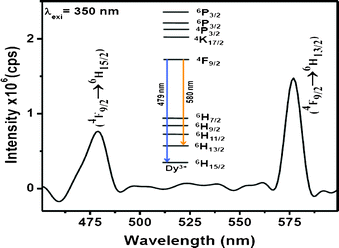
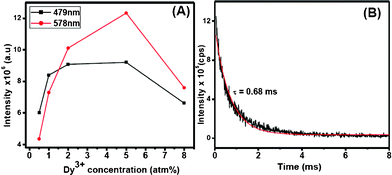
The optical properties of the Dy3+-doped PbF2 nanocrystals show interesting results. Upon UV excitation, the nanocrystals exhibit two strong emissions which are shown in Fig. 3. The blue emission peak at 478 nm is assigned to the 4F9/2→6H15/2 transition while the one near 580 nm is ascribed to the 4F9/2→6H13/2 transition. The latter transition is hypersensitive and its intensity strongly depends on the host, whereas the 4F9/2→6H15/2 transition is less sensitive to the host matrix. The transitions and the energy levels are illustrated in the inset of Fig. 3. To get the optimum concentration of Dy3+ ions in PbF2 nanocrystals, a series of PbF2 nanocrystals with different Dy3+ concentration is prepared. The emission intensities of both 479 nm and 580 nm peaks of Dy3+ ions have been plotted as a function of Dy3+ concentration and shown in Fig. 4A. It has been found that the PL intensities of both 478 and 580 nm peaks increase with increase in Dy3+ concentration up to 5 mol% doping and then show a decrease
 | ||
| Fig. 3 Emission spectrum of 5 % Dy3+-doped PbF2 nanocrystals (2 wt% dispersion in water). Inset illustrates the energy levels and the transitions. | ||
 | ||
| Fig. 4 (A) Plot of emission intensity verses Dy3+-doping concentration and (B) luminescence decay curve observed for 579 nm emission. The red trace is the fitted curve. | ||
It is interesting to note that the observed optimum concentration (5 %) of Dy3+ in PbF2 is higher compared to many of the bulk oxide materials where the optimum concentration of Dy3+ is found to be 2 % (vide supra). Furthermore, the observed lifetime for the 579 nm emission (4F9/2→6H13/2) of Dy3+ is about 0.68 ms as calculated from the decay analysis (Fig. 4B). This value is longer than the 0.4 ms observed for the similar emission in Dy3+-doped NaYF4 microcrystals.8 The increased optimum concentration and the lifetime are further supported by the quantum efficiency of the resulting Dy3+-doped PbF2 nanocrystals. The calculated quantum yield is about 7 % which is measured using quinine sulphate as the reference standard. The details of the measurement and the calculations are presented in the supplementary information, Fig. S5, ESI†). This value is higher than the calculated 1.5 % for colloidal Dy3+(5 %)-doped LaVO4 nanocrystals with an average size of 40 nm.15 Although the size of LaVO4 nanocrystals is slightly smaller , it is reasonable to presume that the high phonon energy of vanadates (∼850 cm−1) compared to PbF2 may not lead to very high quantum yield. The above points clearly suggest that PbF2 is a better host for the Dy3+ ions.
To understand the reason for the increased quantum efficiency for Dy3+ in PbF2 nanocrystals, we compared the distance between the neighbouring Pb atoms in PbF2 with that of the LaF3 which is one of the superior hosts for the Ln3+ ions. The calculated Pb-Dy distance in our PbF2:Dy nanocrystals is about 3.924 Å. This is done by considering the Pb-F distance (2.571 Å) and F-Pb-F angles (109.47°) from the refined parameters. This value is supported by the ∼4.0 Å Pb-Pb distance observed for the bulk PbF2.17 Whereas the reported value for the La-Pr in LaF3:Pr is close to 4.1 Å.18 The slightly larger distance for Pb-Dy compared to La-Pr implies that the distance between the neighbouring ions may not be the reason for the observed higher optimum dopant concentration. To verify whether PAA coating has any influence on the luminescence, we prepared Dy3+-doped PbF2 without PAA coating under identical conditions. The observed lifetime for the Dy3+ is about 0.47 ms which is lower compared to the PAA coated PbF2 nanocrystals. This implies that one of the reason for the enhanced quantum yield for Dy3+ in the PbF2 matrix is the strong PAA coating which probably reduces the number of defects near the surface. The measured decay curve is displayed in Fig. S6 (ESI†).
Finally, to verify that PbF2 is a good host for other Ln3+ as well, we prepared Eu3+-doped PbF2 nanocrystals using a similar method. The emission spectrum of 5 % Eu3+-doped PbF2 displayed in Fig. S7 (ESI†) exhibited strong Eu3+ signals in water. The calculated quantum yield for the Eu3+-doped sample is 16.21 % with reference to the quinine sulphate. This value is close to that of 16 % observed for Ce/Tb3+-doped LaF3 nanocrystals.16 The fact the Ce3+ has higher absorption co-efficient suggests that observed quantum yield (16 %) for Eu3+ in PbF2 is a good value. The high quantum yield is also supported by the long luminescence lifetime (1.21 ms) observed for the PAA coated Eu3+-doped PbF2 nanocrystals. The decay curve is shown in Fig. S8 (ESI†).
Conclusions
In this article we report the hydrothermal synthesis of poly(acrylic acid) coated Dy3+-doped PbF2 nanocrystals for the first time. The nanocrystals are in the size range of 50 nm. The strong binding of the polymer to the PbF2 surface not only protects the Pb2+ from leaching in to the solution but enhances their dispersibility in aqueous solvents such as water. Upon UV excitation, the nanocrystals display strong blue and yellow luminescence characteristics of Dy3+ ions. Interestingly, the observed optimum Dy3+ concentration in PbF2 nanocrystals is about 5 mol% which is higher compared to even some of the bulk oxide materials. This led to the enhanced Dy3+ luminescence quantum yield in PbF2 nanocrystals. The better quantum efficiency, water dispersibility together with the high transparency of Ln3+-doped PbF2 nanocrystals can be envisioned for bio-marking as well as in developing sol–gel based glasses.VM thanks the Department of Science and Technology (DST), India and IISER-Kolkata for the funding. SS and CH thank UGC and IISER-K, respectively for the scholarship. VS thanks BARC, Mumbai for the financial support. We thank Dr. Aparna Laskar for helping us with TEM measurements. We thank the reviewers for the very valuable comments which helped us improving our article.
References
- (a) G. Blasse, B. C. Grabmaier, Luminescent Materials, Springer, Berlin, 1994 Search PubMed; (b) C. G. Bünzli, Chem. Rev., 2002, 102, 1897–1928 CrossRef; (c) C. R. Ronda, T. Jüstel and H. Nikol, J. Alloys and Compnd., 1998, 275–277, 669 CAS; (d) F. Wang, R. Deng, J. Wang1, Q. Wang, Y. Han, H. Zhu, X. Chen and X. Liu, Nature Mater., 2011, 10, 968 CrossRef CAS; (e) F. Wang, Y. Han, C. S. Lim, Y. Lu, J. Wang, J. Xu, H. Chen, C. Zhang1 and X. Liu, Nature, 2010, 463, 1061 CrossRef CAS.
- (a) S. Cotton, Lanthanide and Actinide Chemistry, John Wiley&Sons, West Sussex, 2006 Search PubMed; (b) J.-C. G. Bünzli, Chem. Rev., 2010, 110, 2729 CrossRef.
- (a) J.-C. G. Bünzli and C. Piguet, Chem. Soc. Rev., 2005, 34, 1048 RSC; (b) V. Sudarsan, F. C. J. M. van Veggel, R. A. Herring and M. Raudsepp, J. Mater. Chem., 2005, 15, 1332 RSC; (c) J. W. Stouwdam and F. C. J. M. van Veggel, Nano Lett., 2002, 2, 733 CrossRef CAS; (d) B. M. Tissue, Chem. Mater., 1998, 10, 2837 CrossRef CAS; (e) K. Riwotzki, H. Meyssamy, A. Kornowski and M. Haase, J. Phys. Chem. B, 2000, 104, 2824 CrossRef CAS; (f) S. Polizzi, S. Bucella, A. Speghini, F. Vetrone, R. Naccache, J. C. Boyer and J. A. Capobianco, Chem. Mater., 2004, 16, 1330 CrossRef CAS; (g) C. Li and J. Lin, J. Mater. Chem., 2010, 20, 6831 RSC; (h) E. Cavalli, M. Bettinelli, A. Belletti and A. Speghini, J. Alloys Compnd., 2002, 341, 107 CrossRef CAS.
- (a) F. Wang and X. Liu, Chem. Soc. Rev., 2009, 38, 976 RSC; (b) F. Wang, J. Wang and X. Liu, Angew. Chem. Int. Ed., 2010, 49, 7456 CrossRef CAS; (c) F. Wang and X. Liu, J. Am. Chem. Soc., 2008, 130, 5642 CrossRef CAS; (d) S. Sivakumar, F. C. J. M. van Veggel and M. Raudsepp, J. Am. Chem.Soc., 2005, 127, 12464 CrossRef CAS; (e) R. H. Sch_fer, P. Ptacek, K. Kçmpe and M. Haase, Chem. Mater., 2007, 19, 1396 CrossRef; (f) H.-Q. Wang and T. Nann, ACS Nano, 2009, 3, 3804 CrossRef CAS; (g) R. Naccache, F. Vetrone, V. Mahalingam, L. A. Cuccia and J. A. Capobianco, Chem. Mater., 2009, 21, 717 CrossRef CAS; (h) V. Mahalingam, F. Vetrone, R. Naccache, A. Speghini and J. A. Capobianco, J. Mater. Chem., 2009, 19, 3149 RSC.
- (a) M. L. Pang, W. Y. Shen and J. Lin, J. Appl. Phys., 2005, 97, 033511 CrossRef; (b) N. S. Singh, R. S. Ningthoujam, N. Yaiphaba, S. Dorendrajit Singh and R. K. Vatsa, J. Appl. Phys., 2009, 105, 064303 CrossRef.
- (a) F. P. Yu, D. R. Yuan, L. M. Kong, X. L. Duan, S. Y. Guo1, X. Q. Wang and X. Zhao, Nanotechnology, 2008, 19, 045705 CrossRef CAS; (b) F. Gu, S. F. Wang, M. K. Lu, G. J. Zhou, S. W. Liu, X. Dong and D. R. Yuan, Chem. Phys. Lett., 2003, 380, 185 CrossRef CAS.
- (a) W. Wang, P. Yang, S. Gai, N. Niu, F. He and J. Lin, J. Nanopart. Res., 2010, 12, 2295 CrossRef CAS; (b) P. Dimple Dutta, V. Sudarsan, P. Srinivasu, A. Vinu and A. K. Tyagi, J. Phys. Chem. C, 2008, 112, 6781 CrossRef; (c) W. Lü, H. Zhou, G. Chen, J. Li, Z. Zhu, Z. You and C. Tu, J. Phys. Chem. C, 2009, 113, 3844 CrossRef.
- C. Cao, H. K. Yang, J. W. Chung, B. K. Moon, B. C. Choi, J. H. Jeong and K. H. Kim, J. Am. Ceram. Soc., 2011, 94, 3405–3411 CrossRef CAS.
- (a) L. F. Johnson and H. J. Guggenheim, Appl. Phys. Lett., 1973, 23, 96 CrossRef CAS; (b) V. K. Tikhomirov, K. Driesen and C. Görller-Walrand, Phys. Status Solidi A, 2001, 204, 839 CrossRef.
- (a) V. A. Aseev, V. V. Golubkov, A. V. Klementeva, E. V. Kolobkova and N. V. Nikonorov, Optics and Spectroscopy, 2009, 106, 691 CrossRef CAS; (b) C. H. Kam and S. Buddhudu, Solid State Communications, 2003, 128, 309 CrossRef CAS.
- V. K. Tikhomirov, G. Adamo, A. E. Nikolaenko, V. D. Rodriguez, P. Gredin, M. Mortier, N. I. Zheludev and V. V. Moshchalko, Opt. Exp., 2010, 18, 8836 CrossRef CAS.
- (a) K. F. Portella, K. R. Rattmann, G. P. De Souza, C. M. Garcia, M. P. Cantão and R. Muccillo, J. Mater., Sci., 2000, 35, 3263 CrossRef CAS; (b) H. E. Lorenzana, E. Klepeis, M. J. Lipp, W. J. Evans, H. B. Radousky and M. V. Schilfgaarde, Phys Rev B, 1997, 56, 543 CrossRef CAS; (c) D.L. Alov and I. Rybchenko, J Phys Condens. Matter, 1995, 7, 1475 CrossRef CAS; (d) P. Thangadurai, S. Ramasamy and R. Kesavamoorthy, J Phys Condens. Matter, 2005, 17, 863 CrossRef CAS.
- (a) V. K. Tikhomirov, M. Mortier, P. Gredin, G. Patriarche, C. Görller-Walrand and V. V. Moshchalkov, Opt. Exp., 2008, 16, 14544 CrossRef CAS; (b) J. Labéguerie, G. Dantelle, P. Gredin and M. Mortier, J. Alloys Comp., 2008, 451, 563 CrossRef.
- P. Ge, Y. X. Hu, M. Biasini, C. L. Dong, J. H. Guo, W. P. Beyermann and Y. D. Yin, Chem.–Eur. J., 2007, 13, 7153 CrossRef.
- J. Liu and Y. Li, Adv. Mater., 2007, 19, 1118 CrossRef CAS.
- F. Wang, Y. Zhang, X. Fan and M. Wang, J. Mater. Chem., 2006, 16, 1031 RSC.
- D. F. Anderson, J. A. Kierstead, P. Lecoq, S. Stoll and C. L. Woody, Nucl. Instr. and Meth. in Phys. Res. A, 1994, 342, 473 CrossRef CAS.
- M. Matsushita, A. Mutoh and T. Kato, Phys. Rev. B, 1998, 58, 14372 CrossRef CAS.
Footnote |
| † Electronic Supplementary Information (ESI) available: Details of the synthesis, XRD patterns, TGA, quantum yield calculations, PL of Eu3+-doped PbF2 nanocrystals. See DOI: 10.1039/c2ra21113k/ |
| This journal is © The Royal Society of Chemistry 2012 |
