Flexible dye-sensitized ZnO quantum dots solar cells†
Aiying
Pang
,
Caiyun
Chen
,
Ling
Chen
,
Wei
Liu
and
Mingdeng
Wei
*
Institute of Advanced Energy Materials, Fuzhou University, Fuzhou, Fujian 350002, China. E-mail: wei-mingdeng@fzu.edu.cn; Fax: +86-591-83753180
First published on 8th August 2012
Abstract
ZnO QDs were successfully synthesized by using a simple synthetic route. The synthesized ZnO QDs have different shapes with highly crystalline nature and their size was found to be ca. 3–5 nm. At the same time, a series of modified N719 dyes were obtained via ion-exchange reactions and characterized by FTIR and HRMS measurements. When the modified N719 dyes were used as a sensitizer for ZnO QDs-based flexible solar cells, the photovoltaic properties were enhanced significantly. A highest efficiency of 2.94% was achieved; this might be attributed to the fact that the aggregate of Zn2+/dye on the surface of ZnO QDs can be suppressed efficiently owing to a less carboxylated (COOH) bipyridyl ligand in the modified N719 dye, inhibiting the formation of chelation between ZnO QDs and dye.
1. Introduction
Dye-sensitized solar cells (DSCs) provide a promising approach to the fabrication of environmental friendly photovoltaic devices with high efficiency and low cost.1,2 Such solar cells are also expected to be an alternative to conventional solid-state p–n junction solar cells and a new record of 12.3% has been achieved for porphyrin-sensitized solar cells.3 To date, many semiconductor oxides have been applied as electrode materials for DSCs, such as TiO2,4,5 ZnO,6 Nb2O5,7 SnO2,8 WO3,9 Zn2SnO410etc. Among them, nanocrystalline TiO2 and ZnO are found to be the most suitable materials owing to their high photovoltaic performances. As is well known, ZnO is believed to be a promising alternative material to TiO2, owing to its similar band gap, much higher electron mobility11 and comparable electron injection efficiency.12 Unfortunately, the efficiency of ZnO-based cells is still to be improved. Bedjia et al.13 reported that the interaction between Ru-based sensitizer and the surface of ZnO film influences the light-harvesting efficiency and charge-collecting efficiency, Westermark et al.14 believed that the energy mismatch between dye orbitals and the ZnO valence band might be a key factor in low efficiency. On the other hand, aggregation of dye/Zn2+ on the surface of ZnO films was also detected.15,16 In our previous work, the significant etching of ZnO nanoflower surface induced by a weak acid N719 dye solution was observed.17 Therefore, the fabrication of ZnO-based DSCs with a stable photovoltaic performance is still a challenge.In the past decade, ZnO with various nanostructures has been readily fabricated and used as electrodes for DSCs, such as ZnO nanocrystallites,18–21 aligned nanorods,22,23 ZnO nanotubes24,25 core–shell nanowires,26 hierarchical structures27 and nanoflowers.28 To the best of our knowledge, however, the work by Renata et al.29 is the only report dealing with DSC composed of ZnO QDs; they reported the fabrication of a ZnO QDs film upon calcination at high temperature. In fact, the crystalline size of ZnO QDs grew to ca. 20 nm and became essentially larger than QD dimensions. To avoid the growth of ZnO QDs, the use of a flexible substrate for fabricating DSCs might be an ideal approach. In the present work, ZnO QDs were successfully synthesized and then used as an electrode film for flexible DSCs, in which ZnO QDs can be retained during the fabrication process of flexible DSCs without calcination at high temperature. On other hand, modified N719 dye was used as a sensitizer in order to decrease the etching of the ZnO film or to suppress the aggregation of dye/Zn2+ on the surface of the ZnO film. A best efficiency of 2.94% was obtained under illumination of simulated AM 1.5 solar light (100 mW cm−2). Furthermore, the influences of modified dyes on the photovoltaic properties were also investigated.
2. Experimental
2.1 Synthesis of ZnO QDs
The synthesis of ZnO QDs was performed by using a modified sol–gel route.30 First, 0.98 g of Zn(Ac)2·2H2O was dissolved into 30 mL ethanol and refluxed at 80 °C for 3 h under stirring until a clear solution was obtained. In a separate solution LiOH·H2O (molar ratio of [LiOH]/[Zn] = 3) was dissolved into 40 mL ethanol under ultrasonic stirring. Finally, the two solutions were mixed under vigorous stirring and kept at 40 °C for 1 h. To obtain a precipitate of ZnO QDs, ethyl acetate or heptanes was added into the final product and then centrifuged. The obtained precipitate was dispersed in ethanol and then centrifuged several times in order to remove residual precursor, ethyl acetate and heptanes. Subsequently, the obtained ZnO QDs were dispersed in ethanol by ultrasonic stirring for 10 min and then sealed at room temperature for preparing solar cell film.2.2 Modification of N719 dye
37.8 mg of N719 and the different amounts of NaOH (12.5, 25, 37.5 mg) were dissolved in 50 ml deionized water under strong stirring until completely dissolved and 0.3 mM of N719 dye solution and NaOH solution (0.3, 0.6 and 0.9 mM) were obtained, respectively. After the dye solution was reacted with NaOH via ion-exchange with a rotary evaporation method at 80 °C, the products were dried in a vacuum oven at room temperature for overnight to obtain final samples 0.3 Na-N719, 0.6 Na-N719 and 0.9 Na-N719, respectively.2.3 Characterization of the samples
X-Ray diffraction (XRD) patterns were recorded on a PANalytical X′Pert spectrometer using Co-Kα radiation (λ = 1.78897 Å) and the data were converted to Cu-Kα data. Transmission electron microscopy (TEM) and selected area electron diffraction (SAED) pattern images were taken on a Tecnai G2 F20 (FEI) with an acceleration voltage of 200 kV. Fourier-transform infrared (FTIR) spectra were recorded on Perkin-Elmer Spectrum 2000. High-resolution mass spectra (HRMS) were recorded on an Agilent LC/MSD Trap XCT Plus System (America) using methyl alcohol as eluent.2.4 Solar cell assembly
The photoelectrode films were prepared through drop-casting of the ZnO QDs paste onto flexible substrates (PEN). The film thicknesses of the photoelectrode were measured by a Surfcom 130A instrumental set-up after the photoelectrode films were dried in air and annealed at 120 °C for 20 min. Finally, the dye sensitized ZnO QDs flexible photoelectrodes with a area of 0.25 cm2 were incorporated into a sandwiched solar cell with a Pt-coating counter electrode. The electrolyte consisted of 0.6 M 1,2-dimethyl-3-n-propylimidazolium iodide (DMPImI), 0.1 M LiI and 0.05 M I2 in acetonitrile (AN) with 0.5 M 4-tertbutylpyridine (TBP).2.5 Photovoltaic measurements
The photovoltaic performance of the cells was measured using a solar simulator PEC-L11 (Peccell Co. Ltd., AM 1.5, 100 mW cm−2). Action spectrum of the monochromatic incident photo-to-electricity conversion efficiency (IPCE) for the solar cells was measured with a PEC-S20 (Peccell Co. Ltd.) The incident light intensity was calibrated with a standard solar cell for an amorphous silicon solar cell produced by Japan Quality Assurance Organization. Electrochemical impedance spectra of ZnO QDs film electrodes were measured by using a ZAHNER (IM-6).3. Results and discussion
3.1 Characterization of ZnO QDs
Fig. 1 shows the XRD patterns of ZnO QDs precipitated from the ethanol and (b) ZnO QDs film taken from the flexible substrate PEN. All of the diffraction peaks can be indexed to a wurtzite ZnO structure with the lattice parameters a = 0.325 and c = 0.521 nm (JCPDS 36-1451). Fig. 1 clearly shows that the intensity of peaks for the latter increased slightly; this indicates that the size and crystallinity of ZnO QDs were increased after the photoelectrode film of ZnO QDs was prepared and then calcined at 120 °C. The sizes of ZnO QDs for two samples were calculated to be ca. 4 and 10 nm using the Debye–Scherrer equation, respectively. Moreover, no other diffraction peaks were detected, indicating that no new phase was formed during the preparation process of the photoelectrode film. | ||
| Fig. 1 XRD patterns of (a) ZnO QDs precipitated from ethanol and (b) ZnO QDs taken from the flexible substrate PEN. | ||
The crystalline nature of the ZnO QDs is evidenced in the TEM images of Fig. 2. Fig. 2a clearly shows that the ZnO QDs in ethanol were highly monodisperse; this can be attributed to acetate groups in the reaction system (as shown in Fig S1, ESI†). According to a report, the acetate groups in the reaction can suppress the aggregation of “magic” clusters and hence slow the growth of ZnO QDs.31 As depicted in Fig. 2b and c, ZnO QDs with a size of ca. 3–5 nm exhibited different shapes, such as hexahedra, pyramids, cubes and spheres, which are similar to previous reports.29,30 It is also confirmed that the synthesized ZnO QDs were highly crystalline. In general, the shape of particles is determined by the surface energies of the different crystal planes. In the present reaction system, a capping or leading agent such as oleic acid was not used.32 Thus, it is believed that the faceted characteristics may be simply governed by the presence of the byproduct lithium acetate during the aging process.33 As depicted in Fig. 2d, these diffraction rings can be indexed to the (100), (002), (101), (002), (101), (110) and (103) reflections, corresponding well to those of XRD patterns. Fig. 2e and f show the TEM and HRTEM images of ZnO QDs taken from the photoelectrode film. The aggregation of ZnO QDs can be observed, as depicted in Fig. 2e, and no heptanes were detected, as illustrated in Fig. S1 (ESI†). It can be seen from Fig. 2f that the ZnO QDs exhibited spherical-like particles with a diameter of ca. 10 nm; this might be attributed to the fact that the faceted shape would grow into nonfaceted spheres without carboxylate protection in the washing process.34
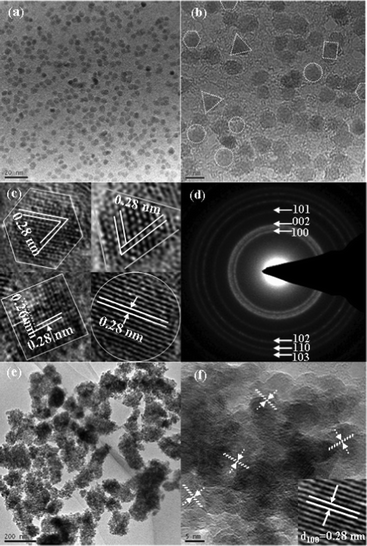 | ||
| Fig. 2 (a) TEM images and (b) HRTEM image of ZnO QDs dispersed in ethanol solution, (c) HRTEM images of ZnO QDs with different morphologies taken from (b), (d) SAED pattern of ZnO QDs, (e) TEM and (f) HRTEM images of a photoelectrode film made of ZnO QDs. | ||
3.2 Characterization of the modified N719 dyes
To suppress the aggregation of dye on the surface of ZnO QDs film, N719 dye was modified by different concentrations of NaOH solution via an ion-exchange reaction. The pH values were measured to be 6.86, 10.75, 10.97 and 11.03 for N719, 0.3 Na-N719, 0.6 Na-N719 and 0.9 Na-N719, respectively, demonstrating a decreased acidity of dye solution with increasing sodium content. The FTIR spectra of the modified N719 samples are shown together with the N719 dye in Fig. 3. A band at ca. 1716 cm−1 in Fig. 3a can be assigned to the bending vibration of C![[double bond, length as m-dash]](https://www.rsc.org/images/entities/char_e001.gif) O in N719 dye, but it tended to disappear in the modified N719 dyes. On the contrary, a band at ca. 1775 cm−1 appeared for the modified N719 dyes and became stronger with increasing the concentration of NaOH. According to the report, this band can be assigned to the stretching vibration of CO in N3 dye.35 These results indicated that the TBA group in N719 dye is progressively removed with increasing concentration of NaOH. On the other hand, the band at ca. 1468 cm−1 appearing in N719 can be assigned to the bending CH2 vibration of TBA. Bands at 1609, 1541 and 1428 cm−1 are assigned to bipyridyl absorption strengthened with replacement of TBA+ by Na+.36 The TBA bands at 1468 and 1428 cm−1 tended to disappear and a strong band at ca. 1450 cm−1 appeared with replacement of TBA+ by Na+. On the other hand, the bands at ca. 880, 786 and 701 cm−1 can be assigned to the bending vibration C–H of the inter-disubstituted aromatic ring. The intensity of these bands increased with increasing concentration of NaOH, indicating that the number of C–H increased. The loss of TBA cations and existence of Na+ in modified N719 were also confirmed by HRMS measurement, and the results are depicted in Fig. S2 (ESI†); Calc. for TBA, M1, M2, M3, M4, M5, M6, M7: m/z 242.5, 475.4, 588.5, 668.5, 701.8, 771.6, 814.9, 960.1. Found: m/z 242.6, 475.8, 588.8, 668.6, 701.8, 771.6, 814.9, 959.8, respectively, with fragment structures shown in Fig. S3 (ESI†). It could be concluded from the results of FTIR and HRMS spectra that TBA cations and H+ of the COOH group of N719 dye were substituted by Na+ in the ion-exchange reaction. The structures of the modified dyes are depicted in Fig. S4 (ESI†) according to FTIR spectra and HRMS analysis results.
O in N719 dye, but it tended to disappear in the modified N719 dyes. On the contrary, a band at ca. 1775 cm−1 appeared for the modified N719 dyes and became stronger with increasing the concentration of NaOH. According to the report, this band can be assigned to the stretching vibration of CO in N3 dye.35 These results indicated that the TBA group in N719 dye is progressively removed with increasing concentration of NaOH. On the other hand, the band at ca. 1468 cm−1 appearing in N719 can be assigned to the bending CH2 vibration of TBA. Bands at 1609, 1541 and 1428 cm−1 are assigned to bipyridyl absorption strengthened with replacement of TBA+ by Na+.36 The TBA bands at 1468 and 1428 cm−1 tended to disappear and a strong band at ca. 1450 cm−1 appeared with replacement of TBA+ by Na+. On the other hand, the bands at ca. 880, 786 and 701 cm−1 can be assigned to the bending vibration C–H of the inter-disubstituted aromatic ring. The intensity of these bands increased with increasing concentration of NaOH, indicating that the number of C–H increased. The loss of TBA cations and existence of Na+ in modified N719 were also confirmed by HRMS measurement, and the results are depicted in Fig. S2 (ESI†); Calc. for TBA, M1, M2, M3, M4, M5, M6, M7: m/z 242.5, 475.4, 588.5, 668.5, 701.8, 771.6, 814.9, 960.1. Found: m/z 242.6, 475.8, 588.8, 668.6, 701.8, 771.6, 814.9, 959.8, respectively, with fragment structures shown in Fig. S3 (ESI†). It could be concluded from the results of FTIR and HRMS spectra that TBA cations and H+ of the COOH group of N719 dye were substituted by Na+ in the ion-exchange reaction. The structures of the modified dyes are depicted in Fig. S4 (ESI†) according to FTIR spectra and HRMS analysis results.
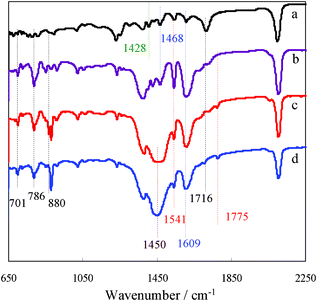 | ||
| Fig. 3 FT-IR spectra of N719 (a) and the modified N719 for the different concentrations of NaOH: (b) 0.3, (c) 0.6 and (d) 0.9 mM. | ||
3.3 Photovoltaic properties of ZnO QDs DSCs
Table 1 lists the photovoltaic properties and the amount of absorbed dye for ZnO QDs-based DSCs. It can be seen that the photovoltaic properties were enhanced using the modified N719 as a sensitizer. When the cell was sensitized by modified 0.6 Na-N719, the efficiency was improved significantly by 85% relative to N719, from 1.59 to 2.94%. In this case, the short-circuit current (Jsc) was increased from 3.11 to 6.36 mA cm−2. This might be the result of less carboxylated (COOH) bipyridyl ligands in the modified N719, inhibiting the formation of chelation between ZnO QDs and dye. On the contrary, the amount of adsorbed dye decreased obviously from 8.6 × 10⁻⁶ to 6.0 × 10⁻⁶ M; this might be attributed to the fact that aggregates of Zn2+/dye on the surface of ZnO QDs can be suppressed. It was reported that aggregates of Zn2+/dye can easily be formed on the surface of ZnO film.37 For the cell sensitized by 0.9 Na-N719, the photovoltaic properties decreased significantly; this might be ascribed to that the carboxylic acid groups in such a modified dye are almost completely removed and the dye can not be adsorbed on the surface of electrode film efficiently. As a reference sample, a mixed dye solution of N719 (0.3 mM) and NaOH (0.6 mM) was also used as sensitizer. It can found from Table 1 that the cell exhibited a poor photovoltaic performance, although the amount of adsorbed dye was larger than that of other cells. In the presence of NaOH, ZnO QDs were dissolved in the mixed dye solution and a large number of Zn2+ were formed. As a result, aggregation of Zn2+/dye occurred to a serious extent and the amount of adsorbed dye was increased significantly. The occurrence of Zn2+/dye aggregation has also been observed in previous reports.14–16,37,38| Dyes | J sc/mA cm−2 | V oc/V | FF | η (%) | M b |
|---|---|---|---|---|---|
| a Sensitization time is 4 h; Open cell with an area of 0.25 cm2. b Amount of adsorbed dye (×10−6 mol L−1). c A physically mixed solution of NaOH (0.6 mM) and N719 (0.3 mM). | |||||
| N719 | 3.11 | 0.64 | 0.72 | 1.59 | 8.6 |
| 0.3 Na-N719 | 4.56 | 0.68 | 0.70 | 1.97 | 7.9 |
| 0.6 Na-N719 | 6.36 | 0.67 | 0.71 | 2.94 | 6.0 |
| 0.9 Na-N719 | 2.64 | 0.67 | 0.51 | 0.90 | 4.4 |
| 0.6 NaOH/N719c | 3.05 | 0.67 | 0.49 | 1.00 | 12.6 |
Fig. 4 shows the relationship between photovoltaic characteristics and the immersion time in the dye solutions of N719 and modified 0.6 Na-N719 for the ZnO QDs cells. As depicted in Fig. 4a, Jsc increased in the initial period, indicating that the amount of adsorbed dye increased with increasing the immersing time, resulting in the generation of a larger Jsc. However, the Jsc decreased seriously when the electrode films were immersed in the dye solution for a longer time. This might be related to the fact that etching on the surface of ZnO occurred and the ability of dye adsorption decreased significantly. It should be pointed out that Jsc tended to decrease for the cell sensitized by the modified 0.6 Na-N719 dye when the immersion time was more than 4 h, while the N719 dye-sensitized solar cell exhibited a highest Jsc for an immersion time of 3 h. This indicates that the etching on the surface of ZnO can be suppressed when the modified 0.6 Na-N719 dye was used as a sensitizer. On the other hand, Voc of two cells increased gradually with immersion time over the first 3 h but then fell off with further increase in time, as shown in Fig. 4b. The variation in Voc with varying immersion time might be contributed to the presence of N719 or the modified dye and Zn2+ aggregates on the surface, causing a reduction in the potential between the ZnO surface and the counter electrode.39 Furthermore, the basic cause for the photovoltage is the change in the electron concentration in the nanocrystalline electron conductor that results from photoinduced charge injection from the dye.40 According to the higher Jsc of the cell sensitized by the modified N719, it might have higher photoinduced charge injection and higher electron concentration. This is favorable for improving Voc of the cells sensitized by the modified dye. As shown in Fig. 4c, the efficiency depended on the immersion time and the cell sensitized by the modified 0.6 Na-N719 dye exhibited a higher efficiency than the N719 dye-sensitized cell. Balancing Jsc and Voc, the optimum immersion time for the modified N719 dye-sensitized solar cell falls at 3–4 h.
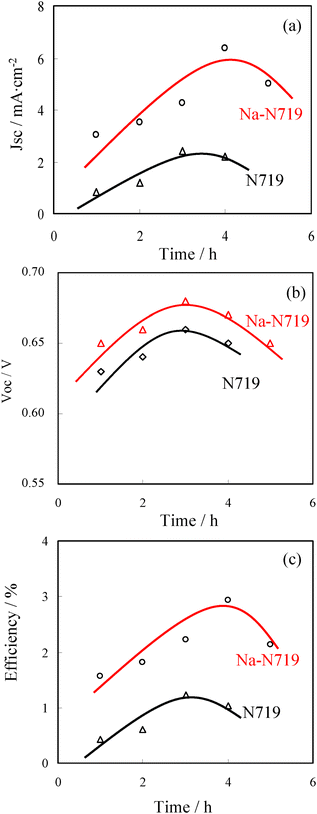 | ||
| Fig. 4 Relationship between the photovoltaic characteristics and immersion times for ZnO QDs DSCs sensitized by N719 and 0.6 Na-N719, respectively: (a) Jsc, (b) Voc, (c) FF and (d) efficiency. The cells were measured under illumination by simulated AM 1.5 solar light (100 mW cm−2). | ||
Fig. 5 shows the I–V characteristics and IPCE spectra for the ZnO QDs-based cells using N719 and modified 0.6 Na-N719 dye as sensitizers. Although the two samples exhibited the Voc values of 0.64 and 0.67 V, respectively, their Jsc values were significantly different, as shown in Fig. 5a. The cell sensitized by the modified N719 exhibited a Jsc of 6.36 mA cm−2, which was much larger than that of the N719 dye-sensitized cell. The efficiency of the former was 2.94% and the latter was only 1.59%. As depicted in Fig. 5b, an IPCE of 31% was obtained for the cell sensitized by the modified 0.6 Na-N719 dye, while the cell sensitized by N719 dye only exhibited an IPCE of 20%. On the other hand, the IPCE spectrum was also broadened when the modified 0.6 Na-N719 was used as a sensitizer. This may be due simply to an absorption increase making the IPCE spectrum show more width. This suggests that the etching of ZnO QDs induced by an acid dye solution was decreased and the aggregation of Zn2+/dye was suppressed, resulting in a significant increase in the light-harvesting efficiency.
 | ||
| Fig. 5 (a) I–V curves and (b) IPCE spectra for the ZnO QDs-based cells sensitized by N719 and modified 0.6 Na-N719 dye for 4 h. (AM 1.5, 100 mW cm−2, cell area = 0.25 cm2, film thickness = 7 μm); (b) IPCE spectra of the cells made of ZnO QDs sensitized by N719 and 0.6 Na-N719 dyes. | ||
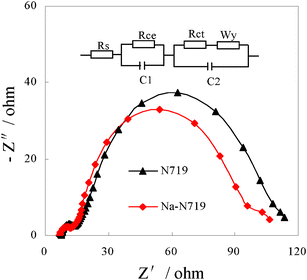
To investigate the electron transport in the photoelectrode film and charge recombination at the interface of the photoelectrode film and electrolyte, the EIS of the cells sensitized by N719 and the modified 0.6 Na-N719 were measured, and the results are shown in Fig. 6, with the equivalent circuit shown in the inset of Fig. 6. Typically, the impedance spectrum of a DSSC shows three semicircles in the frequency range of 20 mHz to 1 MHz. The first, second and third semicircle correspond to the charge transfer resistances at the interfaces of electrode/electrolyte (Rce) and the ZnO/dye/electrolyte (Rct) as well as the Warburg diffusion process of I−/I3− in the electrolyte (Wy), respectively. Fig. 6 shows Nyquist plots of the impedance data for the cells sensitized by N719 and the modified 0.6 Na-N719 dye performed in the dark by applying 5 mV AC-signal amplitude with an applied bias voltage of 0.7 V. The Rce is constant due to the same Pt electrode, while Wy is not obvious due to the overlap with middle circle. It was found Rct decreased slightly from 10.2 to 7.9 Ω when the modified 0.6 Na-N719 dye was used as a sensitizer. This was generally assumed as resulting from recombination becoming more significant between electrons in ZnO QDs and the electrolyte. It was supposed that the introduced Na+ in modified N719 may act as recombination centers, resulted in a decrease of Rct. However, this result is contrary to that expected given the Voc values in Table 1, in which Voc increased using the modified dye as a sensitizer. This may be due to the fact that the increase of Voc photoinduced by the charge injection from the dye was much higher than the decrease of Voc caused by recombination between electrons in ZnO QDs and the electrolyte.
4. Conclusions
In summary, ZnO QDs were successfully synthesized by using a simple synthetic route. These synthesized ZnO QDs have different shapes with highly crystalline nature and their size was found to be ca. 3–5 nm. Furthermore, the synthesized ZnO QDs were used as an electrode material for flexible dye-sensitized solar cells and a best efficiency of 2.94% was achieved for a cell sensitized by a modified N719 dye; this might be attributed to the fact that aggregates of Zn2+/dye on the surface of ZnO QDs can be suppressed efficiently owing to the less carboxylated (COOH) bipyridyl ligand in the modified N719, inhibiting the formation of chelates between ZnO QDs and dye. Therefore, we believe the results presented here provide a new approach for enhancing the photovoltaic properties of ZnO-based DSCs.Acknowledgements
This work was financially supported by the National Natural Science Foundation of China (NSFC 21073039) and Key Laboratory of Novel Thin Film Solar Cells, CAS.References
- B. O' Regan and M. Grätzel, Nature, 1991, 353, 737–740 CrossRef CAS.
- M. Grätzel, Chem. Lett., 2005, 34, 8–13 CrossRef.
- A. Yella, H. W. Lee, H. N.Tsao, C. Yi, A. K. Chandiran, M. K. Nazeeruddin, E. W. Diau, C. Y. Yeh, S. M. Zakeeruddin and M. Grätzel, Science, 2011, 334, 629–634 CrossRef CAS.
- M. K. Nazeeruddin, F. De Angelis, S. Fantacci, A. Selloni, G. Viscardi, P. Liska, S. Ito, B. Takeru and M. Grätzel, J. Am. Chem. Soc., 2005, 127, 16835–16847 CrossRef CAS.
- M. Grätzel, J. Photochem. Photobiol., A, 2004, 164, 3–14 CrossRef.
- Q. F. Zhang, C. S. Dandeneau, X. Y. Zhou and G. Z. Cao, Adv. Mater., 2009, 21, 4087–4108 CrossRef CAS.
- M. D. Wei, Z. M. Qi, M. Ichihara and H. S. Zhou, Acta Mater., 2008, 56, 2488–2494 CrossRef CAS.
- B. X. Lei, J. Y. Liao, R. Zhang, J. Wang, C. Y. Su and D. B. Kuang, J. Phys. Chem. C, 2010, 114, 15228–15233 CAS.
- H. D. Zheng Y. Tachibana and K. Kalantar-Zadeh, Langmuir, 2010, 26, 19148–19152 CrossRef.
- L. H. Huang, L. L. Jiang and M. D. Wei, Electrochem. Commun., 2010, 12, 319–322 CrossRef CAS.
- K. H. Yu and J. H. Chen, Nanoscale Res. Lett., 2009, 4, 1–10 CrossRef CAS.
- K. Keis, C. Bauer, G. Boschloo, A. Hagfeldt, K. Westermark, H. Rensmo and H. J. Siegbahn, J. Photochem. Photobiol., A, 2002, 148, 57–64 CrossRef CAS.
- I. Bedja, P. V. Kamat, X. Hua, A. G. Lappin and S. Hotchandani, Langmuir, 1997, 13, 2398–2403 CrossRef CAS.
- K. Westermark, H. Rensmo, H. Siegbahn, K. Keis, A. Hagfeldt, L. Ojamae and P. Persson, J. Phys. Chem. B, 2002, 106, 10102–10107 CrossRef CAS.
- H. Horiuchi, R. Katoh, K. Hara, M. Yanagida, S. Murata, H. Arakawa and M. Tachiya, J. Phys. Chem. B, 2003, 107, 2570–2574 CrossRef CAS.
- R. Baumeler, P. Rys and H. Zollingen, Helv. Chim. Acta, 1973, 56, 2450–2460 CrossRef CAS.
- F. P. Yan, L. H. Huang, J. S. Zheng, J. Huang, Z. Lin, F. Huang and M. D.Wei, Langmuir, 2010, 26, 7153–7156 CrossRef CAS.
- W. J. Lee, A. Suzuki, K. Imaeda, H. Okada, A. Wakahara and A. Yoshida, Jpn. J. Appl. Phys., 2004, 43, 152–155 CrossRef CAS.
- A. Otsuka, K. Funabiki, N. Sugiyama, T. Yoshida, M. Minoura and M. Matsui, Chem. Lett., 2006, 35, 666–667 CrossRef CAS.
- L. Y. Zeng, S. Y. Dai, W. W. Xu and K. J.Wang, Plasma Sci. Technol., 2006, 8, 172–175 CrossRef CAS.
- K. Keis, E. Magnusson, H. Lindstrom, S. E. Lindquist and A. Hagfeldt, Sol. Energy Mater. Sol. Cells, 2002, 73, 51–58 CrossRef.
- A. B. F. Martinson, J. W. Elam, J. T. Hupp and M. J.Pellin, Nano Lett., 2007, 7, 2183–2187 CrossRef CAS.
- E. Galoppini and J. Rochford, J. Phys. Chem. B, 2006, 110, 16159–16161 CrossRef CAS.
- A. Belaidi, T. Dittrich, D. Kievena, J. Tornowa, K. Schwarzburga, M. Kunsta, N. Allsopa, M. C. Lux-Steinera and S. Gavrilov, Sol. Energy Mater. Sol. Cells, 2009, 93, 1033–1036 CrossRef CAS.
- M. Guo, P. Diao and S. M. Cai, Chin. Chem. Lett., 2004, 15, 1113–1116 CAS.
- M. Law, L. E. Greene, A. Radenovic, T. Kuykendall, J. Liphardt and P. J. Yang, J. Phys. Chem. B, 2006, 110, 22652–22663 CrossRef CAS.
- T. P. Chou, Q. Zhang, G. E. Fryxell and G. Cao, Adv. Mater., 2007, 19, 2588–2592 CrossRef CAS.
- A. Umar, Nanoscale Res. Lett., 2009, 4, 1004–1008 CrossRef CAS.
- M. Renata, W. Fabian, A. Rameez, L. Volodymyr, M. G. Dirk and P. Wolfgang, Langmuir, 2011, 27, 3920–3929 CrossRef.
- L. Y. Zhang, L. W. Yin, C. X. Wang, N. Lun and Y. X. Qi, ACS Appl. Mater. Interfaces, 2010, 2, 1769–1773 CAS.
- R. Marczak, F. Werner, J. F. Gnichwitz, A. Hirsch, D. M. Guldi and W. Peukert, J. Phys. Chem. C, 2009, 113, 4669–4678 CAS.
- Z. P. Fu, Z. Wang, B. F. Yang, Y. L. Yang, H. W. Yan and L. S. Xia, Mater. Lett., 2007, 61, 4832–4835 CrossRef CAS.
- E. S. Jang, J. H. Won, S. J. Hwang and J. H. Choy, Adv. Mater., 2006, 18, 3309–3312 CrossRef CAS.
- S. Sakohara and M. Ishida, J. Phys. Chem. B, 1998, 102, 10169–10175 CrossRef CAS.
- M. K. Nazeeruddin, R. Humphry-Baker, P. Liska and M. Grätzel, J. Phys. Chem. B, 2003, 107, 8981–8987 CrossRef CAS.
- K. S. Finnie, J. R. Bartlett and J. L. Woolfrey, Langmuir, 1998, 14, 2744–2749 CrossRef CAS.
- K. Keis, J. Lindgren, S. E. Lindquist and A. Hagfeldt, Langmuir, 2000, 16, 4688–4694 CrossRef CAS.
- G. Redmond, D. Fitzmaurice and M. Grätzel, Chem. Mater., 1994, 6, 686–691 CrossRef CAS.
- M. Yanagida, T. Yamaguchi, M. Kurashige, K. Hara, R. Katoh, H. Sugahara and H. Arakawa, Inorg. Chem., 2003, 42, 7921–7931 CrossRef CAS.
- D. Cahen, G. Hodes, M. Grätzel, J. F. Guillemoles and I. Riess, J. Phys. Chem. B, 2000, 104, 2053–2059 CrossRef CAS.
Footnote |
| † Electronic supplementary information (ESI) available. See DOI: 10.1039/c2ra21144k |
| This journal is © The Royal Society of Chemistry 2012 |