ESIPT based dual fluorescent sensor and concentration dependent reconfigurable boolean operators†
Vijay
Luxami
*a and
Subodh
Kumar
b
aSchool of Chemistry and Biochemistry, Thapar University, Patiala-147004, India. E-mail: vj_luxami@yahoo.co.in
bDepartment of Chemistry, UGC Center for Advanced Studies, Guru Nanak Dev University, Amritsar - 143 005, India
First published on 13th July 2012
Abstract
Probes 1 and 2 (CH3CN–H2O; 4![[thin space (1/6-em)]](https://www.rsc.org/images/entities/char_2009.gif) :
:![[thin space (1/6-em)]](https://www.rsc.org/images/entities/char_2009.gif) 1) at pH 7.0 ± 0.1 (10 mM, HEPES) selectively bind with Zn2+ ions and give a new emission band at 490 nm. These can estimate 20 nM Zn2+ ions as the lowest detection limit. The determination of Zn2+ ions by probe 1 is not interfered by the presence of other metal ions viz. Na+, K+, Mg2+, Ca2+, Sr2+, Fe2+, Co2+, Ni2+, Cd2+, Ag+, Hg2+. However, in the case of probe 2 Cu2+ causes only the fluorescence quenching. In acetonitrile, the addition of different concentrations of Cu2+ (2 μM, 5 μM, 10 μM) and a fixed amount of F− (25 μM) to a solution of 2 (0.25 μM, CH3CN) elaborates Cu2+ ion concentration dependent NOR, INH and AND Boolean operators with three distinct emission channels at 585, 515 and 400 nm, respectively.
1) at pH 7.0 ± 0.1 (10 mM, HEPES) selectively bind with Zn2+ ions and give a new emission band at 490 nm. These can estimate 20 nM Zn2+ ions as the lowest detection limit. The determination of Zn2+ ions by probe 1 is not interfered by the presence of other metal ions viz. Na+, K+, Mg2+, Ca2+, Sr2+, Fe2+, Co2+, Ni2+, Cd2+, Ag+, Hg2+. However, in the case of probe 2 Cu2+ causes only the fluorescence quenching. In acetonitrile, the addition of different concentrations of Cu2+ (2 μM, 5 μM, 10 μM) and a fixed amount of F− (25 μM) to a solution of 2 (0.25 μM, CH3CN) elaborates Cu2+ ion concentration dependent NOR, INH and AND Boolean operators with three distinct emission channels at 585, 515 and 400 nm, respectively.
1. Introduction
Fluorescent detection systems are attracting a great deal of interest due to their capabilities to sense 1 various chemically, environmentally, and biologically significant species and their potential applications as molecular switches/devices in information processing.2 Diverse fluorescent-sensing approaches have been extensively investigated, including internal charge transfer3 (ICT), photoinduced electron transfer4 (PET), metal-ligand charge transfer5 (MLCT), excimer/exciplex formation etc. for getting cation and anion recognition. Amongst these fluorescence phenomena the excited state intramolecular proton transfer (ESIPT) has attained a special status due to vast applications as laser dyes,6 UV-photostabilizer,7 scintillators,8 membrane9 and protein probes10 and as a potential component for photoswitches and organic LEDs.11 ESIPT usually takes place in the molecules bearing an H-bond donor group usually a phenolic/amino moiety associated with basic site (O, N) in the ground state through H-bond interactions.12 This covalently attached proton in the electronically excited state migrates to a neighbouring hydrogen-bonded atom which is less than 2 Å away. The significant amount of excited state energy is dissipated in this process. The formed phototautomer emits light at a lower energy with an unusually large Stokes shift (range from 100 to 500 nm) and thermally equilibrates back to the ground state with the proton bound to its original atom.Therefore, ESIPT molecules show two emission channels—one due to normal emission (enol form) from the first excited state and characterized by an emission band with small Stokes shift and the second due to emission from stabilized excited state (keto form) via ESIPT, characterized by the large Stokes shift. The ESIPT molecules have the advantage of wide range emission where different emission colours can be balanced by the addition of different analytes due to this dual emission.13a At least in principle, the stimuli induced bathochromic or hypsochromic shift of these normal and ESIPT based emission channels can further open new emission channels and can thus provide an opportunity for simultaneous sensing of multiple analytes.13b,13c
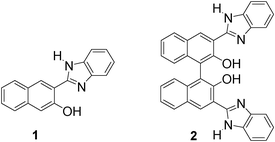
Here we report that the Zn2+ induced fluorescence signal by probes 1 and 214 under aqueous conditions provides an opportunity for selective ratiometric sensing of 100 nM – 1.3 μM and 20–1000 nM of Zn2+ ions, respectively. Other metal ions, viz. Na+, K+, Mg2+, Ca2+, Sr2+, Fe3+, Cd2+, Co2+, Ni2+, Cd2+, Ag+, Hg2+ do not interfere with Zn2+ estimation. Probe 2 in the presence of Cu2+ ions undergoes the quenching of ESIPT emission due to a strong paramagnetic effect, but the presence of a fluoride ion with Cu2+ opens new emission channels for elaboration of boolean operators, viz. NOR, INH and AND, depending on Cu2+ concentration. The Boolean operators based on the concentration of protons are well documented.15 To the best of our knowledge, it is the first Cu2+ concentration dependent Boolean operator. The differential behaviour of probe 2 towards analytes has been corroborated using theoretical calculations.
2. Photophysical behaviour of 1 and 2 towards metal ions
2.1 Effect of metal ions on the absorbance properties of probes 1 and 2
A solution of 1 (20 μM, CH3CN![[thin space (1/6-em)]](https://www.rsc.org/images/entities/char_2009.gif) :
:![[thin space (1/6-em)]](https://www.rsc.org/images/entities/char_2009.gif) H2O 4
H2O 4![[thin space (1/6-em)]](https://www.rsc.org/images/entities/char_2009.gif) :
:![[thin space (1/6-em)]](https://www.rsc.org/images/entities/char_2009.gif) 1, v
1, v![[thin space (1/6-em)]](https://www.rsc.org/images/entities/char_2009.gif) :
:![[thin space (1/6-em)]](https://www.rsc.org/images/entities/char_2009.gif) v), on addition of Cu2+ or Zn2+ ions showed a gradual increase in absorbance at λmax 292, 346 and 415 nm with concomitant appearance of a new absorption band between 400–440 nm attributed to a visible color change from colourless to yellow (Fig. SI–1 and SI–2).†
v), on addition of Cu2+ or Zn2+ ions showed a gradual increase in absorbance at λmax 292, 346 and 415 nm with concomitant appearance of a new absorption band between 400–440 nm attributed to a visible color change from colourless to yellow (Fig. SI–1 and SI–2).†
The intensity of absorbance at λmax 415 nm increased gradually with the increase in concentration of Cu2+ or Zn2+ ions and achieved a plateau after a certain concentration. These small but distinct gradual changes in the spectrum of 1, on addition of Cu2+ or Zn2+ ions, show the formation of 1![[thin space (1/6-em)]](https://www.rsc.org/images/entities/char_2009.gif) :
:![[thin space (1/6-em)]](https://www.rsc.org/images/entities/char_2009.gif) 1 stoichiometric complexes with log βCu2+L = 4.03 ± 0.4 and log βZn2+L = 4.53 ± 0.4 using the Specfit 32 multianalysis programme.
1 stoichiometric complexes with log βCu2+L = 4.03 ± 0.4 and log βZn2+L = 4.53 ± 0.4 using the Specfit 32 multianalysis programme.
In the case of probe 2 (10 μM) at pH 7.0 ± 0.1 (CH3CN![[thin space (1/6-em)]](https://www.rsc.org/images/entities/char_2009.gif) :
:![[thin space (1/6-em)]](https://www.rsc.org/images/entities/char_2009.gif) HEPES buffer 4
HEPES buffer 4![[thin space (1/6-em)]](https://www.rsc.org/images/entities/char_2009.gif) :
:![[thin space (1/6-em)]](https://www.rsc.org/images/entities/char_2009.gif) 1, v
1, v![[thin space (1/6-em)]](https://www.rsc.org/images/entities/char_2009.gif) :
:![[thin space (1/6-em)]](https://www.rsc.org/images/entities/char_2009.gif) v) on addition of Na+, K+, Mg2+, Ca2+, Sr2+, Fe2+, Co2+, Ni2+, Ag+, Hg2+ and Cd2+ metal ions did not cause any significant change in its absorption properties but on addition of Cu2+ and Zn2+ showed a distinct color change from colorless to yellow and the emergence of a new peak at λmax 430 nm. The incremental addition of Zn2+ and Cu2+ ions to the solution of probe 2 (10 μM) at pH 7.0 ± 0.1 (10 mM HEPES in CH3CN
v) on addition of Na+, K+, Mg2+, Ca2+, Sr2+, Fe2+, Co2+, Ni2+, Ag+, Hg2+ and Cd2+ metal ions did not cause any significant change in its absorption properties but on addition of Cu2+ and Zn2+ showed a distinct color change from colorless to yellow and the emergence of a new peak at λmax 430 nm. The incremental addition of Zn2+ and Cu2+ ions to the solution of probe 2 (10 μM) at pH 7.0 ± 0.1 (10 mM HEPES in CH3CN![[thin space (1/6-em)]](https://www.rsc.org/images/entities/char_2009.gif) :
:![[thin space (1/6-em)]](https://www.rsc.org/images/entities/char_2009.gif) H2O 4
H2O 4![[thin space (1/6-em)]](https://www.rsc.org/images/entities/char_2009.gif) :
:![[thin space (1/6-em)]](https://www.rsc.org/images/entities/char_2009.gif) 1, v
1, v![[thin space (1/6-em)]](https://www.rsc.org/images/entities/char_2009.gif) :
:![[thin space (1/6-em)]](https://www.rsc.org/images/entities/char_2009.gif) v) showed a decrease in the absorption intensity at λmax 292, 315, 332 and 375 nm with concomitant increase in the absorption intensity at λmax 430 nm with isobestic points at 400, 345 and 300 nm. The presence of isobestic points shows that different species are in equilibrium and there is no stepwise formation of the complexed species. The spectral fitting of these absorbance data shows the formation of 1
v) showed a decrease in the absorption intensity at λmax 292, 315, 332 and 375 nm with concomitant increase in the absorption intensity at λmax 430 nm with isobestic points at 400, 345 and 300 nm. The presence of isobestic points shows that different species are in equilibrium and there is no stepwise formation of the complexed species. The spectral fitting of these absorbance data shows the formation of 1![[thin space (1/6-em)]](https://www.rsc.org/images/entities/char_2009.gif) :
:![[thin space (1/6-em)]](https://www.rsc.org/images/entities/char_2009.gif) 1 (2
1 (2![[thin space (1/6-em)]](https://www.rsc.org/images/entities/char_2009.gif) :
:![[thin space (1/6-em)]](https://www.rsc.org/images/entities/char_2009.gif) M2+) stoichiometric complexes with logβML = 6.1 ± 0.6 for Zn2+ and logβML = 5.7 ± 0.4 for Cu2+ complexes (Fig. 1 and 2). The difference in logβ values shows that 2 binds Zn2+ nearly 2.51 times more strongly than Cu2+ ions.
M2+) stoichiometric complexes with logβML = 6.1 ± 0.6 for Zn2+ and logβML = 5.7 ± 0.4 for Cu2+ complexes (Fig. 1 and 2). The difference in logβ values shows that 2 binds Zn2+ nearly 2.51 times more strongly than Cu2+ ions.
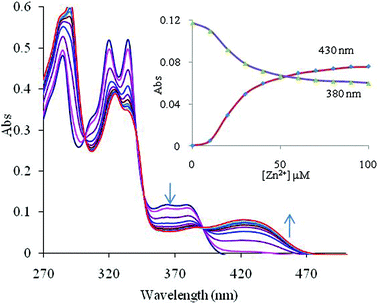 | ||
Fig. 1 Effect of the incremental addition of Zn2+ ions on the absorption spectrum of 2 (10 μM) at pH 7.0 ± 0.1 (10 mM HEPES in CH3CN![[thin space (1/6-em)]](https://www.rsc.org/images/entities/char_2009.gif) : :![[thin space (1/6-em)]](https://www.rsc.org/images/entities/char_2009.gif) H2O 4 H2O 4![[thin space (1/6-em)]](https://www.rsc.org/images/entities/char_2009.gif) : :![[thin space (1/6-em)]](https://www.rsc.org/images/entities/char_2009.gif) 1, v 1, v![[thin space (1/6-em)]](https://www.rsc.org/images/entities/char_2009.gif) : :![[thin space (1/6-em)]](https://www.rsc.org/images/entities/char_2009.gif) v). The inset shows spectral fitting of the absorbance data at 380 and 430 nm for chemosensor 2 on addition of different concentrations of Zn2+ ions (the points are experimental values, the line shows the curve fitting). v). The inset shows spectral fitting of the absorbance data at 380 and 430 nm for chemosensor 2 on addition of different concentrations of Zn2+ ions (the points are experimental values, the line shows the curve fitting). | ||
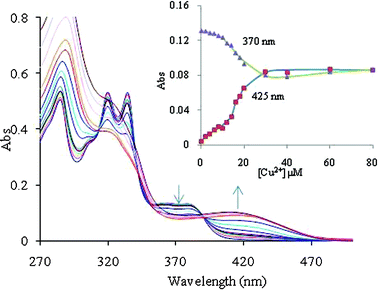 | ||
Fig. 2 The effect of an incremental addition of Cu2+ ions on the absorption spectrum of 2 (10 μM) at pH 7.0 ± 0.1 (10 mM HEPES in CH3CN![[thin space (1/6-em)]](https://www.rsc.org/images/entities/char_2009.gif) : :![[thin space (1/6-em)]](https://www.rsc.org/images/entities/char_2009.gif) H2O 4 H2O 4![[thin space (1/6-em)]](https://www.rsc.org/images/entities/char_2009.gif) : :![[thin space (1/6-em)]](https://www.rsc.org/images/entities/char_2009.gif) 1, v 1, v![[thin space (1/6-em)]](https://www.rsc.org/images/entities/char_2009.gif) : :![[thin space (1/6-em)]](https://www.rsc.org/images/entities/char_2009.gif) v). The inset shows spectral fitting of the absorbance data at 370 nm and 425 nm for chemosensor 2 on addition of different concentrations of Cu2+ ions (the points are experimental values, the line shows the curve fitting). v). The inset shows spectral fitting of the absorbance data at 370 nm and 425 nm for chemosensor 2 on addition of different concentrations of Cu2+ ions (the points are experimental values, the line shows the curve fitting). | ||
2.2 Effect of metal ions on the fluorescence properties of probes 1 and 2
The addition of different metal ions, viz. Na+, K+, Mg2+, Ca2+, Sr2+, Fe2+, Co2+, Ni2+, Cu2+, Cd2+, Ag+ and Hg2+, to the solution of fluorophore 1 (0.5 μM, λex = 330 nm) at pH 7.0 ± 0.1 (CH3CN![[thin space (1/6-em)]](https://www.rsc.org/images/entities/char_2009.gif) :
:![[thin space (1/6-em)]](https://www.rsc.org/images/entities/char_2009.gif) HEPES buffer 4
HEPES buffer 4![[thin space (1/6-em)]](https://www.rsc.org/images/entities/char_2009.gif) :
:![[thin space (1/6-em)]](https://www.rsc.org/images/entities/char_2009.gif) 1, v
1, v![[thin space (1/6-em)]](https://www.rsc.org/images/entities/char_2009.gif) :
:![[thin space (1/6-em)]](https://www.rsc.org/images/entities/char_2009.gif) v) did not induce any significant change in its emission. However, on addition of Zn2+ to the solution of probe 1, the normal emission band at 390 nm underwent decrease in the emission intensity along with an increase in the intensity at 480 nm with an isobestic point at 400 nm and achieved a plateau with the addition of 5 μM (10 equiv.) of Zn2+ ions. The spectral fitting of these data shows the formation of ML (logβML = 5.3 ± 0.03) complex (Fig. 3a, S3†). The ratio of emission intensities varies from 0.12–6 on gradual addition of Zn2+ ions, indicating a 50-fold emission ratio change. Probe 1 can be used for ratiometric estimation of Zn2+ ions16 between 100 nM – 6 μM and other metal ions do not interfere with the estimation of Zn2+ ions (Fig. 3b).
v) did not induce any significant change in its emission. However, on addition of Zn2+ to the solution of probe 1, the normal emission band at 390 nm underwent decrease in the emission intensity along with an increase in the intensity at 480 nm with an isobestic point at 400 nm and achieved a plateau with the addition of 5 μM (10 equiv.) of Zn2+ ions. The spectral fitting of these data shows the formation of ML (logβML = 5.3 ± 0.03) complex (Fig. 3a, S3†). The ratio of emission intensities varies from 0.12–6 on gradual addition of Zn2+ ions, indicating a 50-fold emission ratio change. Probe 1 can be used for ratiometric estimation of Zn2+ ions16 between 100 nM – 6 μM and other metal ions do not interfere with the estimation of Zn2+ ions (Fig. 3b).
![(a) Effect of incremental addition of Zn2+ on the fluorescence spectrum. (b) Plot of the fluorescence intensity ratio between 480 and 390 nm (FI480/FI390) vs. [Zn2+] ions (inset shows a ratiometric emission response of 1 to different metals ions 0.5 μM) of fluorophore 1 at pH 7.0 ± 0.1 (10 mM HEPES in CH3CN : H2O 4 : 1, v : v).](/image/article/2012/RA/c2ra21170j/c2ra21170j-f3.gif) | ||
Fig. 3 (a) Effect of incremental addition of Zn2+ on the fluorescence spectrum. (b) Plot of the fluorescence intensity ratio between 480 and 390 nm (FI480/FI390) vs. [Zn2+] ions (inset shows a ratiometric emission response of 1 to different metals ions 0.5 μM) of fluorophore 1 at pH 7.0 ± 0.1 (10 mM HEPES in CH3CN![[thin space (1/6-em)]](https://www.rsc.org/images/entities/char_2009.gif) : :![[thin space (1/6-em)]](https://www.rsc.org/images/entities/char_2009.gif) H2O 4 H2O 4![[thin space (1/6-em)]](https://www.rsc.org/images/entities/char_2009.gif) : :![[thin space (1/6-em)]](https://www.rsc.org/images/entities/char_2009.gif) 1, v 1, v![[thin space (1/6-em)]](https://www.rsc.org/images/entities/char_2009.gif) : :![[thin space (1/6-em)]](https://www.rsc.org/images/entities/char_2009.gif) v). v). | ||
Probe 2 (0.1 μM, λex 330) at pH 7.0 ± 0.1 (10 mM HEPES in CH3CN![[thin space (1/6-em)]](https://www.rsc.org/images/entities/char_2009.gif) :
:![[thin space (1/6-em)]](https://www.rsc.org/images/entities/char_2009.gif) H2O 4
H2O 4![[thin space (1/6-em)]](https://www.rsc.org/images/entities/char_2009.gif) :
:![[thin space (1/6-em)]](https://www.rsc.org/images/entities/char_2009.gif) 1, v
1, v![[thin space (1/6-em)]](https://www.rsc.org/images/entities/char_2009.gif) :
:![[thin space (1/6-em)]](https://www.rsc.org/images/entities/char_2009.gif) v) on addition of Zn2+ showed the formation of a new emission band at 480 nm. The addition of other metal ions viz. Na+, K+, Mg2+, Ca2+, Sr2+, Fe2+, Co2+, Ni2+, Cu2+, Cd2+, Ag+ and Hg2+ did not cause any change in the fluorescence of probe 2 except for Cu2+ which led to the fluorescence quenching of the ESIPT band.
v) on addition of Zn2+ showed the formation of a new emission band at 480 nm. The addition of other metal ions viz. Na+, K+, Mg2+, Ca2+, Sr2+, Fe2+, Co2+, Ni2+, Cu2+, Cd2+, Ag+ and Hg2+ did not cause any change in the fluorescence of probe 2 except for Cu2+ which led to the fluorescence quenching of the ESIPT band.
On gradual addition of Zn2+ ions to the solution of fluorophore 2 (0.1 μM, λex 330) at pH 7.0 ± 0.1 (10 mM HEPES in CH3CN![[thin space (1/6-em)]](https://www.rsc.org/images/entities/char_2009.gif) :
:![[thin space (1/6-em)]](https://www.rsc.org/images/entities/char_2009.gif) H2O 4
H2O 4![[thin space (1/6-em)]](https://www.rsc.org/images/entities/char_2009.gif) :
:![[thin space (1/6-em)]](https://www.rsc.org/images/entities/char_2009.gif) 1, v
1, v![[thin space (1/6-em)]](https://www.rsc.org/images/entities/char_2009.gif) :
:![[thin space (1/6-em)]](https://www.rsc.org/images/entities/char_2009.gif) v), the emission intensity at λmax 585 nm was quenched with concomitant formation of a hypsochromically shifted (Δλ = 105 nm) new emission band at 480 nm which achieved a plateau with the addition of 1 equiv. of Zn2+ ions. The spectral fitting of these data shows the formation of ML with logβML = 6.2 + 0.4 (Fig. 4a). The ratio of emission intensities varies from 0.19–7.75 on gradual additions of Zn2+ ions, indicating a 41-fold change in the emission ratio. Probe 2 can be used for estimation of Zn2+ ions between 20–1000 nM and other metal ions do not interfere in the estimation of Zn2+ ions (Fig. 4b).
v), the emission intensity at λmax 585 nm was quenched with concomitant formation of a hypsochromically shifted (Δλ = 105 nm) new emission band at 480 nm which achieved a plateau with the addition of 1 equiv. of Zn2+ ions. The spectral fitting of these data shows the formation of ML with logβML = 6.2 + 0.4 (Fig. 4a). The ratio of emission intensities varies from 0.19–7.75 on gradual additions of Zn2+ ions, indicating a 41-fold change in the emission ratio. Probe 2 can be used for estimation of Zn2+ ions between 20–1000 nM and other metal ions do not interfere in the estimation of Zn2+ ions (Fig. 4b).
![(a) Effect of incremental addition of Zn2+ on the fluorescence spectrum (the inset shows spectral fitting of the fluorescence data at 480 and 585 nm). (b) Plot of fluorescence intensity ratio (FI480/FI585) vs. [Zn2+] ions (the inset shows the ratiometric emission response of 2 to different metals ions).](/image/article/2012/RA/c2ra21170j/c2ra21170j-f4.gif) | ||
| Fig. 4 (a) Effect of incremental addition of Zn2+ on the fluorescence spectrum (the inset shows spectral fitting of the fluorescence data at 480 and 585 nm). (b) Plot of fluorescence intensity ratio (FI480/FI585) vs. [Zn2+] ions (the inset shows the ratiometric emission response of 2 to different metals ions). | ||
On gradual addition of Cu2+ ions to the solution of fluorophore 2 (0.1 μM, λex 330) at pH 7.0 ± 0.1 (10 mM HEPES in CH3CN![[thin space (1/6-em)]](https://www.rsc.org/images/entities/char_2009.gif) :
:![[thin space (1/6-em)]](https://www.rsc.org/images/entities/char_2009.gif) H2O 4
H2O 4![[thin space (1/6-em)]](https://www.rsc.org/images/entities/char_2009.gif) :
:![[thin space (1/6-em)]](https://www.rsc.org/images/entities/char_2009.gif) 1, v
1, v![[thin space (1/6-em)]](https://www.rsc.org/images/entities/char_2009.gif) :
:![[thin space (1/6-em)]](https://www.rsc.org/images/entities/char_2009.gif) v), the emission intensity at λmax 585 was quenched. In order to monitor the proper quenching effect on addition of Cu2+ ions, the initial concentration of probe 2 was taken as 1 μM. So, the addition of Cu2+ ions (10 μM) to the solution of probe 2 (1 μM, λex 330) caused the 82% quenching of the probe and achieved a plateau with 10 μM of Cu2+ ions. The spectral fitting of these data shows the formation of ML complex with logβML = 5.0 ± 0.25 (Fig. 5).
v), the emission intensity at λmax 585 was quenched. In order to monitor the proper quenching effect on addition of Cu2+ ions, the initial concentration of probe 2 was taken as 1 μM. So, the addition of Cu2+ ions (10 μM) to the solution of probe 2 (1 μM, λex 330) caused the 82% quenching of the probe and achieved a plateau with 10 μM of Cu2+ ions. The spectral fitting of these data shows the formation of ML complex with logβML = 5.0 ± 0.25 (Fig. 5).
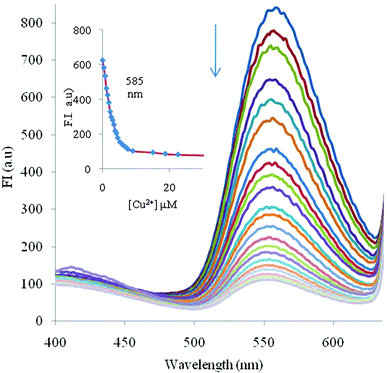 | ||
Fig. 5 Effect of incremental addition of Cu2+ on the fluorescence spectrum of fluorophore 2 (1 μM) at pH 7.0 ± 0.1 (10 mM HEPES in CH3CN![[thin space (1/6-em)]](https://www.rsc.org/images/entities/char_2009.gif) : :![[thin space (1/6-em)]](https://www.rsc.org/images/entities/char_2009.gif) H2O 4 H2O 4![[thin space (1/6-em)]](https://www.rsc.org/images/entities/char_2009.gif) : :![[thin space (1/6-em)]](https://www.rsc.org/images/entities/char_2009.gif) 1, v 1, v![[thin space (1/6-em)]](https://www.rsc.org/images/entities/char_2009.gif) : :![[thin space (1/6-em)]](https://www.rsc.org/images/entities/char_2009.gif) v). The inset shows spectral fitting of the fluorescence data at 585 nm for chemosensor 2 on addition of different concentrations of Cu2+ ions (the points are experimental values, the line shows the curve fitting). v). The inset shows spectral fitting of the fluorescence data at 585 nm for chemosensor 2 on addition of different concentrations of Cu2+ ions (the points are experimental values, the line shows the curve fitting). | ||
Thus, probe 1 shows a nearly 50 times increase in the ratio of fluorescence I390/I480 and can be used to estimate 0.1 μM to 6 μM of Zn2+ whereas probe 2 shows a nearly 41 times increase in ratio of intensity at 585 and 480 nm (I480/I585) and can be used to estimate 20 nM to 1000 nM of Zn2+.
The probes 1 and 2 contain an intramolecular hydrogen bond between the phenolic O–H and N– of the benzimidazole ring that undergoes ESIPT and yields normal and ESIPT emissions. The coordination of Zn2+ removes the phenolic protons which disrupts the ESIPT emission at 585 nm and exhibit increase in the fluorescence emission intensity at 480–490 nm designated to the ICT normal emission mechanism. Zn2+ has closed shell d-orbitals so that the energy or the charge transfer processes cannot take place. However, in probe 2, the co-operativity of two benzimidazole units enhances coordination with paramagnetic Cu2+ and completely quenches the fluorescence emission at 585 nm. The quenching as a result of addition of Cu2+ suggests that an excitation energy or charge transfer may have occurred from 2 to the open shell d-orbital of Cu2+ exhibiting a very fast and efficient nonradiative decay16e of excited states of probe 2. This differential behaviour of the two metals has further been evaluated using theoretical calculations.
2.3 Reconfigureable logic functions
The reconfiguration of the emission channel by changing the inputs has found applications in elaboration of multiple logic gates within a single molecule. However, reconfiguring the emission channels and thus logic gates by altering the concentration of the inputs are unprecedented. As reported earlier, probe 2 (CH3CN) selectively binds with the fluoride ions14a amongst other anions, viz. . Cl−, Br−, I−, NO3−, CH3COO−, HSO4−, H2PO4− and ClO4−, and gave a new emission band at 515 nm. Probe 2 in combination with altering the concentration of the inputs (viz. metal ions and anions) exhibits Boolean operations that can be reconfigured into different combinations of logic gates. The appearance of different emission channels at distinctly different wavelengths permits them to be read simultaneously.Probe 2 (0.5 μM, CH3CN) on addition of fluoride ions at different concentrations shows “ON-OFF” (λmax 585 nm, [F−] = 2 μM) and “ON-OFF-ON” (λmax 585 to 515 nm, [F−] = 25 μM) process and on addition of Cu2+ (2 μM) shows “ON-OFF” phenomenon at 585 nm is observed. Therefore, addition of 2 μM fluoride ions provides only NOT gate at 585 nm which on increasing the concentration of fluoride ions to 25 μM is reconfigured to a YES and NOT combination with respective emission channels at 515 and 585 nm. These F− ion-based outputs from probe 2 are further modulated by adding different amounts of Cu2+ ions, and they enable the elaboration of NOR, INHIBIT and AND Boolean operations (Fig. 6a). The emission maxima of probe 2 (0.5 μM, CH3CN) at 585 nm is completely quenched by the addition of either Cu2+ (2 μM) or F− (25 μM) ions and also in the presence of both it remains in the OFF state. This state provides the opportunity for elaboration of NOR logic function (Fig. 6b).
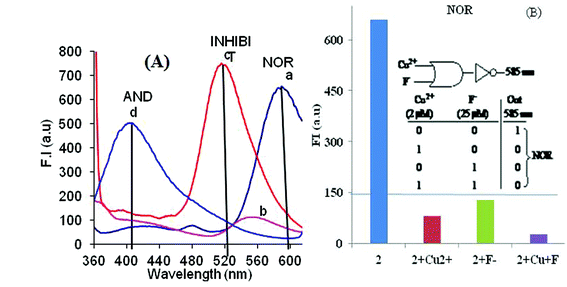 | ||
| Fig. 6 (A) Fluorescence conditions (a) 2 (0.5 μM, CH3CN only; (b) 2 + Cu2+ (2 μM); (c) 2 + F− (25 μM); (d) 2 + Cu2+ (10 μM) + F− (25 μM). (B) The bar diagram for the elaboration of NOR logic gate at λem 585 nm shows threshold values and its inset shows the truth table and notation for the elaboration of NOR logic gate. | ||
The emission of 2 in the presence of F− ions (25 μM) appears at 515 nm and is inhibited by the addition of 5 μM Cu2+. The emission at 515 nm is in the ON state only in the presence of F− ions and in all other circumstances is in OFF state. So, emission at 515 nm can be used for the elaboration of INHIBIT logic operation (Fig. 7a). Further, on increasing the concentration of Cu2+ to 10 μM in the presence of 25 μm of F− ions, the emergence of a new emission band at 400 nm takes place. This emission channel does not open when either Cu2+ or F− is present individually, but the simultaneous presence of both inputs opens an emission channel at 400 nm. This situation provides the opportunity for elaboration of AND Boolean logic function (Fig. 7b).
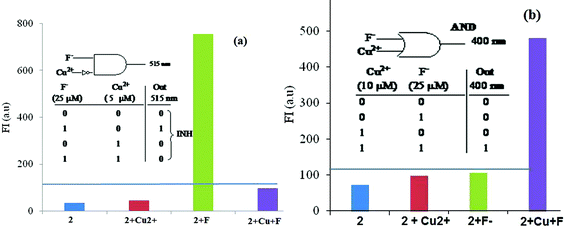 | ||
| Fig. 7 The bar diagram for the elaboration of (a) INHIBIT logic gate at λem 515 nm; (b) AND logic gate at λem 400 nm and the horizontal line shows the threshold values. The inset shows the truth table and a notation for the elaboration of respective logic gates. | ||
Thus, by using three different concentrations of Cu2+ in the presence of 25 μM of fluoride ions and 0.5 μM of probe 2, three different emission channels of logic gates are activated. At 2 μM [Cu2+] only NOR gate exists at 585 nm; at 5 μM [Cu2+] both NOR (585 nm) and INHIBIT (515 nm) Boolean operations become active and at 10 μM [Cu2+] along with NOR (585 nm) and INH (515 nm) operations, an additional emission channel at 400 nm representing AND logic operation emerges (Fig. 8). It is noteworthy that the elaborations of three logic operations are independent of the inputs (Cu2+ and F− ions) sequence.
 | ||
| Fig. 8 Presence of different logic functions on addition of different concentrations of Cu2+ ions to the solution of 2 in CH3CN at F− (25 μM). | ||
Thus, probe 2 with large differentials of the emission maxima with differential concentration of F− and Cu2+ ions provides opportunities for configuration of NOR, INH and AND Boolean operations at three distinctly different emission channels to be read at 585, 515 and 400 nm. In order to reconfigure the arithmetic functions, the reset capacity of the system was investigated. For cycling and reconfiguration of the logic functions, it is important to have all operations executed in the same cell. Here, NOR, INHIBIT and AND logic functions, achieved using Cu2+ and F− ions as inputs, are reset by addition of aqueous EDTA solution (solvates fluoride ions and binds Cu2+) and again restore the system to the initial state.
3. Theoretical calculations
Probes 1 and 2 have two Lewis base sites—imidazole imine nitrogen and phenolic oxygen for interaction with Cu2+ and Zn2+. These Lewis base sites can interact as such with metal ions and can also cause deprotonation at one of the binding sites. In order to provide insight to the differential mode of the complexation of probe 2 towards Cu2+, Zn2+ and 2, the Cu2+ complex in combination with fluoride (which led to formation of AND gate), the TD-DFT calculations17 were conducted at the B3LYP/6-31G (d, p) level of theory on probe 2 and its complexes with Cu2+, Zn2+ and Cu2+.F− ions. TD-DFT vertical excitation energies were calculated by using the B3LYP functional in combination with either 6-31G (d,p) for probe 2 or LAN2DZ basis set for complexes of probe 2 with metal ions.Excited state optimization calculation shows that in probe 2 upon excitation to an excited state (HOMO→LUMO), due to ICT from the naphthol ring to the benzimidazole ring, there occurs a change in the electron density that increases the acidity of the acidic centre and the basicity of the basic centre. This leads to migration of the proton to give a phototautomer at 585 nm in probe 2. In 2.Zn2+ complex, ESIPT is disrupted due to deprotonation of the hydroxyl proton which causes increase in the HOMO→LUMO energy gap and planarity between the two rings as compared to the free probe 2. Excitation energy calculations indicate the highest oscillator strength is prominently characterized by HOMO→LUMO, the electron density of HOMO is mainly localized on the naphthol ring while the electron density of LUMO is localized on the benzimidazole ring, which results in complete ICT from the naphthol ring (donor) to the benzimidazole ring (acceptor) with enhanced electron withdrawing ability due to the presence of Zn2+ ions which exhibit its emission at 480 nm theoretically. In case of the 2.Cu2+ complex, the optimized structure shows that Cu2+ does not induce complete deprotonation, but rather transfers the hydroxyl proton of the naphthol ring to benzimidazole imine nitrogen. The frontier orbital calculations show that the electronic transistion is characterized by HOMO-1→LUMO + 1 where the electron density in both cases is spread over the entire structure but with an opposite charge, resulting in partial ICT due to the paramagnetic effect of Cu2+. The calculated frontier molecular orbitals of the 2.Cu2+.F− complex show that there is no ESIPT. The transistions are predominately characterized by HOMO-1→LUMO at excited state geometry. HOMO-1 is localized on both the naphthol and benzimidazole rings and after excitation the electron is excited from the occupied π into an unoccupied π* orbital, giving excitation emission which produces the normal emission band at 400 nm and elaborates the “AND” logic function (Fig. 9 and Table 1).
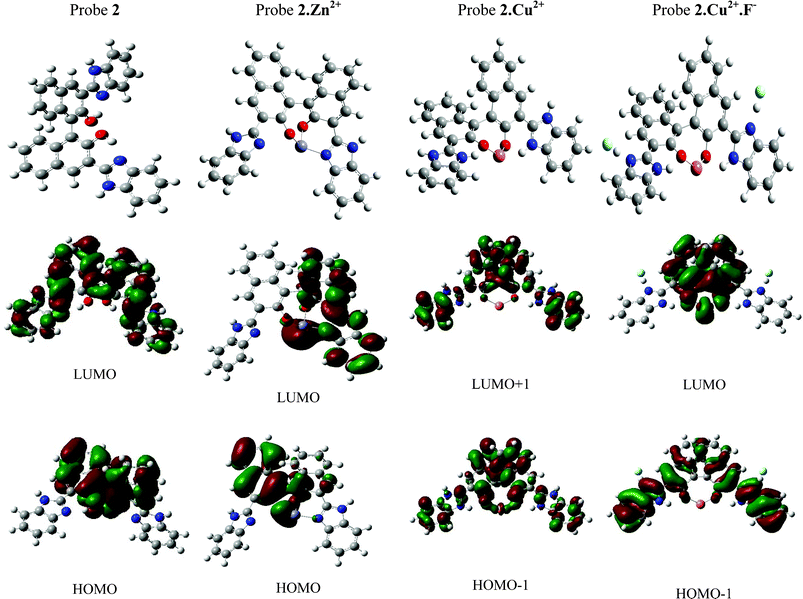 | ||
| Fig. 9 Theoretically optimized structures and molecular orbital diagram for probe 2 and their metal combinations. | ||
| λ abs (nm) | f | ε | transistionc | λ em(nm) | |||
|---|---|---|---|---|---|---|---|
| calcd | obsd | calcd | obsd | ||||
| a Oscillator strength. b Molar absorptivity. c H = HOMO and L = LUMO. d Not determined. | |||||||
| 2 | 350 | 330 | 1.28 | 48000 | H > L | 580 | 585 |
| 2.Zn2+ | 420 | 430 | 0.68 | 21000 | H > L | 500 | 480 |
| 2.Cu2+ | 430 | 425 | 0.52 | 13000 | H-1 > L + 1 | ndd | nd |
| 2.Cu2+.F− | 324 | 330 | 0.92 | 12500 | H-1 > L | 430 | 400 |
4. Conclusion
Thus, we have developed fluorescent probes for the selective estimation of Zn2+ and Cu2+ ions and a ratiometric sensing of Zn2+ ions. The flurophore 2 can be used to estimate 20 nM to 1000 nM of Zn2+ which is the lowest detection limit for the estimation of Zn2+ ions by a ratiometric approach. The fluorophore has been used as a Cu2+ concentration dependent Boolean logic operator which provides an opportunity to reconfigure NOR, INH and AND Boolean operations at three distinctly different emission channels, to be read at 585, 515 and 400 nm.5. Experimental
Photophysical studies
UV-Vis spectroscopy experiments were carried out on a Shimadzu UV-1601 or PC Shimadzu UV-2400 machines using a slit width of 1.0 nm and 1 cm path length matched quartz cells. The fluorescence experiments were performed on Shimadzu RF-1501 fluorescence spectrophotometer using a slit width of 10 nm and a 1 cm path length quartz cell. All absorption and emission scans were saved as ACS II files and further processed in Excel™ to produce all graphs shown. Log β values for anions and metal ion complexation have been determined by analyzing the respective spectral data using an iterative method on multiwavelength data, using the global analysis programme Specfit 32. The stock solutions of fluorophores 1 and 2 (1 mM) were prepared in DMSO. An appropriate amount of aliquot was transfered to the measuring flask and the solution was diluted with doubly distilled acetonitrile to get the desired solution of the fluorophore. For metal ion titrations, the solutions of chemosensors 1 and 2 were prepared in CH3CN–H2O (4![[thin space (1/6-em)]](https://www.rsc.org/images/entities/char_2009.gif) :
:![[thin space (1/6-em)]](https://www.rsc.org/images/entities/char_2009.gif) 1) containing 10 mM HEPES buffer. The solutions of metal ions were prepared in distilled water. The solutions of metal ions were added directly into a cuvette containing a solution of 1/2. Each time the solution was allowed to stand for 3 min before recording the fluorescence spectrum.
1) containing 10 mM HEPES buffer. The solutions of metal ions were prepared in distilled water. The solutions of metal ions were added directly into a cuvette containing a solution of 1/2. Each time the solution was allowed to stand for 3 min before recording the fluorescence spectrum.
General procedure for elaboration of the logic operations
Fluorescence spectra were recorded on a Shimadzu RF1501 spectrofluorophotmeter with a 1 cm quartz cell at 25 ± 1 °C. For performing the studies, the solution of fluorophores, tetrabutylammonium fluoride (TBA F) and copper perchlorate (Cu(ClO4)2) were prepared in doubly distilled acetonitrile. The solution containing fluorophore 2 was taken in a quartz cell and their fluorescence spectra were recorded. The addition of a different concentration of TBA F and Cu(ClO4)2 was carried out with a micropipette in aliquots of 1.5–3.0 μl in the same cell and each time the solution was allowed to stand for 3 min before recording the fluorescence spectrum.Computational details
To optimize the ground-state geometry of probe 2, B3LYP functional in conjunction with the 6-31G (d,p) basis set has been employed. The B3LYP functional uses Becke’s three-parameter exchange functional together with a function provided by Lee Yang Parr (LYP). The excited-state geometry of probe 2 was optimized at the TD-B3LYP/6-31G (d,p) and CIS/6-31G(d,p) level of theories. With the optimized ground- and excited-state geometries, the absorption and emission spectrum of probe 2 and its combination with copper and fluoride ions were calculated using the TD-DFT method with B3LYP, functionals and the 6-31G (d,p) basis set. The ground- and excited-state optimization and spectral calculations were carried out in acetonitrile medium using a polarized continuum model (PCM) to compare with the available experimental results.Acknowledgements
We thank DST, New Delhi (ref No. SR/FT/CS-02/2011) for financial assistance and CDRI Lucknow for FAB mass spectra.References
- Recents reviews: (a) T. Gunnlaugsson, M. Glynn, G. M. Tocci, P. E. Kruger and F. M. Pfeffer, Coord. Chem. Rev., 2006, 250, 3094–3117 CrossRef CAS; (b) J. F. Callan, A. P. de Silva and D. C. Magri, Tetrahedron, 2005, 61, 8551–8588 CrossRef CAS; (c) P. Carol, S. Sreejith and A. Ajayaghosh, Chem.–Asian J., 2007, 2, 338–348 CrossRef CAS; (d) J. Wu, W. Liu, J. Ge, H. Zhang and P. Wang, Chem. Soc. Rev., 2011, 40, 3483–3495 RSC; (e) Z. Xu, J. Yoon and D. R. Spring, Chem. Soc. Rev., 2010, 39, 1996–2006 RSCReviews anions: (f) M. E. Moragues, R. Martínez-Manez and F. Sancenón, Chem. Soc. Rev., 2011, 40, 2593–2643 RSC; (g) P. Dydio, D. Lichosyt and J. Jurczak, Chem. Soc. Rev., 2011, 40, 2971–2985 RSC; (h) R. Martinez-Manez and F. Sancenon, Chem. Rev., 2003, 103, 4419–4476 CrossRef CAS; (i) P. A. Gale, S. E. Garcia-Garrido and G. Joachim, Chem. Soc. Rev., 2008, 37, 151–190 RSC; (j) P. A. Gale, Chem. Soc. Rev., 2010, 39, 3746–3771 RSC.
- (a) A. P. de Silva, H. Q. N. Gunaratne and C. P. McCoy, Nature, 1993, 364, 42 CrossRef; (b) K. Szacilowski, Chem. Rev., 2008, 108, 3481–3548 CrossRef CAS; (c) A. P. de Silva, S. Uchiyama, T. P. Vance and B. Wannalerse, Coord. Chem. Rev., 2007, 251, 1623–1632 CrossRef; (d) F. M. Raymo, Adv. Mater., 2002, 14, 401–414 CrossRef CAS; (e) V. Balzani, A. Credi and M. Venturi, ChemPhysChem, 2003, 4, 49–59 CrossRef CAS; (f) A. P. de Silva and N. D. McClenaghan, Chem.–Eur. J., 2004, 10, 574–586 CrossRef.
- (a) Z. C. Wen and Y. B. Jiang, Tetrahedron, 2004, 60, 11109–11115 CrossRef CAS; (b) F. Y. Wu, Z. Li, L. Guo, X. Wang, M. H. Lin, Y. F. Zhao and Y. B. Jiang, Org. Biomol. Chem., 2006, 4, 624–630 RSC.
- (a) V. Thiagarajan, P. Ramamurthy, D. Thirumalai and V. T. Ramakrishnan, Org. Lett., 2005, 7, 657–660 CrossRef CAS; (b) T. Gunnlaugsson, H. D. P. Ali, M. Glynn, P. E. Kruger, G. M. Hussey, F. M. Pfeffer, C. M. G. dos Santos and J. Tierney, J. Fluoresc., 2005, 15, 287–299 CrossRef CAS.
- S. S. Sun, J. A. Anspach, A. J. Lees and P. Y. Zavalij, Organometallics, 2002, 21, 685–693 CrossRef CAS.
- (a) K. Sakai, T. Tsuzuki, Y. Itoh, M. Ichikawa and Y. Taniguchi, Appl. Phys. Lett., 2005, 86, 081103 CrossRef; (b) A. Costela, F. Amat, J. Catalan, A. Douhal, J. M. Figuera, J. M. Munoz and A. U. Acuna, Opt. Commun., 1987, 64, 457–460 CrossRef CAS.
- (a) J. Catalan, F. Fabero, R. M. Claramunt, M. D. S. Maria, M. D. C. Focesfoces, F. H. Cano, M. Martinezripoll, J. Elguero and R. Sastre, J. Am. Chem. Soc., 1992, 114, 5039–5048 CrossRef CAS; (b) M. Weichmann, H. Port, F. Laermer, W. Frey and T. Elsaesser, Chem. Phys. Lett., 1990, 165, 28–34 CrossRef.
- (a) J. M. Kauffman, Radiat. Phys. Chem., 1993, 41, 365–371 CrossRef CAS; (b) M. L. Martinez, W. C. Cooper and P. T. Chou, Chem. Phys. Lett., 1992, 193, 151–154 CrossRef CAS.
- (a) V. V. Shynkar, A. S. Klymchenko, C. Kunzelmann, G. Duportail, C. D. Muller, A. P. Demchenko, J. M.. Freyssinet and Y. Mely, J. Am. Chem. Soc., 2007, 129, 2187–2193 CrossRef CAS; (b) A. S. Klymchenko, G. Duportail, Y. Mely and A. P. Demchenko, Proc. Natl. Acad. Sci. U. S. A., 2003, 100, 11219–11224 CrossRef CAS; (c) A. S. Klymchenko, G. Duportail, T. Ozturk, V. G. Pivovarenko, Y. Mely and A. P. Demchenko, Chem. Biol., 2002, 9, 1199–1208 CrossRef CAS.
- (a) F. S. Rodembusch, F. P. Leusin, L. F. Medlina, A. Brandelli and V. Stefani, Photochem. Photobiol. Sci., 2005, 4, 254–259 RSC; (b) M. B. Cardoso, D. Samios, N. P. Silveira, F. S. Rodembusch and V. Stefani, Photochem. Photobiol. Sci., 2007, 6, 99–102 RSC.
- (a) T. Mutai, H. Tomoda, T. Ohkawa, Y. Yabe and K. Araki, Angew. Chem., 2008, 120, 9664–9666 CrossRef; (b) S. Park, J. Seo, S. H. Kim and S. Y. Park, Adv. Funct. Mater., 2008, 18, 726–731 CrossRef CAS; (c) S-J. Lim, J. Seo and S. Y. Park, J. Am. Chem. Soc., 2006, 128, 14542–14547 CrossRef CAS.
- (a) M. M. Henary, Y. Wu, J. Cody, S. Sumalekshmu, J. Li, S. Mandal and C. J. Fahrni, J. Org. Chem., 2007, 72, 4784–4797 CrossRef CAS; (b) Q. Chu, D. A. Medvetz and Y. Pamg, Chem. Mater., 2007, 19, 6421–6429 CrossRef CAS; (c) Y. Wu, X. Peng, J. Fan, S. Gao, M. Tian, J. Zhao and S. Sun, J. Org. Chem., 2007, 72, 62–70 CrossRef CAS; (d) K-C. Wu, Y-S. Lin, Y-S. Yeh, C-Y. Chen, M. O. Ahmed, P-T. Chou and Y-S. Hon, Tetrahedron, 2004, 60, 11861–11868 CrossRef CAS; (e) X. Peng, Y. Wu, J. Fan, M. Tian and K. Han, J. Org. Chem., 2005, 70, 10524–10531 CrossRef CAS; (f) Z. C. Wen, J. A. B. Ferreira and S. M. B. Costa, J. Photochem. Photobiol., A, 2008, 199, 98–104 CrossRef CAS; (g) N. Singh, N. Kaur, R. C. Mulrooney and J. F. Callan, Tetrahedron Lett., 2008, 49, 6690–6692 CrossRef CAS; (h) X. Zhang, L. Guo, F-Y. Wu and Y-B. Jiang, Org. Lett., 2003, 5, 2667–2670 CrossRef CAS; (i) A. Helal and H.-S. Kim, Tetrahedron Lett., 2009, 50, 5510–5515 CrossRef CAS; (j) M. M. Henary, Y. Wu and C. J. Fahrni, Chem.–Eur. J., 2004, 10, 3015–3025 CrossRef CAS.
- (a) J. Seo, S. Kim and S. Y. Park, J. Am. Chem. Soc., 2004, 126, 11154–11155 CrossRef CAS; (b) Z. Li, L. Zhang, L. Wang, Y. Guo, L. Cai, M. Yu and L. Wei, Chem. Commun., 2011, 47, 5798–5800 RSC; (c) J. Jiang, H. Jiang, X. Tang, L. Yang, W. Dou, W. Liu, R. Fang and W. Liu, Dalton Trans., 2011, 40, 6367–6370 RSC.
- (a) V. Luxami and S. Kumar, Tetrahedron Lett., 2007, 48, 3083–3087 CrossRef CAS; (b) V. Luxami and S. Kumar, New J. Chem., 2008, 32, 2074–2079 RSC.
- (a) S. Ozlem and E. U. Akkaya, J. Am. Chem. Soc., 2009, 131, 48–49 CrossRef CAS; (b) D. C. Magri, G. J. Brown, G. D. McClean and A. P. de Silva, J. Am. Chem. Soc., 2006, 128, 4950–4951 CrossRef CAS; (c) A. P. de Silva and N. D. McClenaghan, Chem.–Eur. J., 2002, 8, 4935–4945 CrossRef; (d) A. Coskun, E. Deniz and E. U. Akkaya, Org. Lett., 2005, 7, 5187–5189 CrossRef CAS.
- (a) Y. Xu and Y. Pang, Chem. Commun., 2010, 46, 4070–4072 RSC; (b) K-i. Sakai, S. Takahashi, A. Kobayashi, T. Akutagawa, T. Nakamura, M. Dosen, M. Kato and U. Nagashima, Dalton Trans., 2010, 39, 1989–1995 RSC; (c) Y. Xu and Y. Pang, Dalton Trans., 2011, 40, 1503–1509 RSC; (d) A. Helal, M. H. O. Rashid, C-H. Choi and H-S. Kim, Tetrahedron, 2012, 68, 647–653 CrossRef CAS; (e) A. Helal, S. H. Lee, S. H. Kim and H.-S. Kim, Tetrahedron Lett., 2010, 51, 3531–3535 CrossRef CAS.
- M. J. Frisch, G. W. Trucks, H. B. Schlegel, G. E. Scuseria, M. A. Robb, J. R. Cheeseman, J. A. Montgomery Jr, T. Vreven, K. N. Kudin, J. C. Burant, J. M. Millam, S. S. Iyengar, J. Tomasi, V. Barone, B. Mennucci, M. Cossi, G. Scalmani, N. Rega, G. A. Petersson, H. Nakatsuji, M. Hada, M. Ehara, K. Toyota, R. Fukuda, J. Hasegawa, M. Ishida, T. Nakajima, Y. Honda, O. Kitao, H. Nakai, M. Klene, X. Li, J. E. Knox, H. P. Hratchian, J. B. Cross, V. Bakken, C. Adamo, J. Jaramillo, R. Gomperts, R. E. Stratmann, O. Yazyev, A. J. Austin, R. Cammi, C. Pomelli, J. W. Ochterski, P. Y. Ayala, K. Morokuma, G. A. Voth, P. Salvador, J. J. Dannenberg, V. G. Zakrzewski, S. Dapprich, A. D. Daniels, M. C. Strain, O. Farkas, D. K. Malick, A. D. Rabuck, K. Raghavachari, J. B. Foresman, J. V. Ortiz, Q. Cui, A. G. Baboul, S. Clifford, J. Cioslowski, B. B. Stefanov, G. Liu, A. Liashenko, P. Piskorz, I. Komaromi, R. L. Martin, D. J. Fox, T. Keith, M. A. Al-Laham, C. Y. Peng, A. Nanayakkara, M. Challacombe, P. M. W. Gill, B. Johnson, W. Chen, M. W. Wong, C. Gonzalez and J. A. Pople, Gaussian 03, revision C02, Gaussian Inc., Pittsburgh, PA, 2004 Search PubMed.
Footnote |
| † Electronic Supplementary Information (ESI) available: Absorption spectra and spectral curve fitting data. See DOI: 10.1039/c2ra21170j/ |
| This journal is © The Royal Society of Chemistry 2012 |

