Well-defined fluoro- and carbazole-containing diblock copolymers: synthesis, characterization and immobilization onto Au-coated silicon surfaces
Ioanna
Savva
a,
Maria
Demetriou
a,
Andreas
Othonos
b,
Rodica
Turcu
c,
Adriana
Popa
c,
Sergiu
Macavei
c and
Theodora
Krasia-Christoforou
*a
aDepartment of Mechanical and Manufacturing Engineering, School of Engineering, University of Cyprus, P. O. Box 20537, 1678 Nicosia, Cyprus. E-mail: isavva02@ucy.ac.cy; demmaria@hotmail.com; krasia@ucy.ac.cy; Tel: +357 22892288; Fax: +357 22895081
bResearch Center of Ultrafast Science, Department of Physics, Faculty of Pure and Applied Sciences, University of Cyprus, P. O. Box 20537, 1678 Nicosia, Cyprus. E-mail: othonos@ucy.ac.cy
cNational Institute R&D for Isotopic and Molecular Technologies, Cluj-Napoca 400293, Romania. E-mail: rodica.turcu@itim-cj.ro; adriana.popa@itim-cj.ro; sergiu.macavei@itim-cj.ro
First published on 26th July 2012
Abstract
A series of well-defined diblock copolymers consisting of 2-(N-carbazolyl)ethyl methacrylate (CbzEMA) and 2,2,3,3,4,4,4-heptafluorobutyl methacrylate (HFBMA) (CbzEMAx-b-HFBMAy) was synthesized by Reversible Addition-Fragmentation chain Transfer (RAFT) polymerization. All polymers were characterized in terms of molecular weights, molecular weight distributions and chemical compositions using Size Exclusion Chromatography (SEC), Fourier Transform Infrared (FTIR) spectroscopy and Proton Nuclear Magnetic Resonance (1H NMR) spectroscopy, respectively. The thermal properties (glass transition and decomposition temperatures) of the CbzEMAx and HFBMAx homopolymers and the CbzEMAx-b-HFBMAy diblock copolymers were determined by Differential Scanning Calorimetry (DSC) and Thermal Gravimetric Analysis (TGA). As demonstrated by photoluminescence measurements, immobilization of the dithioester-ended functionalized CbzEMAx-b-HFBMAy chains onto Au-coated silicon surfaces has been accomplished via anchoring of the sulfur-containing end-groups onto the Au surfaces. The presence of the low-surface energy fluorinated block, combined with the electro-active carbazole-containing segment within CbzEMAx-b-HFBMAy diblock copolymers imparts to these immobilized thin layers useful properties towards their potential applicability in gas sensing technologies.
Introduction
Polymer-based materials exhibiting electro-active functionalities have attracted significant attention due to their potential use in various optoelectronic applications including organic-based photovoltaics,1,2 polymer light emitting diodes,3,4 thin film transistors and sensors,5,6 optical switching,7,8 optical data storage and information processing.9,10Carbazole-containing polymers belong to this class and are highly attractive due to their potential applications as photoconductors and photorefractive or charge transporting materials. Further applications of these materials include the development of light-emitting diodes (LEDs), electrochemical and gas sensors11,12 and photovoltaic devices.13 Carbazolyl groups easily form relatively stable radical cations (holes), present comparatively high charge carrier mobilities and exhibit high thermal and photochemical stability. Moreover, carbazole is a cheap raw material that can be very easily subjected into chemical modification reactions for the introduction of different substituents into the carbazole ring.13–16
Polymers with fluorinated groups present either in the main backbone or in the side chain, exhibit some outstanding properties, including high thermal stability, chemical inertness, low dielectric constants and dissipation factors, low water absorptivities, and good resistance to surface properties.14,17–20 Due to the ability of fluoropolymers to provide a unique combination of chemical resistance, toughness, and purity, they are used in a wide variety of fluid and device handling applications.21 In particular, block copolymers containing fluoropolymer segments receive considerable attention nowadays, since such materials combine the properties of the fluoro-containing segment with special characteristics deriving upon the introduction of other functional units within the copolymer.22–28
Herein, a simple and cost-effective synthetic approach involving Reversible Addition Fragmentation chain Transfer (RAFT) controlled radical polymerization29,30 has been employed for the synthesis of a series of well-defined 2-(N-carbazolyl)ethyl methacrylate-block-2,2,3,3,4,4,4-heptafluorobutyl methacrylate (CbzEMAx-b-HFBMAy) diblock copolymers. For the first time HFBMA is combined with CbzEMA to yield well-defined functional diblock copolymers presenting electro-active and fluorinated moieties. Hence, the present work describes the unique combination of a rare example of a fluorinated methacrylate monomer polymerized by RAFT, with an electro- and photoactive polymethacrylate, the controlled polymerization of which has been rarely reported.31–34 The RAFT process was readily employed to prepare well-defined CbzEMAx homopolymers and CbzEMAx-b-HFBMAy diblock copolymers. The molecular and compositional characteristics of the polymers were determined by Size Exclusion Chromatography (SEC), FTIR spectroscopy and 1H NMR spectroscopy respectively. Differential Scanning Calorimetry (DSC) and Thermal Gravimetric Analysis (TGA) provided information on the thermal properties (glass transition and decomposition temperatures) of these materials.
The presence of the low-surface energy fluorinated block, combined with the electro-active carbazole-containing segment within CbzEMAx-b-HFBMAy diblock copolymers imparts to these materials useful properties for the fabrication of high quality and high performance functional thin films. In that respect, anchoring of the CbzEMAx-b-HFBMAy chains onto Au-coated surfaces has been accomplished via the dithioester end groups that are retained onto the polymer chains grown by RAFT. Photoluminescence measurements demonstrated that the diblock copolymer chains have been successfully immobilized onto the Au-coated silicon surfaces. These new systems may be promising for the fabrication of novel macromolecular thin films towards gas sensing. The latter relies on the fact that ultrathin polymer films possessing electro-active moieties demonstrate enhanced performance translated into fast response, good reproducibility and high sensitivity and that the adsorption of a gas onto the surface of an electro-active polymer may cause significant changes in either the electrical or optical properties.15,21
Experimental section
Materials
Benzene (Fluka, Merck ≥99.5%) and tetrahydrofuran (THF) (HPLC grade, LabScan) were stored over CaH2 (Merck, 99.9%) and distilled under reduced pressure immediately prior to the polymerization reactions. Methanol (LabScan, Scharlau 99.9%), n-hexane (Scharlau, 99%), ethyl acetate (Scharlau, 99%), cyclohexane (Scharlau, 99%), chloroform (Scharlau, 99%), acetone (analytical grade, Scharlau), dimethylformamide (DMF) (Sigma-Aldrich, ≥99.8%), dichloromethane (Scharlau, 99%), triethylamine (Merck, ≥99.8%), hydrochloric acid (Merck, 37% solution) and diethyl ether (LabScan, 99.5%) were used as received by the manufacturer. Regarding deuterated solvents, CDCl3 (Scharlau) was used in 1H NMR studies. Methacryloyl chloride (Merck, ≥97%), carbazole (Sigma ≥99.5%), 2,2,3,3,4,4,4-heptafluorobutyl methacrylate (Sigma-Aldrich, 97%), ethylene carbonate (Sigma-Aldrich, 98%), benzyl chloride (Sigma-Aldrich, 99%), α-methylstyrene (Sigma-Aldrich, 99%), sodium methoxide (Sigma-Aldrich, 30% solution in methanol), sodium hydroxide pellets (Scharlau), potassium hydroxide pellets (HiMedia, 85%), sulfur (Sigma-Aldrich, powder ≈100 mesh), anhydrous magnesium sulfate (Scharlau), sodium bicarbonate (99.5%, Sigma-Aldrich) and silica gel (Sigma-Aldrich, 60 Å, 70–230 mesh) were used as received. 2,2-Azobis(isobutylnitrile) (AIBN) (Sigma-Aldrich, 95%), was recrystallized twice from ethanol. The chain transfer agent (CTA), cumyl dithiobenzoate (CDTB), was synthesized according to a well-known procedure reported in the literature.35Syntheses
![[thin space (1/6-em)]](https://www.rsc.org/images/entities/char_2009.gif) :
:![[thin space (1/6-em)]](https://www.rsc.org/images/entities/char_2009.gif) 1 benzene/cyclohexane mixture (35 mL). Recrystallization involved the dissolution of 2-(N-carbazolyl)ethanol in the above-mentioned solvent mixture under reflux and continuous stirring, followed by cooling down to room temperature and storage at −20 °C. Subsequently, the mixture was filtered off and the resulting solid (white powder) was left to dry in a vacuum furnace at room temperature.
1 benzene/cyclohexane mixture (35 mL). Recrystallization involved the dissolution of 2-(N-carbazolyl)ethanol in the above-mentioned solvent mixture under reflux and continuous stirring, followed by cooling down to room temperature and storage at −20 °C. Subsequently, the mixture was filtered off and the resulting solid (white powder) was left to dry in a vacuum furnace at room temperature.
The obtained 2-(N-carbazolyl)ethanol (8.5 g, 0.0403 mol), was then dissolved in dichloromethane (134.4 mL). In the reaction flask, triethylamine (6.7 mL, 0.047 mol), and methacryloyl chloride (4.7 mL, 0.047 mol) were added in a 20% excess, to ensure a more quantitative reaction. The methacryloyl chloride was added dropwise during stirring at 0 °C, (exothermic reaction). During this process, the formation of a by-product was observed as a sediment namely hydrochloric triethylamine (Et3NHCl). The reaction mixture was stirred for 24 h at room temperature. The hydrochloric triethylamine was removed from the reaction mixture by filtration.
After filtration, water (10 mL) was added for the hydrolysis of the excess of methacryloyl chloride into methacrylic acid. The methacrylic acid resigned into the aqueous phase whereas the product remained in the organic phase.
Subsequently, dichloromethane (40.0 mL) was added in the solution and the mixture was extracted two times with water (5.0 and 10.0 mL), then three times with NaHCO3 solution (5% in water, addition of 5.0 mL each time) and again three times with water. After the extractions, anhydrous MgSO4 was added in the organic phase in order to remove the water traces. Subsequently, the organic solvent was removed under reduced pressure; the product was dried and recrystallized twice in methanol. The recrystallization process was carried out at room temperature, in order to avoid thermal polymerization of the monomer. The resulting solid was then filtered and dried in a vacuum furnace at room temperature. The synthetic route followed for the synthesis of the CbzEMA monomer is presented in Fig. 1, whereas the chemical structure of the monomer is depicted in Fig. 2.
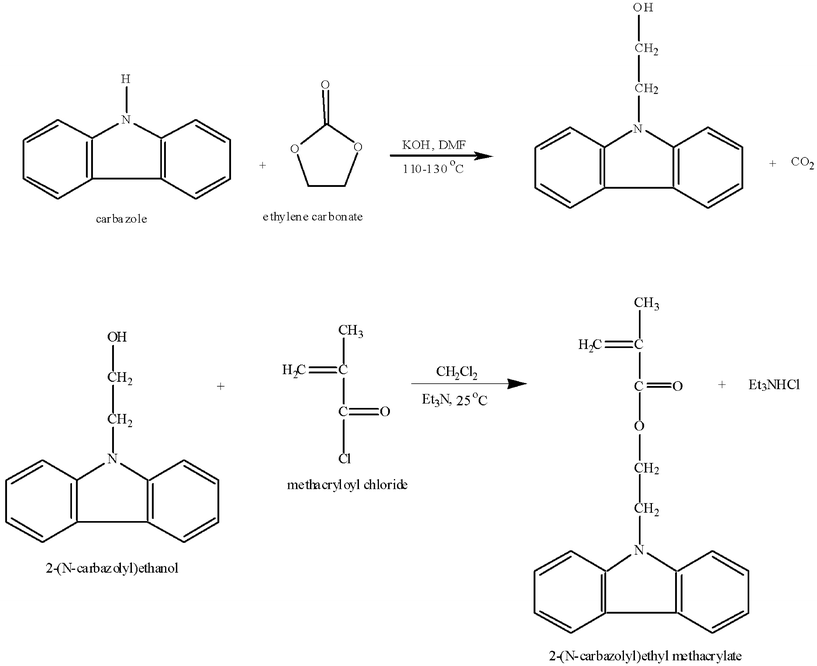 | ||
| Fig. 1 Two-step synthetic methodology followed for the preparation of the 2-(N-carbazolyl)ethyl methacrylate (CbzEMA). | ||
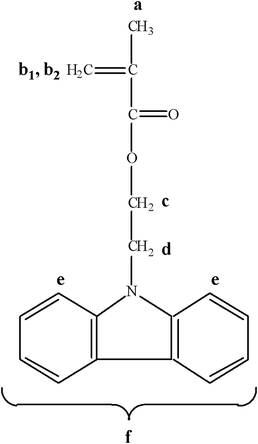 | ||
| Fig. 2 The chemical structure of the 2-(N-carbazolyl)ethyl methacrylate (CbzEMA) monomer. | ||
1H NMR (300 MHz, CDCl3) δ (ppm): 8.1–8.0 (br, 2H (e)), 7.5–7.34 (m, 6H (f)), 5.92–5.85 (br, 1H (b1)), 5.48–5.44 (br, 1H (b2)), 4.62–4.52 (m, 4H (c, d)), 1.8 (s, –CH3 (a)).
Poly(2-(N-carbazolyl) ethyl methacrylate) (CbzEMAx)
A series of well-defined CbzEMAx homopolymers, with various polymerization degrees (DP), was prepared by RAFT. To a round-bottom flask (25.0 mL) maintained under a dry nitrogen atmosphere, CbzEMA (1 g, 3.58 × 10⁻³ mol) was added. CDTB (8.12 mg, 2.98 × 10⁻⁵ mol) and AIBN (2.68 mg, 1.63 × 10⁻⁵ mol) were dissolved in freshly distilled THF (2.0 mL) and were transferred into the flask with the aid of a syringe. Subsequently, the resulting solution was degassed by three freeze-evacuate-thaw cycles, placed under a dry nitrogen atmosphere and heated in a thermostated oil bath at 63 °C for 18 h. The polymerization was terminated by cooling the reaction down to room temperature. The produced CbzEMAx (0.634 g, 64% polymerization yield) (Fig. 3) was retrieved by precipitation in n-hexane and was left to dry in vacuo at room temperature for 24 h.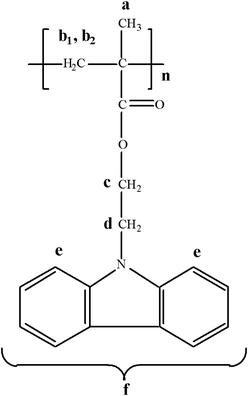 | ||
| Fig. 3 The chemical structure of the poly(2-(N-carbazolyl)ethyl methacrylate) (CbzEMAx) homopolymer. | ||
1H NMR (300 MHz, CDCl3) δ (ppm): 7.9 (br, 2H (e)), 7.22–7.07 (m, 6H (f)), 4.3–3.6 (m, br 4H (c, d)), 1.85 (br, –CH2 (b)), 0,8–1.0 (br, –CH3 (a)).
Poly(2,2,3,3,4,4,4-heptafluorobutyl methacrylate) (HFBMAx)
To a round-bottom flask (50.0 mL) maintained under a dry nitrogen atmosphere, HFBMA (3.0 mL, 1.5 × 10⁻² mol) was added. CDTB (20.5 mg, 7.52 × 10⁻⁵ mol) and AIBN (5.53 mg, 3.37 × 10⁻⁵ mol) were dissolved in freshly distilled THF (12.0 mL) and were transferred into the flask with the aid of a syringe. Subsequently, the resulting solution was degassed by three freeze-evacuate-thaw cycles, placed under a dry nitrogen atmosphere and heated in a thermostated oil bath at 63 °C for 18 h. The polymerization was terminated by cooling the reaction down to room temperature. The produced HFBMAx (1.6974 g, 42% polymerization yield) (Fig. 4) was retrieved by precipitation in methanol and was left to dry in vacuo at room temperature for 24 h. Further purification, of the polymer was carried out by re-precipitation in n-hexane.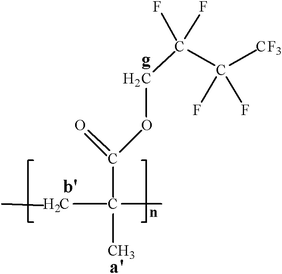 | ||
| Fig. 4 The chemical structure of the poly(2,2,3,3,4,4,4-heptafluorobutyl methacrylate) (HFBMAx) homopolymer. | ||
1H NMR (300 MHz, CDCl3) δ (ppm): 4.5–4.3 (s, br, 2H (g)), 1.95 (br, 2H (b′)), 1.10 (br, –CH3 (a′)).
Diblock copolymers
![[M with combining macron]](https://www.rsc.org/images/entities/i_char_004d_0304.gif) n = 31
n = 31![[thin space (1/6-em)]](https://www.rsc.org/images/entities/char_2009.gif) 711 g mol−1, 2.24 × 10⁻³ mol, macro-CTA) dissolved in freshly distilled THF (4.0 mL) were placed together with HFBMA (0.5 mL, 2.51 × 10⁻³ mol). The reaction mixture was degassed by three freeze-evacuate-thaw cycles, placed under a dry nitrogen atmosphere and heated in a thermostated oil bath at 63 °C for 18 h. The polymerization was terminated by cooling the reaction down to room temperature. The produced CbzEMAx-b-HFBMAy diblock copolymer (0.881 g, 38% polymerization yield) (Fig. 5) was retrieved by precipitation in n-hexane or methanol and was left to dry in vacuo at room temperature for 24 h.
711 g mol−1, 2.24 × 10⁻³ mol, macro-CTA) dissolved in freshly distilled THF (4.0 mL) were placed together with HFBMA (0.5 mL, 2.51 × 10⁻³ mol). The reaction mixture was degassed by three freeze-evacuate-thaw cycles, placed under a dry nitrogen atmosphere and heated in a thermostated oil bath at 63 °C for 18 h. The polymerization was terminated by cooling the reaction down to room temperature. The produced CbzEMAx-b-HFBMAy diblock copolymer (0.881 g, 38% polymerization yield) (Fig. 5) was retrieved by precipitation in n-hexane or methanol and was left to dry in vacuo at room temperature for 24 h.
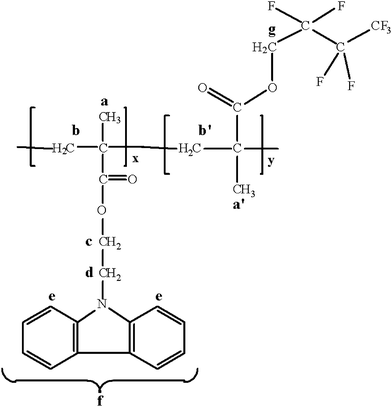 | ||
| Fig. 5 The chemical structure of the CbzEMAx-b-HFBMAy diblock copolymers. | ||
1H NMR (300 MHz, CDCl3) δ (ppm): 7.9 (br, 2H (e)), 7.21–7.06 (br, 6H, (f)), 4.41–4.3 (s, br, 2H (g)), 4.3–4.05 (br, 2H (c)), 4.05–3.75 (br, 2H (d)), 1.95 (br, –CH2 (b, b′)), 1.0–1.2 (br, –CH3 (a, a′)).
Film fabrication
Polymer films were generated on gold-coated silicon substrates (gold film thickness 25 nm) upon immersion of the latter in a dilute THF solution of CbzEMA52-b-HFBMA69 (2 g L−1) at room temperature.38 After 24 h, the solution was removed via a syringe and the substrate with adsorbed polymer was washed with fresh solvent (THF) until no polymer could be detected by UV-vis analysis in the washing medium. The films were then left to dry on the bench for 24 h and were not supplementary dried prior to photoluminescence and atomic force microscopy (AFM) measurements.Instrumentation
Proton Nuclear Magnetic Resonance (1H NMR) spectroscopy was used for confirming the expected chemical structure of the polymers. 1H NMR spectra were recorded in CDCl3 using an Avance Brucker 300 MHz spectrometer equipped with an Ultrashield magnet. The CDCl3 contained traces of tetramethylsilane (TMS), which was used as an internal reference. For classifying the signals in the 1H NMR spectra, abbreviations such as s (singlet), d (doublet), t (triplet), m (multiplet) and br (broad) are used.The molecular weights and polydispersity indices of the polymers were determined by Size Exclusion Chromatography (SEC). All measurements were carried out at room temperature using Styragel HR 3 and Styragel HR 4 columns. The mobile phase was THF, delivered at a flow rate 1 mL min−1 using a Waters 515 isocratic pump. The refractive index was measured with a Waters 2414 refractive index detector. The instrumentation was calibrated using poly(methyl methacrylate) (PMMA) standards with narrow polydispersity indices (MWs of 102, 450, 670, 1580, 4200, 14![[thin space (1/6-em)]](https://www.rsc.org/images/entities/char_2009.gif) 400, 31
400, 31![[thin space (1/6-em)]](https://www.rsc.org/images/entities/char_2009.gif) 000, 65
000, 65![[thin space (1/6-em)]](https://www.rsc.org/images/entities/char_2009.gif) 000, 126
000, 126![[thin space (1/6-em)]](https://www.rsc.org/images/entities/char_2009.gif) 000, 270
000, 270![[thin space (1/6-em)]](https://www.rsc.org/images/entities/char_2009.gif) 000, 446
000, 446![[thin space (1/6-em)]](https://www.rsc.org/images/entities/char_2009.gif) 000, 739
000, 739![[thin space (1/6-em)]](https://www.rsc.org/images/entities/char_2009.gif) 000 g mol−1) supplied by Polymer Standards Service (PSS).
000 g mol−1) supplied by Polymer Standards Service (PSS).
The refractive index of THF, a HFBMAx homopolymer and a CbzEMAx-b-HFBMAy diblock copolymer was determined using an ABBE refractometer.
Differential Scanning Calorimetry (DSC) was used to measure the glass transition temperatures (Tg) of the homopolymers and the diblock copolymers using a Q100 TA Instrument with a heating rate of 10 °C min−1. Each sample was scanned twice between −100 °C to +170 °C. The second run (heat) was used for data analysis.
Thermal Gravimetric Analysis (TGA) measurements were used in order to determine the thermal stability of the polymers and they were based on continuous measurement of weight on a sensitive balance (thermobalance) upon temperature increase. TGA measurements were performed on a Q-500 TA Instrument under an argon flow at heating rate of 10 °C min−1.
Ultra Violet-visible spectroscopy (UV-vis) was carried out on a Jasco UV-vis spectrophotometer (V 630). Measurements were performed in THF and solution concentration was approximately 1 g L−1.
Fourier Transform Infrared Spectroscopy (FTIR) was carried out on a Jasco FTIR spectrometer (4100).
The AFM investigations have been performed with an UHV-3500 Scanning Probe Microscope from RHK Technology. The system is operating in ultra high vacuum (UHV) and the samples were analyzed in the non-contact operating mode using a scan speed of 2.71 micrometer/s and a tip frequency of 74.7 kHz. n-Type silicon (phosphorus doped) tips with a conical shape were used to acquire the AFM images.
Photoluminescence (PL) measurements were performed using a UV source based on a Ti-sapphire ultrafast laser generating 75 fs pulses at repetition rate of 250 kHz. In this system the fundamental light at 800 nm generated by the ultrafast amplifier was frequency doubled and used as the source of excitation for an Optical Parametric Amplifier (OPA) which was tuned for these experiments at 510 nm. The OPA pulses were frequency doubled using a BBO non-linear crystal to produce 255 nm. The UV beam was then separated and directed on the sample using several wavelength selective dielectric mirrors. The average power that was incident on the sample was approximately 10 μW with a measured spot size at the excitation region of 2 mm. The PL emission was collected and analyzed through a double pass spectrometer equipped with a photon counting photomultiplier system.
The gold-coated silicon substrates used (Au film thickness: 25 nm) were prepared by sputtering using argon at a pressure of approximately 10−2 mBar.
Results and discussion
Molecular characterization
Well-defined CbzEMAx and HFBMAx homopolymers and CbzEMAx-b-HFBMAy diblock copolymers were successfully synthesized following typical RAFT methodologies already described in the Experimental Section. The molecular characterization of these materials was carried out by means of SEC, 1H NMR and FTIR. Table 1 summarizes the chemical structures of all homopolymers and diblock copolymers prepared in this study along with their molecular weight (MW) and compositional characteristics.| Polymera | Yield (%)b | SEC Resultsc | ||
|---|---|---|---|---|
![[M with combining macron]](https://www.rsc.org/images/entities/i_char_004d_0304.gif) n
n
|
![[M with combining macron]](https://www.rsc.org/images/entities/i_char_004d_0304.gif) w
w
|
PDI | ||
a Determined by SEC and 1H NMR.
b [(g monomer)/(mol RAFT agent)] × (polymerization yield) + MW of CTA (for homopolymers) and [(g monomer)/(mol macro-CTA agent)] × (polymerization yield) + ![[M with combining macron]](https://www.rsc.org/images/entities/i_char_004d_0304.gif) n of macro-CTA (for diblock copolymers).
c SEC calibrated with PMMA standards; n of macro-CTA (for diblock copolymers).
c SEC calibrated with PMMA standards; ![[M with combining macron]](https://www.rsc.org/images/entities/i_char_004d_0304.gif) n = number average molecular weight; PDI = polydispersity index; CbzEMA = 2-(N-carbazolyl) ethyl methacrylate; HFBMA = 2,2,3,3,4,4,4-heptafluorobutyl methacrylate; n.d.: not determined. n = number average molecular weight; PDI = polydispersity index; CbzEMA = 2-(N-carbazolyl) ethyl methacrylate; HFBMA = 2,2,3,3,4,4,4-heptafluorobutyl methacrylate; n.d.: not determined.
|
||||
| CbzEMA13 | 58 | 3602 | 4174 | 1.16 |
| HFBMA95 | 42 | 25![[thin space (1/6-em)]](https://www.rsc.org/images/entities/char_2009.gif) 861 861 |
32![[thin space (1/6-em)]](https://www.rsc.org/images/entities/char_2009.gif) 283 283 |
1.25 |
| CbzEMA13-b-HFBMA244 | 52 | 25![[thin space (1/6-em)]](https://www.rsc.org/images/entities/char_2009.gif) 437 437 |
32![[thin space (1/6-em)]](https://www.rsc.org/images/entities/char_2009.gif) 623 623 |
1.28 |
| CbzEMA13-b-HFBMA316 | 80 | 25![[thin space (1/6-em)]](https://www.rsc.org/images/entities/char_2009.gif) 781 781 |
31![[thin space (1/6-em)]](https://www.rsc.org/images/entities/char_2009.gif) 440 440 |
1.22 |
| CbzEMA52-b-HFBMA69 | n.d. | 22![[thin space (1/6-em)]](https://www.rsc.org/images/entities/char_2009.gif) 106 106 |
35![[thin space (1/6-em)]](https://www.rsc.org/images/entities/char_2009.gif) 105 105 |
1.59 |
| CbzEMA113-b-HFBMA52 | 38 | 34![[thin space (1/6-em)]](https://www.rsc.org/images/entities/char_2009.gif) 245 245 |
43![[thin space (1/6-em)]](https://www.rsc.org/images/entities/char_2009.gif) 406 406 |
1.26 |
1H NMR spectroscopy confirmed the expected chemical structure of the diblock copolymers. In Fig. 6 the 1H NMR spectrum of the CbzEMA113-b-HFBMA52 diblock copolymer is exemplarily given. The peak assignments are shown in the spectrum. The degrees of the polymerization of the HFBMA comonomer were determined from the ratio of the areas under the characteristic signals of the CbzEMA and HFBMA, appearing at 4.2–3.9 ppm (c, d) and 4.4 ppm (g) respectively. The signal at 4.4 ppm corresponds to the methylene protons adjacent to the oxygen of the ester group in HFBMA.39,40 The signals appearing at 4.2–3.9 ppm correspond to the –CH2–CH2– protons of the carbazole group (adjacent to nitrogen in CbzEMA).41
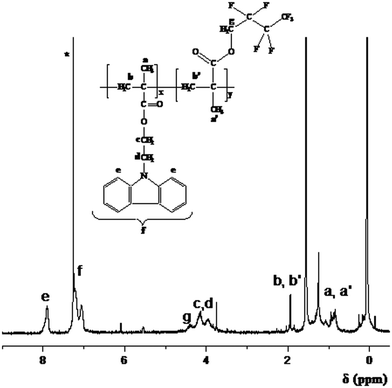 | ||
| Fig. 6 1H NMR spectrum of the CbzEMA113-b-HFBMA52 diblock copolymer. *Solvent (CHCl3). | ||
Moreover, FTIR spectroscopy was employed to verify the chemical structure of the polymers. Fig. 7 presents the FTIR spectra of the HFBMA95 and CbzEMA52 homopolymers and of the CbzEMA113-b-HFBMA52 diblock copolymer. In the spectra the vibration bands appearing at 1597 cm−1 correspond to the C![[double bond, length as m-dash]](https://www.rsc.org/images/entities/char_e001.gif) O bond that is present in the systems42 whereas the vibration frequency of the C–O bond of the ester group appears at 1731 cm−1. In the FTIR spectrum of the HFBMA95 homopolymer, the signal appearing at 1351 cm−1 corresponds to the vibration frequency of the C–F bond. Moreover, the two signals at 1203 cm−1 and 1156 cm−1, correspond to the symmetric and antisymmetric stretching vibrations of the –CF2 group respectively, whereas two medium bands appear at 749 cm−1 and 722 cm−1, corresponding to a combination of cocking and wagging vibrations of the –CF3 group.40
O bond that is present in the systems42 whereas the vibration frequency of the C–O bond of the ester group appears at 1731 cm−1. In the FTIR spectrum of the HFBMA95 homopolymer, the signal appearing at 1351 cm−1 corresponds to the vibration frequency of the C–F bond. Moreover, the two signals at 1203 cm−1 and 1156 cm−1, correspond to the symmetric and antisymmetric stretching vibrations of the –CF2 group respectively, whereas two medium bands appear at 749 cm−1 and 722 cm−1, corresponding to a combination of cocking and wagging vibrations of the –CF3 group.40
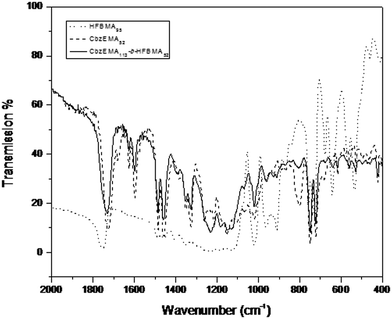 | ||
| Fig. 7 The FTIR spectra of the HFBMA95 and CbzEMA52 homopolymers, and the CbzEMA113-b-HFBMA52 diblock copolymer. | ||
The average MWs and PDIs of the homopolymers and corresponding diblock copolymers were determined by SEC. All data are provided in Table 1. All polymers (with the exception of the CbzEMA52-b-HFBMA69 system) exhibited low PDI (<1.3), which are well-comparable with PDI values of previously reported polymers prepared by RAFT,29 demonstrating the well-defined character of these new materials.
Fig. 8(a) displays the SEC traces of the HFBMA95 and CbzEMA108 homopolymers, and of the CbzEMA113-b-HFBMA52 and CbzEMA13-b-HFBMA244 diblock copolymers. Due to the lower refractive index of the HFBMA95 homopolymers compared to that of THF, the signal corresponding to the SEC eluogram of the HFBMA95 homopolymer and CbzEMA13-b-HFBMA244 diblock copolymer is negative. As provided in Table 2, the experimental refractive index value corresponding to the HFBMA95 homopolymer was determined to be 1.4065, which is lower than that of THF. In contrary, the refractive index of the CbzEMA113-b-HFBMA52 diblock copolymer was determined to be higher than that of the pure solvent as expected, due to the higher content of the CbzEMA units within the diblock copolymer.
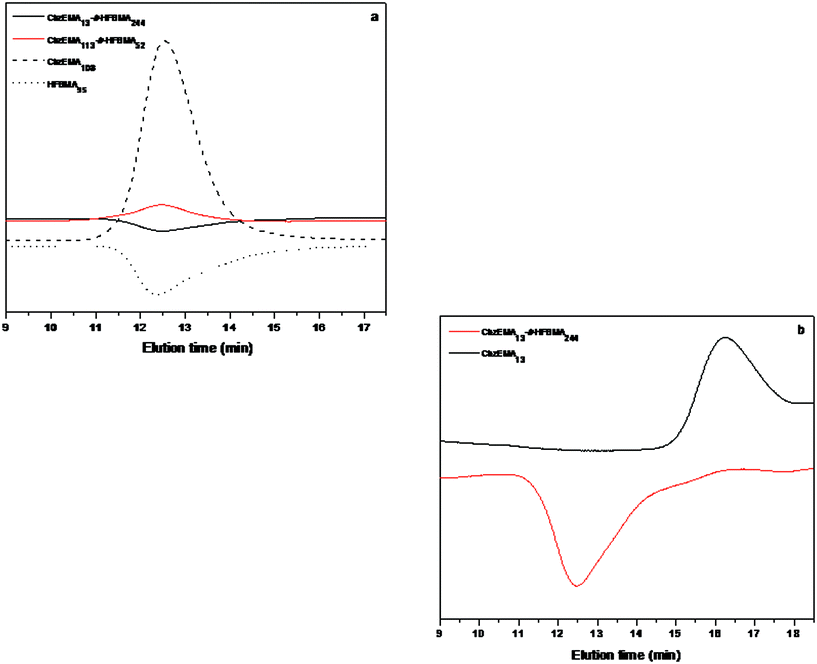 | ||
| Fig. 8 SEC eluograms of (a) HFBMA95 and CbzEMA108 homopolymers and of the CbzEMA113-b-HFBMA52 and CbzEMA13-b-HFBMA244 diblock copolymers and (b) CbzEMA13 homopolymer and the CbzEMA13-b-HFBMA244 diblock copolymer. | ||
| Polymer | Refractive Index |
|---|---|
| THF | 1.4080 |
| HFBMA95 | 1.4065 |
| CbzEMA113-b-HFBMA52 | 1.4135 |
In Fig. 8(b) the SEC traces of the CbzEMA13 homopolymer and the CbzEMA13-b-HFBMA244 diblock copolymer are illustrated. As seen in the Figure, the molecular weight distribution (MWD) of the latter is shifted towards higher MWs compared to that of the corresponding homopolymer, demonstrating the block efficiency from homopolymer to block copolymer.
Thermal properties
DSC and TGA measurements were carried out for the determination of the glass transition (Tg) and decomposition temperatures of the polymers, respectively. The glass transition temperature (Tg) of CbzEMA52 and HFBMA95 prepared by RAFT was 142 and 52 °C respectively (Fig. 9(a)) which is close to literature values.43,44 The diblock copolymers exhibited two Tgs, at ∼128 °C (corresponding to the CbzEMAx block) and ∼58 °C (corresponding to the HFBMAy block). These results may suggest that the CbzEMAx-b-HFBMAy diblock copolymers tend to microphase separate in the bulk. As far as thermal stability is concerned, all polymers start losing weight at ∼300–350 °C and decompose losing most of their weight between 400–450 °C as indicated by TGA (Fig. 9(b)).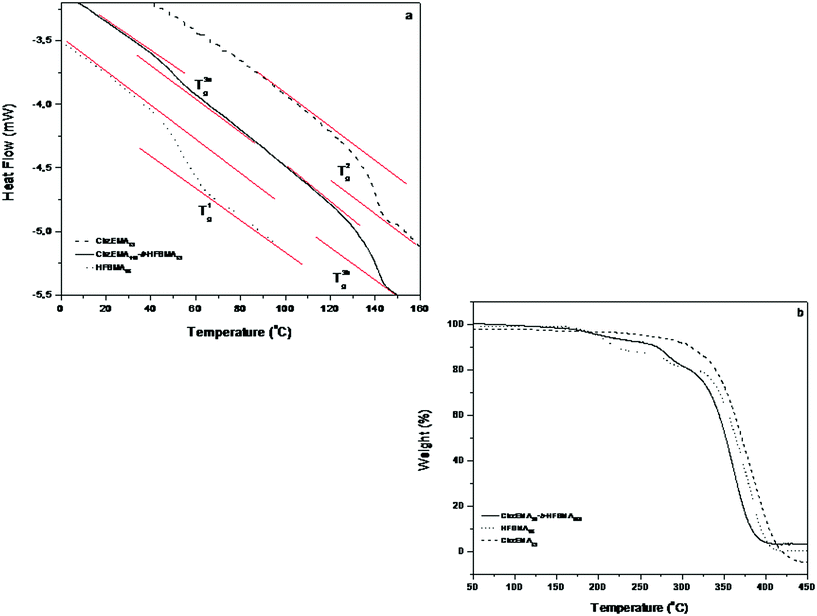 | ||
| Fig. 9 (a) DSC thermograms for the HFBMA95 and CbzEMA52 homopolymers and the CbzEMA113-b-HFBMA52 diblock copolymer (b) TGA curves of the CbzEMA52 and HFBMA95 homopolymers and the CbzEMA113-b-HFBMA52 diblock copolymer. | ||
Film fabrication and characterization
As already described in the experimental section, a polymer layer was generated on a gold-coated silicon substrate upon immersion of the latter in a dilute THF solution of CbzEMA52-b-HFBMA69 at room temperature. The strong specific interaction between the sulfur atom and the gold surface45 induced the spontaneous assembly of the polymer chains onto the gold interface as schematically presented in Fig. 10.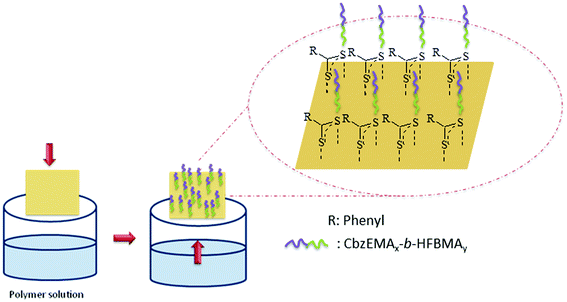 | ||
| Fig. 10 Schematic representation of the generation of a polymer film on gold-coated silicon substrate. | ||
According to C.-A. Fustin and A.-S. Duwez,46 the dithioester group is chemisorbed on a gold substrate with both sulfur atoms attached onto its surface, forming monolayers, whereas based on X-ray photoelectron spectroscopy (XPS) data the formation of multilayers is excluded.
Prior to photoluminescence measurements (PL) performed on the polymer-coated Au-silicon substrates, UV-Vis characterization of the homopolymers and diblock copolymers was carried out in THF. In Fig. 11 the UV-Vis spectra of (i) the CbzEMA52 and HFBMA95 homopolymers and (ii) the CbzEMA113-b-HFBMA52 diblock copolymer recorded in THF at room temperature are shown. Several absorption maxima appear in the spectra of the CbzEMA52 and CbzEMA113-b-HFBMA52 within the wavelength range of 240–350 nm with the strong intense band at around 300 nm being assigned to the π–π* local excitation of carbazole moieties, whereas HFBMA95 presents an absorption band in the UV region.
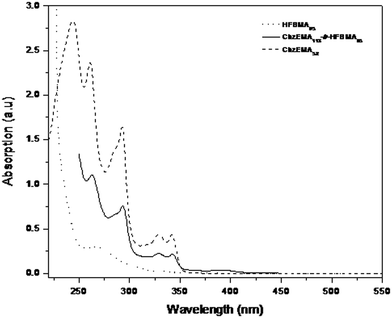 | ||
| Fig. 11 UV-vis spectra of the CbzEMA52 and HFBMA95 homopolymers and the CbzEMA113-b-HFBMA52 diblock copolymers recorded in THF. | ||
Room temperature photoluminescence (PL) measurements were carried out on the Au-coated silicon substrates prior and after the immersion of the latter in the polymer solution for 24 h, in order to verify the anchoring of the polymers onto the Au surfaces. Fig. 12(a) presents the PL emission spectra recorded in the absence and presence of anchored polymer chains after 24 h immersion of the substrates in the polymer solution. Furthermore, time resolved PL at the peak of the signal (i.e. at 450 nm) is presented in Fig. 12(b). Clearly seen from the data, the Au appears to have almost zero PL whereas the CbzEMA52-b-HFBMA69 PL emission is much stronger under identical excitation conditions and depends on the sample position (see PL for spot 1 and spot 2).
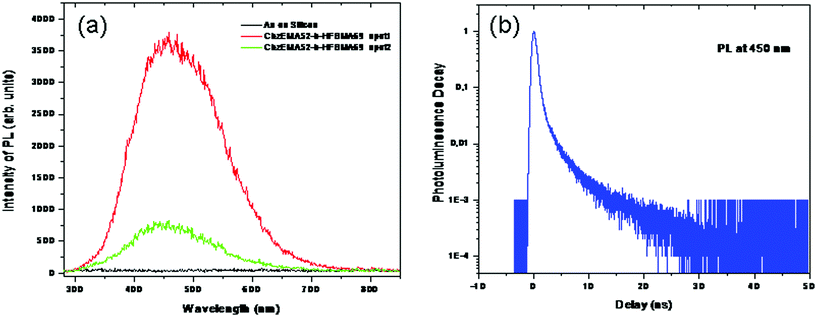 | ||
Fig. 12 (a) PL spectra of Au-coated silicon substrate and CbzEMA52-b-HFBMA69 –S–C![[double bond, length as m-dash]](https://www.rsc.org/images/entities/char_e001.gif) S-/Au-coated silicon substrate (recorded at different sample positions). (b) Time resolved PL at the peak of the signal (i.e. at 450 nm). S-/Au-coated silicon substrate (recorded at different sample positions). (b) Time resolved PL at the peak of the signal (i.e. at 450 nm). | ||
It is noteworthy to emphasize at this point that the spectral profile is the same over the entire sample. The observed differences in the intensity of the signal at different positions onto the sample may suggest that the polymer is not evenly distributed onto the substrate. The latter has been confirmed by AFM characterization of the resulting films. Fig. 13 shows the AFM measured surface features of the analyzed films covering an area of 250 nm × 250 nm and 500 nm × 500 nm. The change of colors over the image indicates the thickness variation. The heights of the surface features are represented with the brighter pixel whereas the dark pixel indicates the valleys. As shown in Fig. 13, the distribution of the polymer onto the substrate is uneven. The polymer film roughness varies between 6 and 12 nm.
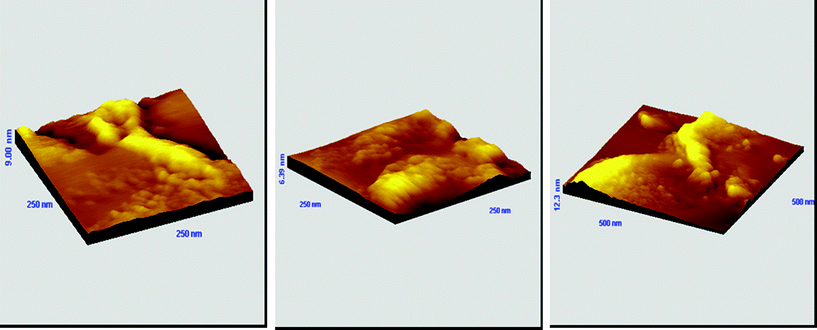 | ||
| Fig. 13 AFM 3D-graph topography images of a gold substrate immersed in a THF solution of CbzEMA52-b-HFBMA69 (2 g L−1) at room temperature for 24 h. | ||
In the case of the Au-coated silicon substrate covered with polymer chains it is clearly observed that the “monomer” emission peaks appearing at 348 and 365 nm in the case of the CbzEMAx homopolymers47 do not exist, whereas an emission peak at ∼435 nm appears instead. In general as stated by Keyanpour-Rad et al.,47 the fluorescence emission expected for “monomer” emission is a mirror image of the 1Lb ← 1A absorption band, resulting from the singlet state of an excited carbazolyl chromophore that does not interact strongly with a neighbouring chromophore. It is likely that the anchoring of the dithioester-functionalized CbzEMA52-b-HFBMA69 diblock copolymer chains onto the Au surface resulted in the generation of a parallel overlap interchromophore geometry allowing for excimer formation to occur. Similarly, Keyanpour-Rad and co-workers have demonstrated the excimer formation in solution at different λmax excimer wavelengths ranging between 418–440 nm (depending on the solvent system used) for a polymethacrylate containing side-chain electroactive carbazole moiety namely poly([2-(9-ethyl)carbazolyl]methyl methacrylate), due to favourable steric constrains. Moreover, it has been found that the latter becomes much more pronounced when the polymer chain is immobilized in a rigid matrix.47
For applications involving gas sensing and optoelectronics it is of paramount importance to use active surfaces characterized by uniformity and homogeneity. Examples appearing in the literature reporting on the effect of film thickness on gas sensing properties48 and optoelectronic behavior49 support the above-mentioned. V. Koutsos and co-workers have investigated the structural regimes of thiol-end-functionalized polystyrene monolayers by means of scanning force microscopy.50 Upon using longer incubation times i.e. exposing the gold-coated substrates to polymer solutions for longer time periods, higher surface coverage is obtained. The latter significantly affected the morphology adopted by the collapsed polymer chains onto the surface. Consequently, in an effort to improve the film uniformity, new samples were prepared upon immersing the gold-coated silicon substrates in the polymer solution for 48 h. AFM characterization of the resulting films (Fig. 14) indicated the generation of monolayers characterized by higher uniformity. However, a more systematic investigation toward this direction is required for obtaining films of high quality, allowing the future exploitation of these materials in gas sensing and optoelectronic applications.
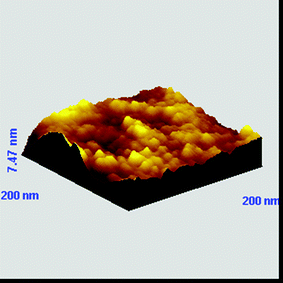 | ||
| Fig. 14 AFM 3D-graph topography images of a gold substrate immersed in a THF solution of CbzEMA52-b-HFBMA69 (2 g L−1) at room temperature for 48 h. | ||
Conclusions
In the present work, well-defined diblock copolymers consisting of 2-(N-carbazolyl)ethyl methacrylate (CbzEMA) and 2,2,3,3,4,4,4-heptafluorobutyl methacrylate (HFBMA) units have been successfully synthesized and characterized in regards to their molecular characteristics and thermal properties. Due to the presence of dithioester end-groups onto the diblock copolymer chains generated by RAFT controlled radical polymerization, their immobilization onto Au-coated silicon substrates has been accomplished via anchoring of the sulfur-containing end-groups onto the Au surfaces. The PL data revealed that excimer formation occurs suggesting that the immobilization of the polymer chains onto the Au-coated silicon substrate may assist their arrangement into a parallel geometry, allowing for interchromophore overlapping and thus excimer generation. The combination of a low-surface energy fluorinated block, with an electro-active carbazole-containing segment imparts to these immobilized thin layers useful properties towards their potential applicability in gas sensing technologies.Acknowledgements
This work was financially supported by the University of Cyprus. We are grateful to Professors Costas S. Patrickios and Panagiotis Koutentis (Chemistry Department, University of Cyprus) for providing access to the DSC and TGA respectively. We also thank Dr Matthew Zervos (Department of Mechanical and Manufacturing Engineering, University of Cyprus) for the fabrication of the Au-coated silicon substrates. Finally, we thank the A. G. Leventis Foundation for a generous donation that enabled the purchase of the NMR spectrometer of the University of Cyprus.References
- E. Bundgaard and F. Krebs, Macromolecules, 2006, 39, 2823–2831 CrossRef CAS.
- H. Ximin, G. Feng, T. Guoli, D. Hasko, N. Greenham and H. Wilhelm, Nano Lett., 2010, 10, 1302–1307 CrossRef.
- N. Tessler, V. Medvedev, M. Kazes, S. Kan and U. Banin, Science, 2002, 295, 1506–1508 CrossRef.
- M. P. de Jong, L. J. van Ijzendoorn and M. J. A. de Voigt, Appl. Phys. Lett., 2000, 77, 2255–2258 CrossRef CAS.
- B. Ong, W. Yiliang, L. Yuning, L. Ping and P. Hualong, Chem.–Eur. J., 2008, 14, 4766–4778 CrossRef CAS.
- L. Torsi, N. Cioffi, C. Di Franco, L. Sabbatini, P. G. Zambonin and T. Bleve-Zacheo, Solid-State Electron., 2001, 45, 1479–1485 CrossRef CAS.
- L. Xikui and J. Ming, Angew. Chem., 2006, 118, 3930–3934 CrossRef.
- M. Bader and G. Marowsky, J. Opt. Soc. Am. B, 2002, 19, 2250–2262 CrossRef CAS.
- C. Gu, Y. Xu, Y. Liu, J. Pan, F. Zhou and H. He, Opt. Mater., 2003, 23, 219–227 CrossRef CAS.
- H. Chun, J. Won-Jae, K. Nam-Jun, M. In Kyu and N. Kim, J. Appl. Polym. Sci., 2003, 89, 368–372 CrossRef CAS.
- M. Gerad, A. Chaubey and B. Malhotra, Biosens. Bioelectron., 2002, 17, 345–359 CrossRef.
- J. M. Charlesworth, A. C. Partridge and N. Garrard, J. Phys. Chem., 1993, 97, 5418–5423 CrossRef CAS.
- A. S. Brar and S. Gandhi, J. Mol. Struct., 2007, 832, 26–37 CrossRef CAS.
- L. Zheng-hong, H. Teng-yun, Y. Haijiang and D. Lizong, Macromol. React. Eng., 2008, 2, 398–406 CrossRef.
- J. V. Grazulevicius, P. Strohriegl, J. Pielichowski and K. Pielichowski, Polym. Adv. Technol., 2006, 17, 694–696 CrossRef CAS.
- T. Malinauskas, I. Vilionskiene, J. Grazulevicius, V. Getautis, J. Reina and J. Sidaravicius, Polym. Int., 2008, 57, 1159–1164 CrossRef CAS.
- B. Ameduri and B. Boutevin, J. Fluorine Chem., 1999, 100, 97–116 CrossRef CAS.
- B. Ameduri and B. Boutevin, J. Fluorine Chem., 2000, 104, 53–62 CrossRef CAS.
- L. Zheng-hong and H. Teng-yun, React. Funct. Polym., 2008, 68, 931–942 CrossRef.
- Q. Y. Wang, Q. H. Zhang, X. L. Zhan and F. Q. Chen, Progress in Chemistry, 2009, 21, 2183–2187 CAS.
- C. W. Extrand, J. Fluorine Chem., 2003, 122, 121–124 CrossRef CAS.
- N. M. L. Hansen and K. S. Hvilsted, Eur. Polym. J., 2007, 43(2), 255–293 CrossRef CAS.
- Y. Hao, M. Zhang, J. Xu, C. Liu and P. Ni, J. Macromol. Sci., Part A: Pure Appl. Chem., 2010, 47, 941–951 CrossRef CAS.
- W. Du, Y. Li, A. M. Nyström, C. Cheng and K. L. Wooley, J. Polym. Sci., Part A: Polym. Chem., 2010, 48(15), 3487–3496 CrossRef CAS.
- X. Tang, N. Han and D. Zhou, Adv. Mater. Res., 2010, 87–88, 36–40 CAS.
- K. A. Ibrahim, A. Al-Muhtaseb and J. Seppälä, Polym. Int., 2009, 58, 927–932 CrossRef CAS.
- L. Valtola, S. Hietala, H. Tenhu, P. Denifl and C. E. Wilen, Polym. Adv. Technol., 2009, 20, 225–234 CrossRef CAS.
- R. Shunmugam, C. E. Smith and G. N. Tew, J. Polym. Sci., Part A: Polym. Chem., 2007, 45, 2601–2608 CrossRef CAS.
- J. Chiefari, Y. K. Chong, F. Ercole, J. Kristina, J. Jeffery, R. T. A. Mayadunne, G. Meijs, C. L. Moad, G. Moad, E. Rizzardo and S. H. Thang, Macromolecules, 1998, 31, 5559–5562 CrossRef CAS.
- G. Moad, E. Rizzardo and S. H. Thang, Aust. J. Chem., 2009, 62, 1402–1472 CrossRef CAS.
- T. Krasia and C. Patrickios, Polymer, 2002, 43, 2917–2920 CrossRef CAS.
- P. Zhao, Q. Ling, W. Wang, J. Ru, S. Li and W. Huang, J. Polym. Sci., Part A: Polym. Chem., 2007, 45, 242–252 CrossRef CAS.
- Y. S. Cho, J. S. Lee and G. J. Cho, Polymer, 2002, 43, 1197–1202 CrossRef CAS.
- M. Ohoka, J. Kuno, K. Yamashita, H. Ohkita, S. Ito, Y. Tsujii and T. Fukuda, Kobunshi Ronbunshu, 2002, 59, 421–426 CrossRef CAS.
- T. P. T. Le, G. Moad, E. Rizzardo and S. H. Thang, PCT. Int. Appl. WO 9801478 Al 980115, Chem. Abstr., 1998, 128, 115390 Search PubMed.
- S. Ito, S. Ohmori and M. Yamamoto, Macromolecules, 1992, 25, 185–191 CrossRef CAS.
- F. Du, Z. Li, W. Hong, Q. Gao and F. Li, J. Polym. Sci., Part A: Polym. Chem., 2000, 38, 679–688 CrossRef CAS.
- J. M. Stouffera and T. J. McCarthy, Macromolecules, 1998, 21, 1204–1208 CrossRef.
- J. Ballato, D. Smith, M. Ellison and R. Gregory, National Textile Center Annual Report, 2001, M01-C01, 1–7 Search PubMed.
- Z. Luo, H. Yu and W. Zhang, J. Appl. Polym. Sci., 2009, 113, 4032–4041 CrossRef CAS.
- E. Pouget, F. Ganachaud and B. Boutevin, Silicon Based Polymers, 2008, Part 1, 85–98 CrossRef.
- T. Krasia, H. Schlaad and C. Patrickios, Macromolecules, 2001, 34, 7585–7588 CrossRef.
- P. Zhao, Q. Ling, W. Wang, J. Ru, S. Li and W. Huang, Journal of Polymer Science, 2007, A45, 242–252 Search PubMed.
- J. Gordon, J. Ballato, J. Jin, W. Dennis and Jr. Smith, Journal of Polymer Science, 2006, 44, 1592–1596 CAS.
- H. Nakashima, K. Furukawa, K. Ajito, Y. Kashimura and K. Torimitsu, Langmuir, 2005, 21, 511–515 CrossRef CAS.
- C.-A. Fustin and A.-S. Duwez, J. Electron Spectrosc. Relat. Phenom., 2009, 172, 104–106 CrossRef CAS.
- M. Keyanpour-Rad, A. Ledwith, A. Hallam, A. M. North, M. Breton, C. Hoyle and J. E. Guillet, Macromolecules, 1978, 11, 1114–1118 CrossRef CAS.
- G. Sakai, N. S. Baik, N. Miura and N. Yamazoe, Sens. Actuators, B, 2001, 77, 116–121 CrossRef.
- P. Prathap, N. Revathi, Y. P. Venkata Subbaiah and K. T. Ramakrishna Reddy, J. Phys.: Condens. Matter, 2008, 20, 035205 CrossRef.
- V. Koutsos, E. W. van der Vegte and G. Hadziioannou, Macromolecules, 1999, 32, 1233–1236 CrossRef CAS.
| This journal is © The Royal Society of Chemistry 2012 |
