Dual substitutions of single dopant Cr3+ in perovskite NaTaO3: synthesis, structure, and photocatalytic performance†
Yiguo
Su
a,
Shuwei
Wang
a,
Yue
Meng
b,
Hui
Han
a and
Xiaojing
Wang
a
aCollege of Chemistry and Chemical Engineering, Inner Mongolia University, Huhehaote City, 010021, P. R. China. E-mail: wang_xiao_jing@hotmail.com; Fax: +86 471 4992981; Tel: +86 471 4994406
bInner Mongolia Experiment Research Institute of Geology and Resources, Huhehaote City, 010021, P. R. China
First published on 25th October 2012
Abstract
This work explores a solution route to the dual substitutions of a single dopant in a perovskite lattice, different from the sole substitution when using traditional solid state reactions. A series of NaTaO3 nanoparticles doped with Cr3+ were first synthesized by a hydrothermal method. The pure orthorhombic perovskite phase was retained regardless of the Cr3+ doping. At a lower doping level, <2.47 mol% Cr3+, Cr3+ primarily occupied the Ta5+ sites, creating certain oxygen vacancies. Strikingly, above this doping level, Cr3+ started to simultaneously substitute for both Na+ in 12-fold coordination sites and Ta5+ in 6-fold coordination states of the perovskite NaTaO3. This dual substitution is further indicated to give an increased surface area and a decreased bandgap energy. Even so, the higher dopant concentration resulted in a significant decrease in photocatalytic activity. These results were rationalized by theoretical simulation of the energy band structure using density functional theory, which unfolded that Na+ and Ta5+ doping by Cr3+ ions leads to the formation of new intermediate bands below the bottom of the conduction band, mainly due to the Cr 3d state, while the valence band was broadened due to the hybridization between the Cr 3d and O 2p states. Both factors made the absorption edge red-shift and increased the absorption coefficient in the visible region.
Introduction
Perovskite oxides have received much attention due to their interesting superconductivity, catalytic characteristics, oxygen cathode reduction, and the electromagnetic properties.1–3 There are two distinct cationic sites in a perovskite structure, in which the A-site is coordinated by 12 O2−, and is preferentially occupied by relatively large cations, while the B-site is occupied by relatively small cations with a coordination of 6. Thus a variety of doping combinations at the A or B-sites are possible. Due to a large radius difference between A and B-site ions, the dopants can be selectively located at the A or B sites, which determines some other native properties. Site-selective doping can be used to accurately control the physicochemical properties of these oxides by selecting a suitably-sized or suitably-charged dopant to produce certain oxygen vacancies and defects.4–8 For example, Lakshminarayanan et al. found that the oxygen transition properties were significantly enhanced through additional oxygen vacancy generation by doping divalent cations at B sites for La0.6Sr0.4(Co0.18Fe0.72X0.1)O3–1 particles.4 Zeng et al. investigated the influence of Sc3+ doping in B-sites of SrCoO3−δ on its lattice structure, phase stability, electrical conductivity, and cathode performance. They found that introduction of a large-size Sc3+ (0.745 nm) led to a substantial stabilization of the cubic phase of SrCoO3−δ, even at a Sc3+ doping amount as low as 5 mol%.5 Noticeable lowering of energy gaps has been achieved for the layered perovskite K2La2Ti3O10 as a result of the incorporation of Sn2+ and N3− ions.6 The improved activities toward H2 production under visible light absorption were obtained by codoping of La and Cr in NaTaO3.7 It should be mentioned that doped perovskite oxides were usually synthesized by solid state reactions, especially for the dual doping at the A and B-sites simultaneously, in which a long calcination time at higher temperatures and huge energy consumption are required. In these cases, selective substitutions at the A or B-sites cannot be well controlled as desired. In this work we used a perovskite structure compound of NaTaO3 as a model compound to study simultaneous selective doping at the A and B sites by a single cation using a facile hydrothermal method.It is well documented that NaTaO3 is superior over other semiconductors, such as TiO2, in photocatalytic oxidation due to its very positive electrochemical potential, which allows NaTaO3-based photo-catalysts to be more efficient in photo-splitting water to produce hydrogen and for photo-degradation of organic substances.9–13 However, these applications are seriously limited by the intrinsic wide energy gaps of 4.0 eV for NaTaO3, and thus NaTaO3 materials can only work under ultraviolet light. Therefore, to fulfil the application of NaTaO3 as a photocatalytic material, one of the great challenges is to achieve a higher absorption coefficient in the visible region for the effective utilization of sunlight. The doping of a foreign element into the active photocatalysts in order to make a donor or an acceptor level in the forbidden band is one of the ways to meet this objective.14–21 For example, Bi-doped NaTaO3 solid solution,22 Cr-La-codoped NaTaO3 system23 have been successfully prepared for visible light driven hydrogen evolution. Orthorhombic NaTaO3 is a close packed structure with Na+ ions within the corner connected to a TaO6 octahedral framework. Thus, the substitutional doping of metal ions at Na or Ta or both Na and Ta sites is possible under appropriate synthesis conditions. The photocatalytic properties of NaTaO3 would significantly change with the substitution site of the dopant ions in the lattice.22 Therefore, the dual substitution of trivalent ions at both Na and Ta sites may keep the charge balance, create midgap states and tune the photocatalytic activities of NaTaO3. Here the samples containing Cr3+, which is simultaneously incorporated in the A and B sites of NaTaO3, were synthesized. It is found that the dual substitution of Cr3+ at A and B sites can balance the charge and inhabit oxygen vacancy generation, and thus influence the photocatalytic properties of NaTaO3 nanoparticles.
2. Details of experiments and calculations
NaTaO3 nanoparticles were prepared by a simple hydrothermal method. 0.442 g Ta2O5, 9.0 g NaOH, and 22.5 mL deionized water were fully mixed with magnetic stirring and then added into a Teflon-lined autoclave with a capacity of 30 mL. The autoclave was sealed and maintained at 200 °C for 24 h. After naturally cooling to room temperature in air, the mixture was filtered and washed with distilled water, and then dried in air at 60 °C for 12 h. A white crystalline powder of NaTaO3 products was obtained in high purity, as examined by XRD.The chromium doped NaTaO3 nanoparticles were prepared by methods similar to that for NaTaO3 nanoparticles. A mixture of 0.442 g Ta2O5 and given amount of Cr2O3 was added into a Teflon-lined autoclave of 30 mL together with 9.0 g NaOH and 22.5 mL deionized water. The amount of Cr3+ is 5%, 10%, 20%, 30%, 40%, 50% in a weight ratio to that of the tantalum source. The suspension was stirred for 1 h. Then, similar to the procedure to prepare NaTaO3 nanoparticles, the autoclave was sealed and maintained at 200 °C for 24 h. After naturally cooling to room temperature in air, the mixture was filtered and washed with distilled water, and then dried in air at 60 °C for 12 h. A series of crystalline white powders of chromium doped NaTaO3 products were obtained. The Cr3+ ion content in the products was 2.47 mol%, 4.31 mol%, 5.24 mol%, 6.13 mol%, 6.35 mol%, and 6.39 mol% in a molar ratio, which were determined using a GBC-Avanta atomic absorption spectrophotometer. The products were denoted as NaTaO3, 2.47Cr–NaTaO3, 4.31Cr–NaTaO3, 5.24Cr–NaTaO3, 6.13Cr–NaTaO3, 6.35Cr–NaTaO3, and 6.39Cr–NaTaO3.
The structure and crystallinity of NaTaO3 and Cr-doped NaTaO3 specimens were characterized by powder X-ray diffraction (XRD) on a D8 Advance Bruker X-ray diffractometer with monochromatized Cu-Kα radiation (λ = l.5416 Å). The morphology of the samples was explored by a JEM-2010 transmission electron microscope (TEM) and high resolution transmission electron microscopy (HRTEM). X-ray photoelectron spectroscopy (XPS) analysis was carried out by using an Amicuso (KRATOS, English) with a monochromatic Al KR source of 1486.6 eV and a charge neutralizer. All binding energies were referred to the C 1s peak at 284.8 eV of the surface adventitious carbon and revised. The Brunauer–Emmett–Teller (BET) surface area was measured by ASAP 2010 V5.02H. The absorbed gas was nitrogen. A diffusive reflectance UV-Vis spectrophotometer (UV-Vis, Perkin-Elmer Lambda35) was employed to measure the UV-Vis absorption and to estimate the band gap of the samples. BaSO4 was taken as the reference sample, and the spectra were recorded in the range of 200–1100 nm. The band gap of the samples was estimated from the onset of the absorption using the formula Eg (eV) = 1240/λg (nm).
The electron and energy band structure of NaTaO3 and chromium doped NaTaO3 crystals were calculated by density functional theory. Lattice parameters and atomic positions of NaTaO3 were optimized by minimizing the total energy with the Material Stadio CASTEP package (Accelrys). The Perdewe–Burkee–Ernzerh (PBE) exchange–correlation functional of generalized gradient approximation was employed. Wave functions of the valence electrons were expanded to a basis set of plane waves within specified cutoff energy (Ecut = 350 eV). Atomic positions of Cr-doped NaTaO3 were optimized based on the theoretical lattice constants of NaTaO3 without imposing any symmetry. The energetic convergence threshold for self-consistent iteration was set at 5 × 10⁻⁷ eV and structural relaxation is carried out until all components of the residual forces were smaller than 0.01 eV Å−1. The total density of states (TDOS) and the projected density of states (PDOS) for non-doped NaTaO3 and Cr-doped NaTaO3 were calculated using the tetrahedron method with Blochl corrections.
Photocatalytic activities of the samples were evaluated by the decomposition of methylene blue (MB) under visible-light irradiation with a SGY-II photochemical reactor. A 500 W Xe lamp (λ > 420 nm) was placed inside the reactor after carefully removing the outer shell. Water was circulated through the annulus to avoid heating during the reaction. The initial concentration of MB was about 2 × 10⁻⁴ mol L−1. The weighed amount of the catalyst used was 50 mg, and all the experiments were performed in the natural pH of the MB solution. The suspension was stirred continuously for 120 min in the dark before reaction. When the MB concentration became constant, light irradiation started which lasted for two hour. The absorbency of the sample solution was detected volumetrically at certain times with a UV-visible spectrometer (UV-7504PC, China) and was used to calculate the photodegradation rate of the MB.
3. Results and discussion
Sodium hydroxide (NaOH) has been frequently utilized as the mineralizing agent for preparing various nanocrystals. According to previous literature, high NaOH concentration favored the transformation of commercial Ta2O5 to alkaline hydroxylated Ta–O ionic groups during the hydrothermal process.24 Meanwhile, high NaOH concentration can promote the dissolution of Cr2O3 into alkaline hydroxide solution. These hydroxylated Ta–O ionic groups and alkaline hydroxide solution were the building blocks for the construction of Cr doped NaTaO3 and facilitated the incorporation of Cr ions into the NaTaO3 host matrix for a high doping level. On the other hand, under high NaOH concentration and high hydrothermal temperature, Cr is commonly shows higher oxidation states. It is then highly necessary to make clear the occupation-site and charge state of Cr in NaTaO3 nanocrystals. Due to huge ionic radius difference and Pauling's electronegativity deviation between Ta5+ and Cr6+,25 the charge state of Cr in NaTaO3 nanocrystals is mainly +3, which can also be verfied by the following XPS result. To further speculate the occupation site of Cr3+, XRD measurements should be carried out. Fig. 1a shows the XRD patterns of NaTaO3 samples doped with different amounts of Cr ions. All diffraction peak positions were corrected using the standard of Si. The diffraction peaks of all samples can be readily indexed as a pure orthorhombic phase of NaTaO3, identical to the standard diffraction data reported in JCPDS cards (25–0863). There are no diffraction lines originated from chromium related impurity phases, implying that chromium could be incorporated in the lattice of NaTaO3 without apparent structural changes. Careful examination of the diffraction peak positions with different Cr amounts led to two important implications: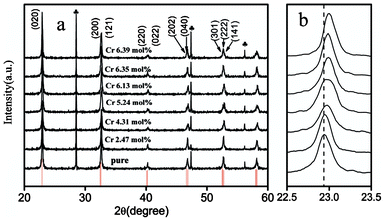 | ||
Fig. 1 (a) XRD patterns of pure and Cr3+ doped NaTaO3 nanocrystals. Symbol  represents the diffraction lines of internal standard Si. Bracketed numbers are the Miller indices for specific crystal faces. (b) Enlarged diffraction line (020) for pure and Cr3+ doped NaTaO3 nanocrystals. represents the diffraction lines of internal standard Si. Bracketed numbers are the Miller indices for specific crystal faces. (b) Enlarged diffraction line (020) for pure and Cr3+ doped NaTaO3 nanocrystals. | ||
(i) Cr3+ ions tend to occupy the lattice site of Ta5+ at doping level <2.47 mol%, which is indicated by the similar positions of diffraction line (020) for x = 0 and 2.47 mol%. Actually when the majority of Cr3+ ions are incorporated into the lattice by substituting Ta5+, oxygen vacancies will be generated. The radius of 0.069 nm for Cr3+ is slightly larger than that of 0.064 nm for Ta5+,26 and therefore, Cr3+ substitution for Ta5+ will lead to a lattice expansion. Nevertheless, the presence of oxygen vacancies will give rise to a slight lattice shrinkage. As a result, lower Cr3+ substitution for Ta5+ has no apparent impact on the lattice dimensions.
(ii) Higher doping of Cr3+ might lead to dual substitutions for Na+ and Ta5+ with less oxygen vacancies, as indicated by the systematic shifts of the diffraction peak (020) towards higher diffraction angles (Fig. 1b). Meanwhile, the lattice volume of NaTaO3 contracted monotonically from 234.23 Å3 to 232.28 Å3 with the increase of Cr3+ dopant concentration. This is because Cr3+ is much smaller than Na+ (0.1032 nm), while slightly larger than Ta5+ (0.064 nm). In addition, there will no lattice shrinkage from oxygen vacancies since dual substitutions of Cr3+ for Ta5+ and Na+ can keep the charge balance with no generation of oxygen vacancies and cause minimum distortion in the lattice. Thus, occupancy at both sites would be energetically favorable. However, it should be noted that the (020) diffraction peak of the 5.24Cr–NaTaO3 sample was abnormally broadened, as indicated by Fig. 1b. Two main factors, including particle size and structural deformation, might be responsible for this observation. It is well-accepted that the diffraction peak of nanocrystalline materials can be significantly broadened with the reduction of particle sizes. For the present 5.24Cr–NaTaO3 sample, the particle size as indicated by TEM observations (Fig. S1†) is much closer to that observed in 4.31Cr–NaTaO3. This observation means that particle size contributes little to the broadening of the (020) diffraction peak. As documented in many oxide systems, the structural deformation might result in diffraction peak splitting.27,28 According to XRD analysis, Cr3+ favored replacement of Ta5+ at low dopant concentration and to substitute at both Na+ and Ta5+ sites at higher dopant concentration. Though dual substitutions are energetically favorable, it is inevitable that some dopant Cr3+ ions would prefer to solely locate at Ta5+ sites rather than at both Na+ and Ta5+ sites due to the huge ionic radius mismatch between Cr3+ and Na+ ions. This type of doping can create a certain concentration of oxygen vacancies. Cr3+ located at both Na+ and Ta5+ site as well as the resulting oxygen vacancies would lead to structural deformation and the subsequent diffraction peak splitting. Finally, it is expected that the balance between sole and dual substitutions are responsible for the XRD observations.
The oxidation states of the dopant Cr ions in NaTaO3 were investigated by XPS. As depicted in Fig. 2a, XPS spectra of NaTaO3 with and without Cr doping indicated the existence of Ta, O, and Cr elements. All binding energies were corrected by the C 1s signal at 284.8 eV. XPS peaks of Ta 4f appeared at 27.0 eV for both samples. Two weak peaks at 577.5 and 587.1 eV were assigned to Cr3+ 2p3/2 and Cr3+ 2p1/2, respectively under Cr3+ doping (inset of Fig. 2a).14 Only trivalent Cr3+ existed for the doped samples, while no traces of Cr6+ were detected. This result is different from what is reported in the literature when using solid state reactions.29,30Fig. 2b shows the O 1s spectra for the samples with and without Cr3+ doping. It is seen that O 1s shows a major peak around 529.2 eV for pure NaTaO3 and 530.1 eV for 4.31Cr–NaTaO3. Further increase of Cr3+ leads to a continuous blue shift of the binding energy for the O 1s peak. Such behaviour is thought to be mainly related to the difference in electronegativity of Cr3+, Na+ and Ta5+, oxygen vacancies and lattice distortion. Generally, by ignoring for a moment the influences of particular structures, one may consider a mixed metal oxide to result in the creation of three-dimensional lattice structures containing M–O–M′ bonds. It is proper to consider the bonds realized in oxide formation to be mixed ionic/covalent bonds. The interjection of a different M′′ unit (M′′, with a different electronegativity) to creat M–O–M'', polarizes the bonding chemistry around the oxygen. Smart and Biesinger et al.31,32 systematically investigated the influence of electronegativity of the ligands on XPS binding energies. They found that the binding energies of ions increased with the increase of the average electronegativity of the ligand. The electronegativity of Cr (1.66) is close to that of Ta (1.5), but higher than that of Na (0.93). Thereby, the chemical shift in the binding energy of the O 1s spectra for both samples may be attributed to the replacement of Na–O and Ta–O bonds by Cr–O bonds in the doped samples. If Cr atoms replaced Na and Ta atoms, the electron shielding effect of the oxygen inner orbital was weakened due to the reducing electron density, and the interaction between the inner orbital electrons and the atomic nucleus is strengthened. On the other hand, oxygen vacancies and lattice distortion may also alter the chemical bonding,33,34 which in turn leads to changes in the XPS binding energies. For instance, Palmqvist and coworkers studied Ca2+, Nd3+, and Pb2+ doped CeO2 and found that oxygen vacancies can cause the O 1s XPS peak to be shifted to higher binding energies.33 On the basis of XRD analysis, Cr3+ doping led to a certain concentration of oxygen vacancies and structural deformation, which would certainly have consequences on XPS binding energies. As a result, it is concluded that the combination of different electronegativites of Cr3+, Na+, Ta5+ ions, oxygen vacancies and lattice distortion resulted in the blue shift of binding energies for O atoms in the XPS spectra.
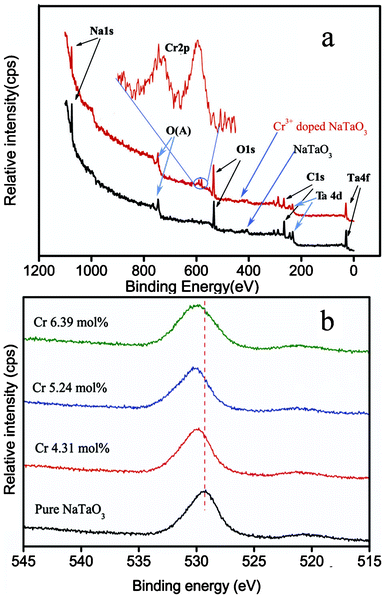 | ||
| Fig. 2 (a) XPS spectra and (b) core level spectra of O 1s of NaTaO3 with different dopant levels of Cr3+. | ||
Dual substitutions of Cr3+ for Na+ and Ta5+ did not apparently alter the particle shape, but reduced particle dimensions and increased surface area. Fig. 3 shows TEM images of the samples with and without Cr3+ doping. It is clear that the undoped sample was well crystallized in a cubic morphology (Fig. 3a). With increasing the doping level of Cr3+ to 4.31 mol%, the morphology varied to show an aggregation constructed by finer particles with irregular surfaces (Fig. 3b). This observation is further confirmed by the increased surface area: The specific surface area for 2.47Cr doping was 13.17 m2 g−1, which increased to 18.37 m2 g−1 for 4.31Cr-doping, both of which are about 10 times larger than that of the 1–3 m2 g−1 reported when prepared using solid state reaction method.7,35 Further HRTEM images showed that the pure NaTaO3 sample has a lattice spacing of 0.3880 nm for the crystal plane (020) of the orthorhombic cell, which slightly reduced to that of 0.3763 nm for 4.31Cr-doping. This result further confirms our XRD analysis above, where the lattice volume reduces as the doping level increases.
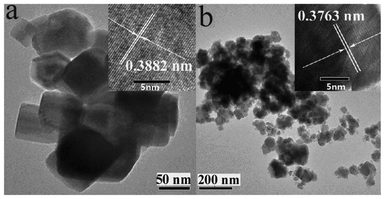 | ||
| Fig. 3 TEM images of NaTaO3 nanocrystals (a) without doping and (b) with doping of 4.31 mol% Cr3+. Insets show the corresponding high resolution TEM images. | ||
Therefore, the observations based on XRD, TEM, HRTEM, and XPS demonstrate that Cr3+ exists possibly in two different states in our samples: At the lower doping level <2.47 mol%, Cr3+ would partly substitute for Ta5+ in the NaTaO3 matrix, and the replacement of Ta5+ by the similar radius Cr3+ did not result in the clearly distorted crystal structure. At the high doping level >2.47 mol%, a small part of the Cr3+ ions may also substitute for Na+, which would decrease the lattice cell parameters, and is responsible for the contractive cell volume.
Optical diffuse reflectance spectra were examined under Cr doping in NaTaO3. As shown in Fig. 4, un-doped NaTaO3 showed a steep absorption at 300 nm, indicating the direct band gap energy of 4.13 eV with an excitation from O 2p to Ta 5d. With increasing the doping level of Cr3+, a systematic red-shift of the absorption edge and appearance of two broad absorptions in the range 400–750 nm were observed with increased intensities. Furthermore, the band gap energy decreased from 4.13 eV for undoped sample to 3.14 eV for doping 6.39 mol% Cr3+ (Table 1). The absorption observed in the range 400–500 nm is ascribed to the charge transfer from the 3d orbital of Cr3+ to the 5d orbital of Ta5+, while that ranging from 550–750 nm characterizes the d–d transition of 4A2→4T2 for Cr3+.7,19
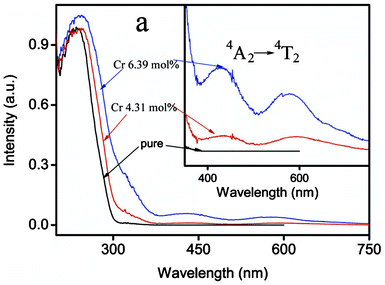 | ||
| Fig. 4 Diffuse reflectance spectra of NaTaO3 with different doping levels of Cr3+. | ||
| Sample | Onset/nm | E g/eV |
|---|---|---|
| NaTaO3 | 300 | 4.13 |
| 2.47Cr–NaTaO3 | 314 | 3.95 |
| 4.31Cr–NaTaO3 | 325 | 3.82 |
| 5.24Cr–NaTaO3 | 340 | 3.65 |
| 6.13Cr–NaTaO3 | 360 | 3.44 |
| 6.35Cr–NaTaO3 | 378 | 3.28 |
| 6.39Cr–NaTaO3 | 395 | 3.14 |
All the above experiments have demonstrated the dual substitutions of single dopant Cr3+ for Na+ and Ta5+ at higher doping levels. It is well documented that oxygen vacancies in semiconductors can have some impact on the photocatalytic activities. Here, the photocatalytic activities of NaTaO3 with different doping levels of Cr3+ were examined by de-colorization of methylene blue (MB) solutions. As indicated in Fig. 5, undoped NaTaO3 showed an excellent photocatalytic activity, which increased with slightly increasing the doping level. For instance, at a doping level of 2.47 mol% Cr3+, the degradation rate of MB became up to 70% after visible-light irradiation for 200 min. This result is consistent with the presence of certain oxygen vacancies when Cr3+ was primarily doped at the Ta5+ site at lower doping levels. Further increasing the doping levels led to the decrease in the photocatalytic activities. Nevertheless, it is also noted that there existed relatively larger specific surface areas and systematic decreased band gap energy at higher doping levels, which are beneficial for photocatalytic degradation, which is different from the trend we observed in Fig. 5. On the basis of the above results, Cr3+ showed both sole and dual substitutions in the NaTaO3 host lattice. Sole substitution can create a certain concentration of oxygen vacancies that are advantageous to the enhancement of photocatalytic properties.36,37 Dual substitutions keep a charge balance with no oxygen vacancies. Cr3+ ions with higher concentration at both Na+ and Ta5+ sites may also serve as a recombination center, and thus diminish the overall photocatalytic activity of Cr3+ doped NaTaO3 nanocrystals, which is similar to that observed in metal ion doped TiO2 nanocrystals.38 Thus, it is supposed that by keeping the charge balance dual substitutions may mainly work as the recombination centers for photo-generated holes and electrons by reducing oxygen vacancies and creating certain mid gap states between the valance band and conduction band.
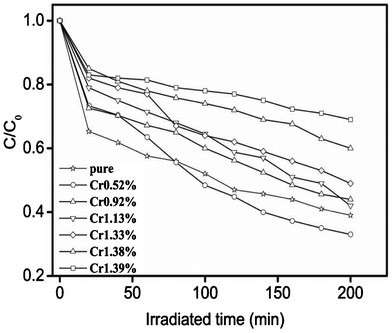 | ||
| Fig. 5 Degradation curves of methylene blue solution under UV-light irradiation over NaTaO3 when doped with different amounts of Cr3+. | ||
The band structure and density of states of NaTaO3 and Cr-doped NaTaO3 are calculated using CASTEP code with an aim to investigate the doping effect of Cr3+. On the basis of the orthorhombic NaTaO3 unit cell, the 2 × 2 × 1 supercell containing 40 atoms is adopted for pure NaTaO3. Three different doping models based on this supercell are considered: One model is obtained by replacing one Ta site with a Cr atom (denoted as Cr@Ta), the other one replacing one Na site with a Cr atom (denoted as Cr@Na), and the dual substitute model was set up by substituting both Na and Ta with Cr atoms denoted as Cr@(Ta,Na) (Fig. 6). The optimized lattice parameters are a = b = 5.5444 Å and c = 7.8552 Å for pure NaTaO3, in good agreement with the experimental results.39 Just like that reported elsewhere,21,40 the direct bandgap for NaTaO3 is calculated to be 2.23 eV (Fig. 7a), which is underestimated when compared to that of 4.0 eV experimentally observed for tantalate. This discrepancy is attributed to the well known intrinsic factor of DFT.41 The conduction band of NaTaO3 consisted mainly of the unoccupied Ta 5d orbital in the energy region (2.23–5.03 eV) and the valence band mainly comes from the occupied O 2p state (Fig. 8a). With the model of Cr doping at Ta site, there is no obvious change for the energy band structure compared with the pure NaTaO3 (Fig. 7b and 8b). A remarkable feature is noted for the model of Cr doped at the Na site: a wide conduction band due to the hybridization of Cr 3d and Ta 5d states, as illustrated in Fig. 7c and 8c. It makes the energy of the conduction band shift down a little and the band gap narrow to about 0.208 eV. For the model of Cr dual substitutions at Ta and Na sites, the two separate new bands contributed from Cr 3d were observed, which located at about −0.1 eV and 0.8 eV, respectively (Fig. 7d and 8d). The schematic diagram of electronic intraband transitions of the Cr-doped NaTaO3 could be speculated and depicted as shown in Fig. 9. Under visible light irradiation, electrons will be directly excited from the O 2p valence band to the Ta 5d conduction band, corresponding to the excitation of 4.3 eV in the UV spectrum for pure NaTaO3 (Fig. 9a). Accordingly, the excitation of O 2p to Ta 5d is expected to red shift due to the hybridization of Cr 3d and Ta 5d in the conduction band for the model of Cr@Na (Fig. 9c). On the contrary, in the model of the dual substitution Cr@ (Na, Ta), there may be two kinds of photoexcitation electrons under visible light irradiation (Fig. 9d). It can explain the two different absorptions in the long wavelength visible region estimated from UV-vis reflectance spectra (see the inset of Fig. 4). One is attributed to the excitation from the occupied state of Cr3+ 3d to the empty Ta5+ 5d orbital and the other is from the occupied state of Cr3+ 3d to the unoccupied state of Cr3+ 3d, that is, the d–d transition of 4A2→4T2 for Cr3+. Obviously, the dual substitute model of Cr-doped NaTaO3 could well match the UV-diffuse experimental results.
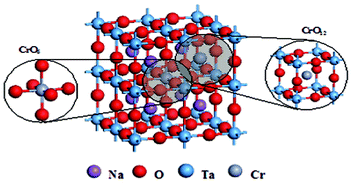 | ||
| Fig. 6 The supercell model proposed for Cr dual substitutions at Ta and Na sites of Cr-doped NaTaO3. | ||
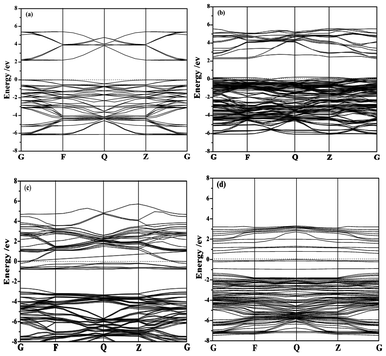 | ||
| Fig. 7 The band structures of (a) NaTaO3, (b) Cr doped NaTaO3 for Cr replacing Ta atom, (c) Cr doped NaTaO3 for Cr replacing Na atom, (d) Cr doped NaTaO3 for Cr replacing Ta and Na atoms. | ||
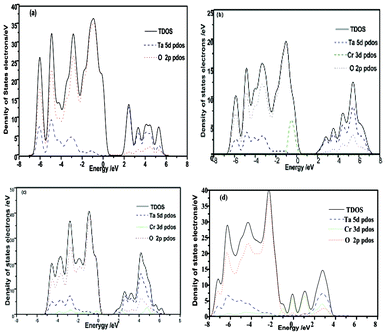 | ||
| Fig. 8 DOS and PDOS of (a) NaTaO3, (b) Cr doped NaTaO3 for Cr replacing Ta atom, (c) Cr doped NaTaO3 for Cr replacing Na atom, (d) Cr doped NaTaO3 for Cr replacing Ta and Na atoms. | ||
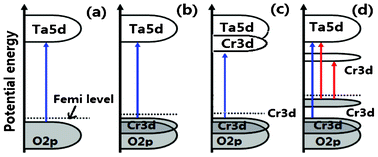 | ||
| Fig. 9 A schematic diagram of the electronic intraband transition of (a) NaTaO3, (b) Cr doped NaTaO3 for Cr replacing Ta atom, (c) Cr doped NaTaO3 for Cr replacing Na atom, (d) Cr doped NaTaO3 for Cr replacing Ta and Na atoms. | ||
Conclusions
Unique substitutions were first demonstrated in the perovskite phase formation of NaTaO3 from the Ta2O5–Cr2O3–Na2O–H2O hydrothermal systems, which differed from those prepared using the traditional solid state reactions. The main results can be summarized as follows:At low doping levels <2.47 mol% Cr3+, Cr3+ primarily substituted for Ta5+ with the generation of oxygen vacancies, showing no apparent impact on the lattice dimension but enhanced photocatalytic activities.
With increasing the doping level >2.47 mol% Cr3+, Cr3+ tended to show sole substitution for Ta5+ and dual substitutions for Na+ and Ta5+, leading to a certain concentration of oxygen vacancies, systematic decrease in lattice dimensions, increased surface area but reduced photocatalytic activities.
The dual substitution yielded the midgap levels in between the conduction band and valance band, which results in the decrease in bandgap energies beneficial for visible-light absorption.
Acknowledgements
This work is supported by the National Natural Science Foundation of China (Nos. 20967004, 21103081), the Chunhui Program of Ministry of Education (Z2007-1-01034), the inner Mongolia National Science Foundation (2010Zd08), the Science Research Foundation of Inner Mongolia Education Bureau (NJ05027), the scientific research foundation for the returned overseas Chinese scholars of the Ministry of Education (2006-331), the Project of Scientific and Technological Innovation Team of Inner Mongolia University (12110614).References
- D. Li, J. Zheng and Z. Zou, J. Phys. Chem. Solids, 2006, 67, 801 CrossRef CAS.
- G. Pecchi, M. G. Jiliberto, A. Buljan and E. J. Delgado, Solid State Ionics, 2011, 187, 27 CrossRef CAS.
- A. Jia, Z. Su, L. L. Lou and S. Liu, Solid State Sci., 2010, 12, 1140 CrossRef CAS.
- N. Lakshminarayanan, H. Choi, N. K. John and U. S. Ozkan, Appl. Catal., B, 2011, 103, 318 CrossRef CAS.
- P. Zeng, R. Ran, Z. Chen, W. Zhou, H. Gu, Z. Shao and S. Liu, J. Alloys Compd., 2008, 455, 465 CrossRef CAS.
- V. Kumar and U. S. Govind, J. Hazard. Mater., 2011, 189, 502 CrossRef CAS.
- M. Yang, X. L. Huang, S. C. Yan, Z. S. Li, T. Yu and Z. G. Zou, Mater. Chem. Phys., 2010, 121, 506 CrossRef CAS.
- H. Dai, H. He, P. Li, L. Gao and C. T. Au, Catal. Today, 2004, 90, 231 CrossRef CAS.
- J. F. Zhu and M. Zäch, Curr. Opin. Colloid Interface Sci., 2009, 14, 260 CrossRef CAS.
- A. Fujishima, X. T. Zhang and D. A. Tryk, Int. J. Hydrogen Energy, 2007, 32, 2664 CrossRef CAS.
- C. Zhou, G. Chen, Y. X. Li, H. J. Zhang and J. Pei, Int. J. Hydrogen Energy, 2009, 34, 2113 CrossRef CAS.
- S. Ikeda, M. Fubuki, Y. K. Takahara and M. Matsumura, Appl. Catal., A, 2006, 300, 186 CrossRef CAS.
- K. Yoshioka, V. Petrykin, M. Kakihana, H. Kato and A. Kudo, J. Catal., 2005, 232, 102 CrossRef CAS.
- A. Kudo, R. Niishiro, A. Iwase and H. Kato, Chem. Phys., 2007, 339, 104 CrossRef CAS.
- R. Shi, J. Lin, Y. J. Wang, J. Xu and Y. F. Zhu, J. Phys. Chem. C, 2010, 114, 6472 CAS.
- Y. Hosogi, Y. Shimodaira, H. Kato, H. Kobayashi and A. Kudo, Chem. Mater., 2008, 20, 1299 CrossRef CAS.
- C. Dıaz-Guerra, P. Umek, A. Gloter and J. Piqueras, J. Phys. Chem. C, 2010, 114, 8192 Search PubMed.
- H. Kato, K. Asakura and A. Kudo, J. Am. Chem. Soc., 2003, 125, 3082 CrossRef CAS.
- H. Zhu, J. Tao and X. Dong, J. Phys. Chem. C, 2010, 114, 2873 CAS.
- P. Han, X. Wang, Y. Zhao and C. Tang, Adv. Mater. Res., 2009, 79-82, 1245 CrossRef CAS.
- X. Wang, H. Bai, Y. Meng, Y. Zhao, C. Tang and Y. Gao, J. Nanosci. Nanotechnol., 2010, 10, 1788 CrossRef CAS.
- P. D. Kanhere, J. Zheng and Z. Chen, J. Phys. Chem. C, 2011, 115, 11846 CAS.
- Z. G. Yi and J. H. Ye, J. Appl. Phys., 2009, 106, 074910 CrossRef.
- X. Li and J. Zang, J. Phys. Chem. C, 2009, 113, 19411 CAS.
- S. F. Matar, G. Campet and M. A. Subramanian, Prog. Solid State Chem., 2011, 39, 70 CrossRef CAS.
- H. Kato, K. Asakura and A. Kudo, J. Am. Chem. Soc., 2003, 125, 3082 CrossRef CAS.
- R. S. Okojie, T. Holzheu, X. Huang and M. Dudley, Appl. Phys. Lett., 2003, 83, 1971 CrossRef CAS.
- D. B. Varshney, J. A. Elliott, L. A. Gatlin, S. Kumar, R. Suryanarayanan and E. Y. Shalaev, J. Phys. Chem. Lett., 2009, 113, 6177 CAS.
- H. Kato and A. Kudo, J. Phys. Chem. B, 2002, 106, 5029 CrossRef CAS.
- A. Kleiman-Shwarsctein, Y. S. Hu, J. A. Forman, D. G. Stucky and W. E. McFarland, J. Phys. Chem. C, 2008, 112, 15900 CAS.
- A. P. Grosvenor, M. C. Biesinger, R. S. C. Smart and N. S. McIntyre, Surf. Sci., 2006, 600, 1771 CrossRef CAS.
- M. C. Biesinger, L. W. M. Lau, A. R. Gerson and R. S. C. Smart, Phys. Chem. Chem. Phys., 2012, 14, 2434 RSC.
- A. E. C. Palmqvist, M. Wirde, U. Gelius and M. Muhammed, Nanostruct. Mater., 1999, 11, 995 CrossRef CAS.
- S. K. Sengar, B. R. Mehta and G. Gupta, Appl. Phys. Lett., 2011, 98, 193115 CrossRef.
- K. Shimura, S. Kato, T. Yoshida, H. Itoh, T. Hattori and H. Yoshida, J. Phys. Chem. C, 2010, 114, 3493 CAS.
- H. Fu, S. Zhang, T. Xu, Y. Zhu and J. Chen, Environ. Sci. Technol., 2008, 42, 2085 CrossRef CAS.
- I. N. Martyanov, S. Uma, S. Rodrigues and K. J. Klabunde, Chem. Commun., 2004,(21), 2476 RSC.
- W. Choi, A. Termin and M. R. Hoffmann, J. Phys. Chem., 1994, 98, 13669 CrossRef.
- B. J. Kennedy, A. K. Prodjosantoso and C. J. Howard, J. Phys.: Condens. Matter, 1999, 11, 6319 CrossRef CAS.
- W. Wei, Y. Dai, M. Guo, L. Yu and B. Huang, J. Phys. Chem. C, 2009, 113, 15046 CAS.
- J. W. Liu, G. Chen, Z. H. Li and Z. G. Zhang, J. Solid State Chem., 2006, 179, 3704 CrossRef CAS.
Footnote |
| † Electronic Supplementary Information (ESI) available. See DOI: 10.1039/c2ra21241b |
| This journal is © The Royal Society of Chemistry 2012 |
