AgBr modified TiO2 nanotube films: highly efficient photo-degradation of methyl orange under visible light irradiation
Qiuye
Li
*,
Yangyang
Xing
,
Rui
Li
,
Lanlan
Zong
,
Xiaodong
Wang
and
Jianjun
Yang
Key Laboratory for Special Functional Materials, Henan University, Kaifeng, 475004, China. E-mail: lqybys@yahoo.com.cn; Tel: +86-378-3881358; Fax: +86-378-3881358
First published on 28th August 2012
Abstract
Anatase TiO2 nanotube film was prepared by calcination of the orthorhombic titanic acid nanotube at 400 °C. To expand the light absorption, AgBr nanoparticles were sensitized on TiO2 film. The AgBr–TiO2 nanotube film showed a high activity for MO photo-degradation under visible light irradiation. Moreover, the photocatalytic activity was further improved a lot after annealing of the AgBr–TiO2 nanotube film.
1. Introduction
TiO2 and TiO2-based nanostructured ordered arrays have attracted much interest due to their application in photovoltaic, solar cells, nanodevices, biosensors, and photocatalysts.1 Conventional methods for preparation of the TiO2-based nanostructured arrays mainly include template methods, electrochemical anodization processes, and hydrothermal methods. The sizes or diameters of the TiO2 nanomaterials obtained from the template and electrochemical anodization methods are often large, which lead to the low BET surface areas and disadvantages for the photocatalytic reactions.2 However, the TiO2-based nanomaterials, especially the layered titanate nanotubes, obtained by the hydrothermal methods often have large BET surface areas, and strong adsorption ability. In our previous work, we found that the titanic acid nanotubes can transform to TiO2 nanotubes or nanoparticles by calcination (H2Ti2O4(OH)2 → 2H2O + 2TiO2).3 So, in this work, the titanic acid nanotubes were used as the precursor to prepare the TiO2 nanotube films. Comparing with the common TiO2 film, our TiO2 nanotube films have large BET surface areas, and the nanotube channels and porous structure can enhance the light absorption efficiency.4Although the TiO2 nanotube films have many merits, the big issue for them is that they are only sensitive to UV light. For utilization of solar light and indoor illumination, a strong and popular visible light sensitive material, silver bromide (AgBr),5 was applied to modify the TiO2 nanotube film. After sensitization, the light absorption capability of TiO2 nanotube film was remarkably red-shifted to the long wavelength direction, and a high photocatalytic activity for MO degradation was achieved under visible light irradiation. As is well known, the close interaction between the two components of a composite photocatalyst is very important, because this is a key factor for the transfer and separation of the photo-generated charge carriers.6 So, in order to increase the contact between AgBr and TiO2 nanotube films, the AgBr modified TiO2 films (AgBr–TN) were calcined at 400 °C for 4 h. The electrochemical impedance spectroscopy (EIS) and photocurrent–time curves indicated that the separation efficiency of the photo-generated electron–hole pairs was largely improved, and this led to a much higher photocatalytic activity for MO degradation. Herein, the relationship between the morphology, structure, and the photocatalytic activities of AgBr modified TiO2 nanotube films was investigated in detail.
2. Experimental
2.1 Preparation of the AgBr modified TiO2 nanotube films
Ti foil with a size of 2 × 4 cm2 was put into an autoclave containing a concentrated 10 M NaOH aqueous solution, and then reacted at 125 °C for 24 h. After cooling down, the obtained sodium titanate nanotube films were washed with distilled water several times, and then immersed in a 0.1 M HCl aqueous solution for 12 h to obtain the titanic acid nanotubes film (TAN). Finally, the TAN film was calcined at 400 °C in air for 4 h to get TiO2 nanotube films (TN). After that, the TN film was immersed in 0.1 M AgNO3, and 0.1 M NaBr aqueous solution, respectively. This progress was repeated three times, the obtained AgBr sensitized TiO2 nanotubes film was denoted as AgBr–TN. For further improving the interaction between AgBr and TiO2 nanotubes, the AgBr–TN film was calcined at 400 °C in air for 4 h, and the sample was denoted as AgBr–TN–C. As a reference, a conventional TiO2 film was prepared on a FTO glass by a sol–gel method.7 AgBr was sensitized on the surface of TiO2 by the same method described above, and then calcined at 400 °C in air for 4 h. This sample was denoted as AgBr–TiO2. P25 is a generally accepted standard in photocatalysis, so a P25 film was also prepared as a reference on ITO by dipping with a 2 g L−1 P25 aqueous solution.2.2 Characterizations
X-Ray diffraction (XRD) patterns were measured on a Philips X′Pert Pro X-ray diffractometer (Holland) (Cu-Kα radiation, 2θ range 10–90°, scan step size 0.08°, time per step 1.0 s, generator voltage 40 kV, tube current 40 mA). The morphologies of the samples were obtained by SEM (JSM-7100F, JEOL Co., Japan) and TEM (JEM-2010, JEOL Co., Japan). Diffused reflectance spectra (DRS) were obtained by a UV-VIS spectrophotometer (UV-3010, Shimadzu, Japan), using BaSO4 as a reference.2.3 Evaluation of the photocatalytic activity
Methyl orange (MO) was selected as the model chemicals to evaluate the photocatalytic activity of the samples. In a typical experiment, a photocatalyst film was placed in a 35 mL quartz reactor containing 30 mL MO aqueous suspension (10 mg L−1). Prior to irradiation, the suspension was magnetically stirred in the dark for 1 h to establish an adsorption–desorption equilibrium. A 300 W Xe arc lamp with a 420 cutoff filter was used as the light source (λ ≥ 420 nm, I420 = 8.0 mW cm−2). In the comparison photocatalytic reaction with P25, the outdoor sunlight was used as the light source (I420 = 4.8 mW cm−2). At given irradiation time intervals, the residual MO concentration was detected using a UV-vis spectrophotometer (722, Shanghai Jingke Instrument Plant, China).2.4 Photoelectrochemical measurements
The photo-electrochemical properties were measured using a conventional three-electrode system. The photocatalyst film served as the working electrode, and a Pt meshwork and an Ag/AgCl electrode (SCE) acted as the counter electrode and reference electrode, respectively. The electrolyte was Na2SO4 with a concentration of 0.5 mol L−1, and the pH value of the electrolyte was 6.4. The photoelectrochemical experiments were performed using an electrochemical analyzer (IM6ex, Germany). Electrochemical impedance spectroscopy (EIS) experiments were conducted at the open circuit potential with 5 mV amplitude of perturbation in the frequency range 10 kHz–10 mHz in the dark or under illumination.3. Results and discussion
The phase structure of the nanotube films were analyzed by the XRD technique. As shown in Fig. 1, the TiO2 nanotube film belongs to an anatase phase, indicating that the orthorhombic titanic acid nanotubes have transformed to TiO2 nanotubes completely; this result is consistent with our previous work.3 There are some characteristic peaks of Ti at 38.5°, 40.2°, 63.1°, 70.7°, indicating that only the surface of the Ti foil reacted with NaOH, and the interior still remained as Ti metal. When AgBr was sensitized on the surface of TiO2 film, some new peaks appeared. The new peaks at 2θ values of 30.9°, 44.3° and 55.0° can be indexed to (200), (220) and (222) crystal planes of the AgBr phase (JCPDS file:06-0438), respectively. Comparing curve b and c, we found that the peak intensity of anatase TiO2 increased, which indicated that the crystallinity of anatase TiO2 improved after being annealed at 400 °C. In addition, a new peak at about 27.5° appeared in AgBr–TN–C, indicating that a spot of anatase transformed to rutile after annealing. Both curves of sample b and c contained the characteristic peaks of anatase TiO2 and silver bromide, indicating that AgBr was successfully sensitized on the surface of TiO2 nanotubes.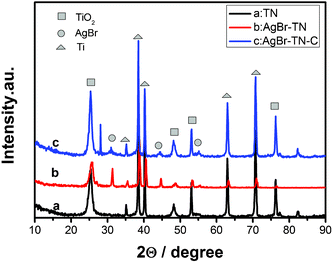 | ||
| Fig. 1 XRD patterns of the nanotube film photocatalysts. | ||
Fig. 2 shows the surface morphology of the photocatalyst films and the content of the sensitized AgBr. As shown in Fig. 2A, the TiO2 film consisted of a large amount of TiO2 nanotubes, and many nanotubes intertwined together to form a porous and incompact structure. The diameters of TiO2 nanotubes were uniform, and their lengths expanded to several micrometers. The inset figure showed that the thickness of TN film was about 1.51 μm. To further observe the morphology of TiO2, some powders were peeled off from the substrate, and their TEM image is shown in Fig. 2B. We can clearly see that TiO2 maintained a very uniform nanotube morphology, and their diameters are 8–10 nm. In our previous work, we found that the titanic acid nanotubes would transform to TiO2 nanoparticles when calcined at 400 °C.8 However, in this study, TiO2 film still maintained a very good nanotube morphology via the same heat treatment. In order to confirm this phenomenon, the transformation process of the titanic acid nanotube (TAN) film to TiO2 film was studied. As shown in Fig. 3, the as-prepared TAN film has an orthorhombic phase structure. When TAN was calcined at 200 °C for 4 h, its structure changed a little. When the calcined temperature increased to 400 °C, TAN transformed to anatase TiO2 completely. The SEM images show that the one-dimensional nanotube morphology remained very well after calcination. This phenomenon was possibly due to the TiO2 nanotubes intertwining together to form some bundles, so the strength of the nanotubes increased. There may be other reasons for keeping TiO2 as a one-dimensional nanotube morphology, we will investigate this phenomenon intensively in our further work.
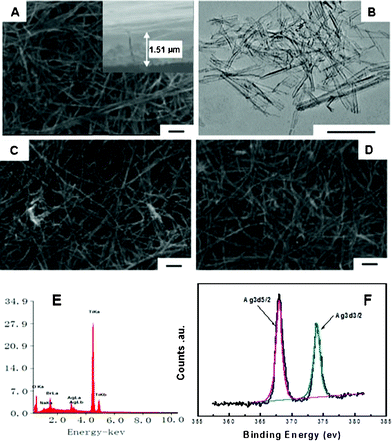 | ||
| Fig. 2 FE-SEM images of TN (A), AgBr–TN(C), AgBr–TN–C(D) films, TEM image of TiO2 nanotubes (B), EDS spectrum (E) and XPS spectrum of Ag 3d (F) of AgBr–TN–C films. | ||
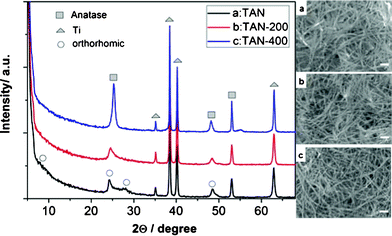 | ||
| Fig. 3 XRD pattern and SEM images (scale bar: 100 nm) of titanic acid nanotubes (TAN) film, a: as-prepared TAN, b: TAN calcined at 200 °C for 4 h, c: TAN calcined at 400 °C for 4 h. | ||
When AgBr nanoparticles were sensitized on the TiO2 nanotube film, the surface morphology of the nanotube film remained. After calcination at 400° for 4 h, the AgBr–TN–C also kept a very good nanotube structure. From Fig. 2C and 2D, we did not find any particle aggregation on the films, which may be because the AgBr content is relatively small, and that most is located within the channels of the nanotubes and nanotube intersection. However, the EDS results verified that AgBr nanoparticles were successfully modified on the TiO2 nanotube films (Fig. 2E), and the mole ratio of AgBr to TiO2 was estimated to be ca. 2.42%. The AgBr–TN–C film was also analyzed by X-ray photoelectron spectroscopy (XPS). As shown in Fig. 2F, the spectrum of Ag 3d consisted of two individual peaks at 373.8 eV and 367.8 eV which was indexed to the 3d3/2 and 3d5/2 binding energies of the univalent Ag species. And no peaks corresponding to Ag0 were observed, indicating that the chemical stability of the AgBr–TN–C film was very good in the process of the heat treatment. In addition, the surface content of Ag+ was determined to be 3.7 mol%. This value was higher than that obtained by the EDS measurement, indicating that most of the AgBr nanoparticles were modified on the outer layer of the film.
Fig. 4 shows the UV-Vis DRS spectra of the photocatalyst films. Curve a showed that the TiO2 nanotube film has no visible light absorption. When AgBr was sensitized on the surface of the TN film, a broad peak at around 400–600 nm was observed, and the light absorption in the UV region increased, which was probably caused by the sensitized AgBr nanoparticles. When AgBr–TN film was calcined at 400 °C, the visible light absorption increased. For the reference film, the AgBr–TiO2 nanoparticle film almost has no visible light absorption. This should be related to the low content of the sensitized AgBr nanoparticles. The structure of the TiO2 film obtained by the sol–gel method is compact, so compared with the porous TiO2 nanotube film, the sensitized AgBr on the TiO2 film should be much lower. In addition, The absorption of AgBr–TiO2 nanoparticles in the UV light region was much lower than that of AgBr–TN and AgBr–TN–C, which should be related to the difference of the substrate. The substrate of AgBr–TiO2 nanoparticles was ITO glass, and the color of the film was nearly translucent, so most of the irradiated light was reflected and transmitted, and as a result, the light absorption was lower.
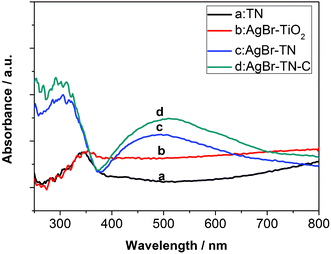 | ||
| Fig. 4 UV-vis diffuse reflectance spectra (DRS) of the nanotube film photocatalysts. | ||
The photodegradation of methyl orange (MO) was tested as a probe reaction9 to evaluate the photocatalytic activity of the AgBr sensitized TiO2 nanotube films. For comparison, photocatalytic self-degradation of MO was investigated under the same experimental conditions. As shown in Fig. 5, the photolysis rate of MO under visible light was very slow, so the self-degradation of MO can be ignored in the photocatalytic reaction. The degradation yield of MO on TN film was 5% within 180 min. When AgBr was sensitized on the TN film, the degradation yield reached 27%. This yield was 5.4 times of that of the bare TN film, indicating that AgBr played a key role for the visible-light-induced photocatalytic reaction. The conduction band of AgBr, which is located at ca. −1.04 eV versus NHE, is more cathodic than that of TiO2 (−0.5 eV),10 so the excited electron of AgBr can inject into the conduction band of TiO2, and thus the separation possibility of electron–hole pairs of AgBr was improved. The separated electrons and holes can participate in the visible-light-induced photocatalytic reaction. Compared to the AgBr–TiO2 nanoparticle film, its degradation yield of MO was only 2%. The photocatalytic activity of the porous AgBr–TN film was much higher than that of the AgBr–TiO2 film, which may be due to four aspects. Firstly, the higher content of the sensitized AgBr can enhance the visible light absorption of the photocatalysts. Secondly, the large BET surface areas of the TiO2 nanotubes can provide more adsorption sites for MO dye molecules, so the localized concentration of MO on the surface of the AgBr–TN film would be higher, which would accelerate the photodegradation reaction. Thirdly, the one-dimensional morphology of TiO2 nanotube will be in favor of the electron transfer, and lead to a higher separation of the photo-generated charge carriers.11 Finally, the porous and incompact structure of the TiO2 nanotubes film would facilitate the use of more irradiated light, because more light can be scattered and reflected in the channels and pores of the TiO2 nanotube film.
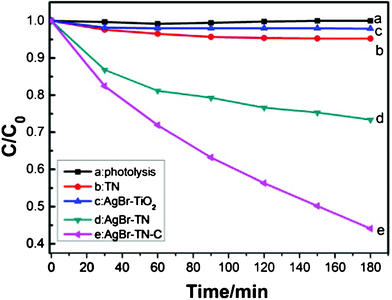 | ||
| Fig. 5 Photocatalytic activity of MO degradation under visible light irradiation. | ||
When the AgBr–TN film was annealed at 400 °C, the photocatalytic activity was further greatly improved. The degradation yield of the AgBr–TN–C film reached 56% within 180 min. Provided that the bleaching reaction of MO follows a pseudo-first-order reaction, the degradation rate on AgBr–TN–C film was calculated to be 0.27 h−1. The increased photocatalytic activity should be due to the enhanced close interaction between AgBr and TiO2 after calcination. This assumption was proved by the results of electrochemical impedance spectroscopy (EIS). EIS spectra often display the conductivity of an electrode. A large circular radius usually shows a higher charge transfer resistance.12 As shown in Fig. 6, the impedance arc radius of AgBr–TN–C was much smaller than that of AgBr–TN under visible light irradiation, implying that a much higher separation efficiency of photogenerated electron–hole pairs was achieved after calcination. This result indicated that the calcination can increase the effective and close contact between AgBr and TiO2 nanotubes, which is conducive to the improvement of the photocatalytic activity. In addition, we also found that the impedance arc radius of the AgBr–TiO2 nanoparticle film was larger, illustrating that its electric resistance was high, and this may be one reason for the low photocatalytic activity of AgBr–TiO2. The inset photocurrent–time curves also showed that the photocurrent of AgBr–TN–C is much higher than that of AgBr–TN and AgBr–TiO2, indicating that the separation of the photo-generated electron–hole pairs on AgBr–TN–C was higher. Therefore, modifying AgBr with TiO2 nanotube is a promising way to improve the photo-electronic conversion efficiency compared with AgBr modified with TiO2 nanoparticles. On the other hand, from the XRD pattern of AgBr–TN–C (Fig. 1), we found that some rutile phase appeared. As is well known, commercial P25 is one of the most active photocatalysts, and its high efficiency should be related to the mixture phase of anatase and rutile. So, the appearance of a spot of rutile in AgBr–TN–C should be another reason for its high activity for MO photo-degradation.
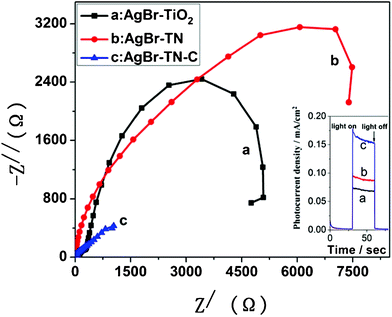 | ||
| Fig. 6 EIS Nyquist plots of photocatalyst films under visible light irradiation; the inset figure is the photocurrent–time curves. | ||
P25 is a generally accepted practical photocatalyst and often used a standard now. So, the photocatalytic activity of P25 and AgBr–TN–C was also compared under outdoor sunlight irradiation. The results are shown in Fig. 7. The photolysis rate of MO is very slow, so it can be ignored in the photocatalytic reaction. The degradation yield of MO on P25 reached 82% in 5 h. For AgBr–TN–C film, its degradation yield was 79%. Through comparison, the AgBr–TN–C film showed a comparative activity with P25 for MO photodegradation, indicating that AgBr–TN–C film was a good candidate for realistic applied photocatalysis.
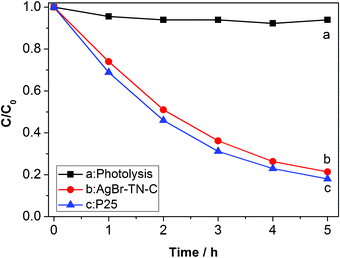 | ||
| Fig. 7 Photocatalytic activity of MO degradation under visible light irradiation. | ||
4. Conclusions
Anatase TiO2 nanotube (TN) films were prepared by calcination of the titanic acid nanotubes at 400 °C for 4 h. TEM showed that the diameter of the TiO2 nanotubes was 8–10 nm and SEM images showed that the NT films consisted of a large amount of TiO2 nanotubes, and many nanotubes were intertwined together to form a porous and incompact structure. AgBr nanocrystals were successfully sensitized on the TN film. The nanotube structure of the film was kept after sensitization, but the visible light absorption remarkably increased. The sensitization content of AgBr was estimated to be 2.42% by EDS. The AgBr–TN film showed a higher photocatalytic activity for MO degradation compared to the bare TN film and AgBr–TiO2 nanoparticle film, which may be caused by the large BET surface areas and one-dimensional morphology of the TiO2 nanotubes, and more light harvesting in the pores and channels of the nanotube film. When AgBr–TN film was calcined, a stronger visible light absorption and a much higher photocatalytic activity were achieved. The EIS result indicated that the separation efficiency of the photo-generated charge carriers was increased after annealing.Acknowledgements
The authors gratefully acknowledge the support of the National Natural Science Foundation of China (No. 21103042), the Specialized Research Fund for the Doctoral Program of Higher Education (No. 20114103120001), the Scientific Research Foundation (No. 2010YBZR013) and the Postdoctoral Scientific Research Foundation of Henan Univerisity (BH2011054).References
- (a) Y. Xu, X. Fang and Z. Zhang, Appl. Surf. Sci., 2009, 255, 8743 CrossRef CAS; (b) Y. Li, T. Sasaki, Y. Shimizu and N. Koshizaki, J. Am. Chem. Soc., 2008, 130, 14755 CrossRef CAS PubMed; (c) J. Li, T. Han, N. Wei, J. Du and X. Zhao, Biosens. Bioelectron., 2009, 25, 773 CrossRef CAS PubMed; (d) A. Ghicov and P. Schmuki, Chem. Commun., 2009, 2791 RSC; (e) S. Bao, C. Li, J. Zang, X. Cui, Y. Qiao and J. Guo, Adv. Funct. Mater., 2008, 18, 591 CrossRef CAS.
- (a) D. Wang, B. Yu, C. Wang, F. Zhou and W. Liu, Adv. Mater., 2009, 21, 1964 CrossRef CAS; (b) E. Ortel, S. Sokolov and R. Kraehnert, Microporous Mesoporous Mater., 2010, 127, 17 CrossRef CAS; (c) T. Kasuga, M. Hiramatsu, A. Hosen, T. Sekino and K. Niihara, Langmuir, 1998, 14, 3160 CrossRef CAS.
- J. Yang, Z. Jin, X. Wang, W. Li, J. Zhang, S. Zhang, X. Guo and Z. Zhang, Dalton Trans., 2003, 3898 RSC.
- (a) Q. Li, T. Kako and J. Ye, Appl. Catal., A, 2010, 375, 85 CrossRef CAS; (b) S. Berger, H. Tsuchiya, A. Ghicov and P. Schmuki, Appl. Phys. Lett., 2006, 88, 203119 CrossRef; (c) T. Kimura, N. Miyamoto, X. Meng, T. Ohji and K. Kato, Chem.–Asian J., 2009, 4, 1486 CrossRef CAS PubMed.
- P. Wang, B. Huang, X. Zhang, X. Qin, H. Jin, Y. Dai, Z. Wang, J. Wei, J. Zhan, S. Wang, J. Wang and M. H. Whangbo, Chem.–Eur. J., 2009, 15, 1821 CrossRef CAS PubMed.
- (a) Q. Li, T. Kako and J. Ye, J. Mater. Chem., 2010, 20, 10187 RSC; (b) Q. Li, T. Kako and J. Ye, Chem. Commun., 2010, 46, 5352 RSC.
- M. Zhang, C. Feng, Z. Jin, G. Cheng, Z. Du and H. Dang, Chin. J. Catal., 2005, 26(6), 1 CrossRef.
- Q. Li, X. Wang, Z. Jin, D. Yang, S. Zhang, X. Guo, J. Yang and Z. Zhang, J. Nanopart. Res., 2007, 9, 951 CrossRef CAS.
- (a) Y. Bi and J. Ye, Chem. Commun., 2009, 6551 RSC; (b) Y. Liu, B. Zhou, J. Bai, J. Li, J. Zhang, Q. Zheng, X. Zhu and W. Cai, Appl. Catal., B, 2009, 89, 142 CrossRef CAS.
- L. Zhang, K. Wong, Z. Chen, J. Yu, J. Zhao, C. Hu, C. Chan and P. Wong, Appl. Catal., A, 2009, 363, 221 CrossRef CAS.
- N. Wu, J. Wang, D. N. Tafen, H. Wang, J. Zheng, J. P. Lewis, X. Liu, S. S. Leonard and A. Manivannan, J. Am. Chem. Soc., 2010, 132, 6679 CrossRef CAS PubMed.
- R. Velmurugan and S. Swaminathan, Chem. Cent. J., 2011, 5, 46 CrossRef PubMed.
| This journal is © The Royal Society of Chemistry 2012 |
