Photoluminescent bimetallic-3-hydroxypicolinate/graphene oxide nanocomposite†
Carlos M.
Granadeiro
a,
Sandra M. A.
Cruz
b,
Gil
Gonçalves
b,
Paula A. A. P.
Marques
b,
Pedro M. F. J.
Costa
ac,
Rute A. S.
Ferreira
d,
Luís D.
Carlos
d and
Helena I. S.
Nogueira
*a
aChemistry Department and CICECO, University of Aveiro, 3810-193, Aveiro, Portugal. E-mail: helenanogueira@ua.pt; Fax: +351 234 370084; Tel: +351 234 370727
bMechanical Engineering Department and TEMA-NRD, University of Aveiro, 3810-193, Aveiro, Portugal
cLeibniz Institute for Solid State and Materials Research (IFW), Helmholtzstrasse 20, 01069, Dresden, Germany
dPhysics Department and CICECO, University of Aveiro, 3810-193, Aveiro, Portugal
First published on 3rd August 2012
Abstract
A new photoluminescent bimetallic-3-hydroxypicolinate/graphene oxide composite was prepared by incorporation of the complex Na5[EuW2O6(picOH)8] (1; HpicOH being 3-hydroxypicolinic acid) on graphene oxide (GO). Photoluminescence studies (emission and excitation spectra and 5D0 emission decay curves) were performed on 1 and the composite 1/GO suggesting an effective interaction between the picOH− ligands and the graphene oxide.
1. Introduction
The chemical modification of graphene has been largely explored in the last few years, in order to obtain new properties and better processable graphene materials.1–4 A large number of new materials has been reported exploring graphene's unique thermal, electric, mechanical and optical properties.5–10 Only a few reports were found in the literature about the preparation of luminescent graphene or graphene oxide (GO)-based materials using rare-earth emission.11–14 Zhao et al.11 have prepared luminescent GO–nanoparticle conjugates by a method in which red-luminescent silica-coated europium(III) complex nanoparticles were covalently coupled to GO nanosheets by means of a carbodiimide-mediated amidation process. Cao et al.12 have presented the preparation of a luminescent composite through the noncovalent bonding of the europium(III) complex [Eu(DBM)2(Phen)(SA)] (DBM = dibenzoylmethane, Phen = 1,10-phenanthroline, SA = stearic acid) to graphene oxide sheets. Kim et al.13 studied the reaction of graphene carboxylate, europium(III) and α-pyridoin anion in methanol solution to produce a photoluminescent graphene material. In the most recent report, Gupta et al.14 presented the preparation of one lattice-modified luminescent graphene, where europium(III) cations are complexed with graphene through oxygen functionalities. Mo et al.15 have also prepared Eu2O3/graphene nanocomposites by using graphite oxide and europium nitrate as precursors.In particular, we have been studying lanthanide-containing polyoxometalates (LnPOMs), which exhibit interesting photoluminescent properties16 and which we have already incorporated in different matrices.17,18 Detailed photoluminescence studies have shown that there is efficient emission from the LnPOMs in those materials, in particular for the europium-containing ones, with excitation paths that involve ligand-to-metal charge-transfer states associated with O–Eu and O–W transitions. Only a few reports were found in the literature concerning graphene-supported polyoxometalates (POMs), mainly using POMs as mediators for the assembly of graphene-based nanoporous materials19,20 or as photocatalysts for the reduction of graphene oxide and its nanocomposites formation.21–24 The structural and electronic properties of the Keggin anion [PW12O40]3− deposited on a graphene layer were also investigated by using periodic density functional theory.25
In this work, we have performed the incorporation on GO of the bimetallic-picolinate Na5[EuW2O6(picOH)8] 1 (HpicOH being 3-hydroxypicolinic acid). Though it is a smaller molecule than the usual LnPOMs, it contains already the tungstate and europium(III) units, together with the picolinate ligand that we have been studying concerning the influence on the photoluminescent properties of europium(III). The picolinate ligand picOH− exhibits a well-known antenna effect in europium(III) complexes26 and in LnPOMs,27 improving the photoluminescent properties and allowing the use of a broader range of excitation wavelengths. The aim of grafting the europium(III) complex on GO is to study the influence of GO on its optical properties. Photoluminescence studies were performed on 1 and the composite 1/GO showing different lifetimes and excitation spectra.
2. Results and discussion
The incorporation of the bimetallic-picolinate Na5[EuW2O6(picOH)8] 1 on graphene oxide results in a dark brown solid 1/GO that shows strong red emission under UV radiation (Fig. 1). The vibrational spectroscopy data confirms the presence of complex 1 in the 1/GO composite. The corresponding infrared spectrum (Fig. 2A) displays the typical bands of graphene oxide, namely the C![[double bond, length as m-dash]](https://www.rsc.org/images/entities/char_e001.gif) O stretching of the carboxylic groups (1727 cm−1) and the CC stretching of the graphene structure (1627 cm−1), as well as the C–O stretching modes of the epoxy groups (1062 cm−1).28,29 The bands in the 1650–1200 cm−1 range correspond to the stretching modes of the picOH− ligand, namely the asymmetric and symmetric carboxylate stretches.27,30 The bands in the 950–700 cm−1 region correspond to W–O stretching modes.30
O stretching of the carboxylic groups (1727 cm−1) and the CC stretching of the graphene structure (1627 cm−1), as well as the C–O stretching modes of the epoxy groups (1062 cm−1).28,29 The bands in the 1650–1200 cm−1 range correspond to the stretching modes of the picOH− ligand, namely the asymmetric and symmetric carboxylate stretches.27,30 The bands in the 950–700 cm−1 region correspond to W–O stretching modes.30
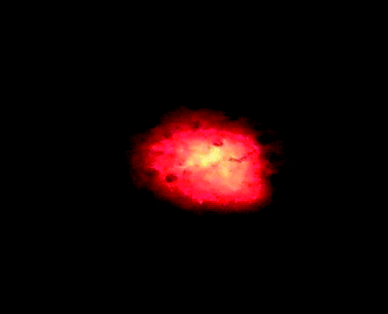 | ||
| Fig. 1 Composite 1/GO under 325 nm laser excitation. | ||
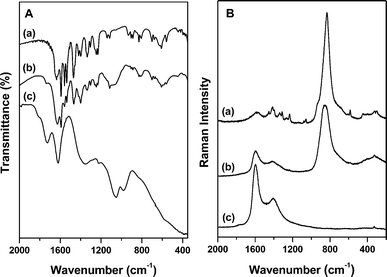 | ||
| Fig. 2 Infrared in ATR mode (A) and Raman (325 nm laser) (B) spectra of (a) compound 1, (b) 1/GO composite and (c) graphene oxide. | ||
The Raman spectrum of 1/GO composite (Fig. 2B), recorded using a 325 nm laser, exhibits a very intense band located at 854 cm−1 assigned to W–O stretches, as well as the G and D peaks of graphene oxide located at 1595 cm−1 and 1417 cm−1, respectively.31 When a 514 nm laser line is used, the Raman spectra of both 1 and 1/GO composite (Fig. S1, supplementary information†) shows in addition europium(III) emission bands that in this case are in the detection range of the spectrometer.
Fig. 3 shows typical TEM images of the 1/GO composite. Whilst the distribution of compound 1 on the GO flakes is not uniform (in number and orientation), the shape of the elongated structures was invariably consistent with that of a rod. The dimensions of these 1 rods varied from 20 nm to 100 nm in width and up to 5 μm in length. From the EDX the presence of C, O, W and Eu was identified (Fig. S2, supplementary information†). A closer look at the texture of both components revealed the layered structure of GO (Fig. 4a) and some crystalline ordering in the 1 rods (Fig. 4b).
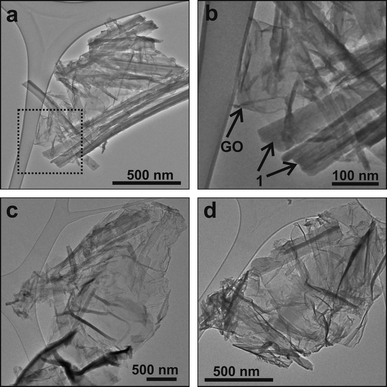 | ||
| Fig. 3 (a) A TEM image of the composite 1/GO where the presence of elongated structures (1 rods) is visible. (b) A magnified view of the area boxed in (a). The differences in contrast and shape between the compound 1 and the GO are clear. (c, d) Additional images where the presence of the 1 rods is not so prevalent. Here, it is easier to observe the wrinkled GO flakes. | ||
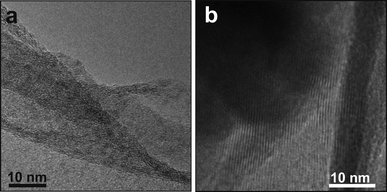 | ||
| Fig. 4 (a) A high resolution TEM image of the GO layer. (b) The detail of the compound 1 rods. Both structures exhibit some crystalline order. | ||
Confocal Raman microscopy was performed to get evidence about the distribution of 1 in the composite. Fig. 5A shows the signal mapping in a solid sample of 1/GO composite based on the integrated intensity of the signal in the 2576–2763 cm−1 region, using a 532 nm laser, corresponding to the most intense band observed in the spectrum obtained. The light colored areas correspond to regions of the nanocomposite in which the band-integrated intensity increases. The microscope is very sensitive to depth, and as the sample did not show a flat surface, the light areas correspond to the focused region of the solid shown in Fig. 5B under visible light. The observed spectrum shows again europium(III) emission bands (such as in Fig. S1†), but in this case completely hiding the Raman signal of the sample. The laser line at 532 nm is coincident with the excitation band of europium(III) for the 7F0→5D1 transition (inset of Fig. 6B). In fact, Fig. 5A corresponds to a luminescence mapping of the sample. It shows that the europium(III) emission is present all over the sample, indicating a good distribution of 1 in the composite.
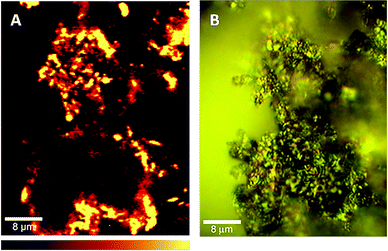 | ||
| Fig. 5 (A) Mapping of 1/GO composite obtained using the integrated intensity of the 2576–2763 cm−1 band, in a confocal Raman microscope (using a 532 nm laser). (B) A photograph of the same sample region under visible light. The bottom bar shows the colour profile, with signal-integrated intensity increasing from left to right. | ||
Fig. 6A shows the emission spectra of the 1/GO composite under UV excitation acquired both at 10 K (line 3) and room temperature (line 1). The spectra are similar, revealing the same energy and full width at half maximum (fwhm) for the typical Eu3+ 5D0→7F0–4 transitions. The presence of a single component for the 5D0→7F0 transition and a Stark splitting in 3 and 5 components for the 7F1–2 levels, respectively, together with the high relative intensity of the 5D0→7F2 transition points out that the Eu3+ ions occupy the same average low-symmetry local environment characterized by the absence of an inversion center. Apart from a decrease (∼ 10%) in the fwhm of the intra-4f6 transitions, the emission spectra (energy and relative intensity) resemble that of the isolated compound 1 (line 2), as illustrated in Fig. 6A, indicating that the Eu3+ local environment remains unaltered in the 1/GO nanocomposite.
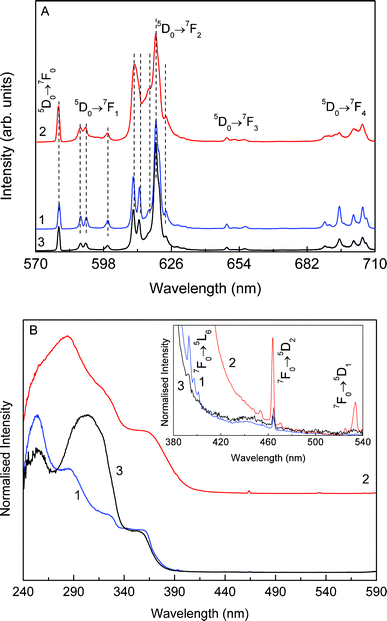 | ||
| Fig. 6 (A) Emission (excited at 360 nm) and (B) excitation (monitored at 620 nm) spectra of composite 1/GO (line 1/blue) and of compound 1 (line 2/red) acquired at 300 K, and of composite 1/GO acquired at 10 K (line 3/black). The inset in (B) shows a magnification (×103) of the excitation spectra in the spectral wavelength region between 380–540 nm. | ||
The room temperature Eu3+ excitation spectrum of 1/GO composite is composed of a large band (fwhm ∼ 150 nm) with 4 components at ∼256, 280, 330 and 368 nm superimposed in two very-low relative intensity Eu3+ 7F0→5L6, 5D2 transitions, Fig. 6B (line 1). The spectrum acquired at 10 K (line 3) resembles that measured at room-temperature, apart from a variation in the relative intensity of the 4 components, the one at ∼255 nm being the most intense one at room temperature. In both cases, the low relative intensity of the intra-4f6 lines indicates that the main Eu3+ population path is through the broad band rather than direct excitation. Whilst with different relative intensities, these broad components are also detected in the excitation spectrum of the isolated 1 (Fig. 6B, line 2), being ascribed to transitions involving the ππ* states of the chelate ring of the picOH− ligand.27
The excitation spectrum of 1 also reveals the presence of the Eu3+ 7F0→5D2, 5D1 transitions. The observed difference in the relative intensity of the picOH−-related bands and the presence of distinct intra-4f6 transitions in the excitation spectra of the 1/GO nanocomposite and isolated 1 suggests an effective interaction between the organic picOH− ligands and the graphene.
The 5D0 emission decay curves monitored within the 5D0→7F2 transition under direct intra-4f6 excitation (5D2, 464 nm) and within the picOH− excited states (254–355 nm), reveal, in all of the cases, a single exponential behavior (Fig. S3 and S4, supplementary material†) in good agreement with the presence of a single average Eu3+ local environment. The 5D0 were obtained by fitting the experimental data with a single exponential function yielding the lifetime values of 0.407 ± 0.027 and 0.648 ± 0.018 at room temperature and 10 K, respectively, under direct intra-4f6 excitation (Table S1†). The 5D0 lifetime value is substantially higher (∼ 60%) at 10 K, when compared with that measured at 300 K, suggesting the presence of thermally activated non-radiative mechanisms. At both temperatures, under excitation into the organic ligand levels it is observed an increase in the 5D0 lifetime values (Table S1†). This fact can be explained by the presence of an intermediate state (related with picOH−) that mediates energy transfer within the material, as recently proposed.32 Independently of the excitation wavelength, the 5D0 lifetime value of the composite material is smaller than that of the isolated 1 (Fig. S5, Table S1, supplementary material†) reinforcing the presence of effective interaction between the picOH− ligands and the graphene oxide.
Conclusions
The emission features of the composite 1/GO are formed of the typical 5D0→7F0-4 transitions, whose energy, fwhm and number of Stark components resemble that of the isolated 1, indicating minor changes in the Eu3+-local coordination in both materials. Nevertheless, there is a significant decrease in the 5D0 lifetime values after incorporation in the GO (0.771 ± 0.009 ms and 0.407 ± 0.027 for 1 and 1/GO, respectively), which indicates an effective interaction between the picOH− ligands and the GO.Experimental
Materials and methods
All reagents were purchased from Aldrich and used without further purification. Graphene oxide (GO) was obtained through the chemical exfoliation of graphite using the method previously described.8The transmission electron microscopy (TEM) characterization and energy dispersive X-ray (EDX) spectra were performed in a Tecnai T20 operated at 200 kV. Samples of powdered 1/GO were dispersed in ethanol and loaded onto a Carbon Lacey grid. The image in Fig. 5 was made with a WITec Raman imaging system using excitation from a Nd:YAG laser (532 nm) in a confocal Raman microscope. Raman spectra in Fig. 2B were performed on a Horiba Jobin Yvon LabRAM HR800 UV micro-Raman spectrometer using a 325 nm laser line. The FT-infrared spectra were recorded using a Matson 700 FTIR Spectrophotometer. Elemental analyses were performed with a CHNS-932 elemental analyser (for carbon, nitrogen and hydrogen) at the Microanalysis Laboratory and by ICP-AES at the Central Laboratory for Analysis of the University of Aveiro.
The photoluminescence spectra were recorded at room temperature and at 10 K with a modular double grating excitation spectrofluorimeter with a TRIAX 320 emission monochromator (Fluorolog-3, Horiba Scientific) coupled to a R928 Hamamatsu photomultiplier, using a front face acquisition mode. The excitation source was a 450 W Xe arc lamp. The emission spectra were corrected for detection and optical spectral response of the spectrofluorimeter and the excitation spectra were corrected for the spectral distribution of the lamp intensity using a photodiode reference detector. The emission decay curves were measured with the setup described for the luminescence spectra using a pulsed Xe–Hg lamp (6 μs pulse at half width and 20–30 μs tail).
Preparation of Na5[EuW2O6(picOH)8] (1)
An aqueous solution of 3-hydroxypicolinic acid (6.0 mmol, in 35 mL of water) was added to an aqueous solution of sodium tungstate dihydrate (15.0 mmol, in 7 mL of water). The mixture was heated to 90 °C with stirring and a hot aqueous solution of europium(III) nitrate pentahydrate (1.5 mmol, in 2 mL of water) was slowly added. The resulting mixture was stirred and kept at 90 °C for 30 min. The mixture was allowed to cool at room temperature and the solid obtained was filtered, washed with ethanol and dried in a desiccator over silica gel.Analysis for Na5[EuW2O6(picOH)8]·20H2O (1·20H2O, for abbreviation purposes the solid hydration was not included in the designation of 1): Calculated (%): C, 26.26; H, 3.31; N, 5.10; Eu, 6.9; W, 16.8; Na, 5.2. Found (%): C, 24.92; H, 1.85; N, 4.96; Eu, 6.4; W, 17.5; Na, 5.0. From EDX (Fig. S2†), analysis of the Eu:W ratios (using either sets of L or M peaks) showed a variation of compositions with stoichiometries ranging from 1![[thin space (1/6-em)]](https://www.rsc.org/images/entities/char_2009.gif) :1 to 1:3.
:1 to 1:3.
Preparation of 1/GO composite
The polyoxometalate/graphene oxide composite was prepared using a modified procedure based on the method described by Cao et al.12 as follows. Compound 1 was dissolved in chloroform (40 mL) and added to an aqueous suspension of graphene oxide (6 mg) in ultra-pure water (40 mL) resulting in a biphasic system. The 1:GO weight ratio was 2:1. The mixture was stirred overnight and the intermediate phase was filtered through a PVDF membrane. The dark brown solid 1/GO obtained was washed several times with chloroform and dried in a desiccator over silica gel.
Acknowledgements
We thank CICECO and Fundação para a Ciência e a Tecnologia (FCT, Portugal) for funding. CMG and SMAC thank FCT for the Post-Doc grant (SFRH/BPD/73191/2010) and PhD grant (SFRH/BD/68598/2010), respectively. GG thanks INL for a PhD grant. PMFJC thanks the Fundação para a Ciência e a Tecnologia and Alexander von Humboldt Foundation for Research Fellowships. We thank Dr Ute Schmidt (WITec) for the confocal Raman microscopy.References
- A. K. Geim and K. S. Novoselov, Nat. Mater., 2007, 6, 183 CrossRef CAS.
- C. N. R. Rao, A. K. Sood, K. S. Subrahmanyam and A. Govindaraj, Angew. Chem., Int. Ed., 2009, 48, 7752 CrossRef CAS.
- J. Liu, J. Tang and J. J. Gooding, J. Mater. Chem., 2012, 22, 12435 RSC.
- S. Zhu, S. Tang, J. Zhang and B. Yang, Chem. Commun., 2012, 48, 4527 RSC.
- J. Shen, Y. Zhu, X. Yang and C. Li, Chem. Commun., 2012, 48, 3686 RSC.
- S. Bai and X. Shen, RSC Adv., 2012, 2, 64 RSC.
- Y. Lu, Y. Jiang, W. Wei, H. Wu, M. Liu, L. Niua and W. Chen, J. Mater. Chem., 2012, 22, 2929 RSC.
- G. Goncalves, P. Marques, C. M. Granadeiro, H. I. S. Nogueira, M. K. Singh and J. Gracio, Chem. Mater., 2009, 21, 4796 CrossRef CAS.
- A. Gutes, B. Hsia, A. Sussman, W. Mickelson, A. Zettl, C. Carraro and R. Maboudian, Nanoscale, 2012, 4, 438 RSC.
- J. Yao, Y. Sun, M. Yang and Y. Duan, J. Mater. Chem., 2012, 22, 14313 RSC.
- Chao Zhao, Lingyan Feng, Bailu Xu, Jinsong Ren and Xiaogang Qu, Chem.–Eur. J., 2011, 17, 7007 CrossRef CAS.
- Y. Cao, T. Yang, J. Feng and P. Wu, Carbon, 2011, 49, 1502 CrossRef CAS.
- J. Y. Kim, J. B. Lee, H. J. Kim, K. Shin, Y.-S. Yu and Y. Oh, Bull. Korean Chem. Soc., 2010, 31, 1485 CrossRef CAS.
- B. K. Gupta, P. Thanikaivelan, T. N. Narayanan, L. Song, W. Gao, T. Hayashi, A. L. M. Reddy, A. Saha, V. Shanker, M. Endo, A. A. Martí and P. M. Ajayan, Nano Lett., 2011, 11, 5227 CrossRef.
- Zunli Mo, Yongxia Zhao, Ruibin Guo, Pengwei Liu and Tingting Xie, Mater. Manuf. Processes, 2012, 27, 494 CrossRef CAS.
- R. A. S. Ferreira, S. S. Nobre, C. M. Granadeiro, H. I. S. Nogueira, L. D. Carlos and O. L. Malta, J. Lumin., 2006, 121, 561 CrossRef.
- C. M. Granadeiro, R. A. S. Ferreira, P. C. R. Soares-Santos, L. D. Carlos, T. Trindade and H. I. S. Nogueira, J. Mater. Chem., 2010, 20, 3313 RSC.
- F. L. Sousa, M. Pillinger, R. A. S. Ferreira, C. M. Granadeiro, A. M. V. Cavaleiro, J. Rocha, L. D. Carlos, T. Trindade and H. I. S. Nogueira, Eur. J. Inorg. Chem., 2006, 726 CrossRef CAS.
- D. Zhou and B.-H. Han, Adv. Funct. Mater., 2010, 20, 2717 CrossRef CAS.
- D. F. Rohlfing and A. Kuhn, Carbon, 2006, 44, 1942 CrossRef CAS.
- H. Li, S. Pang, X. Feng, K. Mullen and C. Bubeck, Chem. Commun., 2010, 46, 6243 RSC.
- H. Li, S. Pang, S. Wu, X. Feng, K. Mullen and C. Bubeck, J. Am. Chem. Soc., 2011, 133, 9423 CrossRef CAS.
- G. Moon, Y. Park, W. Kim and W. Choi, Carbon, 2011, 49, 3454 CrossRef CAS.
- R. Liu, S. Li, X. Yu, G. Zhang, S. Zhang, J. Yaoc and L. Zhi, J. Mater. Chem., 2012, 22, 3319 RSC.
- S. Wen, W. Guan, J. Wang, Z. Lang, L. Yan and Z. Su, Dalton Trans., 2012, 41, 4602 RSC.
- P. C. R. Soares-Santos, H. I. S. Nogueira, V. Félix, M. G. B. Drew, R. A. S. Ferreira, L. D. Carlos and T. Trindade, Chem. Mater., 2003, 15, 100 CrossRef CAS.
- C. M. Granadeiro, R. A. S. Ferreira, P. C. R. Soares-Santos, L. D. Carlos and H. I. S. Nogueira, Eur. J. Inorg. Chem., 2009, 5088 CrossRef CAS.
- Z.-M. Wang, W. Wang, N. Coombs, N. Soheilnia and G. A. Ozin, ACS Nano, 2010, 4, 7437 CrossRef CAS.
- H. Yang, F. Li, C. Shan, D. Han, Q. Zhang, L. Niu and A. Ivaska, J. Mater. Chem., 2009, 19, 4632 RSC.
- S. M. O. Quintal, H. I. S. Nogueira, H. M. Carapuca, V. Felix and M. G. B. Drew, J. Chem. Soc., Dalton Trans., 2001, 3196 RSC.
- R. Arsat, M. Breedon, M. Shafiei, P. G. Spizziri, S. Gilje, R. B. Kaner, K. Kalantar-zadeh and W. Wlodarski, Chem. Phys. Lett., 2009, 467, 344 CrossRef CAS.
- R. A. S. Ferreira, M. Nolasco, A. C. Roma, R. L. Longo, O. L. Malta, L. D. Carlos, Chem.–Eur. J., 2012 DOI:10.1002/chem.201201736.
Footnote |
| † Electronic Supplementary Information (ESI) available: Raman spectra of 1 and 1/GO composite obtained with a 514 nm laser line; EDX spectrum of the composite 1/GO; emission decay curves of 1 and 1/GO acquired at room-temperature and at 10 K. See DOI: 10.1039/c2ra21388e/ |
| This journal is © The Royal Society of Chemistry 2012 |