Glucose- and temperature-responsive core–shell microgels for controlled insulin release
Lei
Sun
a,
Xinge
Zhang
*a,
Chao
Zheng
a,
Zhongming
Wu
b,
Xiaoting
Xia
a and
Chaoxing
Li
*a
aKey Laboratory of Functional Polymer Materials of Ministry Education, Institute of Polymer Chemistry, Nankai University, Tianjin 300071, China. E-mail: zhangxinge@nankai.edu.cn; lcx@nankai.edu.cn; Fax: +86-22-23505598; Tel: +86-22-23501645
bKey Laboratory of Hormones and Development (Ministry of Health), Metabolic Diseases Hospital, Tianjin Medical University, Tianjin 300070, China
First published on 15th August 2012
Abstract
In this paper, a novel core–shell microgel was prepared based on poly(N-isopropylacrylamide-co-3-acrylamidophenylboronic acid-co-dextran-maleic acid) (p(NIPAM-co-AAPBA-co-Dex-Ma)) coated silica nanoparticles via radical polymerization. The core–shell microgels presented glucose- and temperature-sensitivity, and the shell thickness could be easily regulated by the molar ratio of the comonomers. The polymer shell was active in drug loading as it underwent a distinct transition from a swollen state to a collapsed state as the temperature increased. Insulin was applied as a model drug and the behaviors of insulin loading/release were investigated. The insulin loading was temperature-dependent and up to 20%. The cumulative release of insulin in vitro showed that insulin release was dependent on glucose concentration. The glucose sensitivity of the microgels could be adjusted simply by adjusting the pH. The cytotoxicity assay indicated that the core–shell microgels have good biocompatibility. These results showed that the core–shell microgels have potential for a controlled insulin release system.
1. Introduction
Microgel crosslinked polymeric particles of micrometer- or submicrometer-size have attracted increasing attention for polymer-based drug delivery systems, which is due to their unique advantages: tunable size, large surface area for multivalent bioconjugation, and interior network for the incorporation of biomolecules.1,2 Recently, the core–shell microgels that consist of inorganic nanoparticles within a synthetic responsive polymer shell have attracted greater attention owing to their biomedical applications. The microgels are synthesized on the periphery of harder particles (e.g. silica,3,4 iron oxide5,6 and gold 7–9). Through this method, the surface properties of the hydrogel are translated to the core, imparting new functions to the material.Among the usual polymer shells, one example of a stimuli-responsive polymer is temperature-responsive poly(N-isopropylacrylamide) (PNIPAM). PNIPAM undergoes a phase transition from a soluble state to an insoluble state when heated above its lower critical solution temperature, which is ∼32 °C.10 Moreover, the copolymerization of other stimuli monomers prepares the microgels that exhibit not only temperature- but also pH-,11–14 glucose-,11,15 ionic strength-,16 and magnetic-field-responsivity.17
In particular, chemical-stimuli responsive polymers, such as ones with a recognized concentration change in a certain molecule, have become increasingly important with their potential uses in drug delivery systems. One representative molecule is glucose. Many attempts have been directed at the design of glucose-sensitive polymers. Phenylboronic acid functionalized polymeric materials, which undergo remarkable volume changes in response to glucose concentration changes, have been developed for drug delivery systems. Zhang et al. reported that a hydrogel containing phenylboronic acid and N-isopropylacrylamide showed a rapid response to glucose at physiological temperatures.18 Xing et al. further studied the kinetics of the glucose-induced swelling of the poly(N-isopropylacrylamide-co-3-acryl amidophenylboronic acid) microgel and concluded that the swelling rate of the microgel was much faster than the macroscopic hydrogel beads with the same components.19 For these materials, little work, however, has been done to explore their biocompatibility and glucose-sensitivity under physiological conditions, and insulin release under varying environmental conditions such as temperature and glucose concentration. As we know, the system utilizes phenylboronic acid as a glucose-binding component, a synthetic molecule capable of reversibly binding with 1,2- or 1,3-diols including glucose. However, phenylboronic acid also has a disadvantage, which is due to the fact that boronic acid-containing compounds have some degree of cytotoxic activity.20 To overcome this problem, it is necessary to introduce biocompatible compounds. Carbohydrate-immobilized materials, which play an important role in a variety of biological phenomena, have recently attracted great interest due to their biological functions.21–24 Besides, the abundant hydroxyl groups of carbohydrates are responsible for the hydrophilicity and biocompatibility of carbohydrate-immobilized materials.25–28
In response, we focused on the synthesis and optimization of phenylboronic acid functionalized core–shell hybrid microgels, which possess a well-defined glucose swelling or deswelling response under a range of environmental conditions (especially glucose) and good biocompatibility as drug vehicles. In the present work, we report the synthesis of a new type of hybrid microgel with a core–shell structure and optimization of an environmentally and colloidally stable shell with glucose-responsive capabilities. In particular, the functional group composition of the shell on the hybrid microgel and the thermal phase transition can be engineered to produce novel tunable glucose responses. For phenylboronic acid groups, the introduction of Dex-Ma has improved the hydrophilicity, biocompatibility and glucose-sensitivity under physiological conditions as a crosslinker. Furthermore, the multiresponsive properties of the functionalized shell are constructively applied to regulate glucose-induced swelling, based on the simultaneous triggering of multiple types of phase transition. Importantly, insulin can be easily entrapped into the hybrid core–shell microgels in the presence of thermo-sensitive NIPAM. The in vitro release of insulin was carried out. Finally, the cyto-compatibility of the microgels was evaluated by the MTT method.
2. Experiment
2.1 Materials
Tetraethoxysilane (TEOS) was purchased from Kemiou chemical Co. Ltd. (Tianjin, China). 3-(Methacryloxy)propyltrimethoxysilane (MPS) from Sigma-Aldrich (CA, America) and distilled under vacuum. 3-Aminophenylboronic acid monohydrate was purchased from Nanjing Kangmanlin Chemical Industry Co. Ltd. (Nanjing, China). Maleic anhydride and ammonium persulfate (APS) was supplied by the Tianjin No. 2 Chemical Reagent Factory (Tianjin, China). 3-(4,5-Dimethylthiazol-2-yl)-2,5-diphenyltetrazolium bromide (MTT) was purchased from Sigma-Aldrich (CA, America). Dextran (MW 50![[thin space (1/6-em)]](https://www.rsc.org/images/entities/char_2009.gif) 000) was purchased from ACROS Company (Beijing, China). N-Isopropylacrylamide (NIPAM) and lithium chloride were obtained from Sigma-Aldrich (CA, America) and dried at 70 °C in a vacuum oven overnight. Acryloyl chloride was prepared by refluxing acrylic acid and thionyl chloride for 8 h at 90 °C in our laboratory and was freshly distilled before use. All other reagents were of analytical grade and were used without further purification.
000) was purchased from ACROS Company (Beijing, China). N-Isopropylacrylamide (NIPAM) and lithium chloride were obtained from Sigma-Aldrich (CA, America) and dried at 70 °C in a vacuum oven overnight. Acryloyl chloride was prepared by refluxing acrylic acid and thionyl chloride for 8 h at 90 °C in our laboratory and was freshly distilled before use. All other reagents were of analytical grade and were used without further purification.
2.2 Synthesis of 3-(methacryloxy)propyltrimethoxysilane modified silica (MPS–SiO2)
Silica nanoparticles were prepared according to the classical Stöber method.29 Briefly, 0.5 mL TEOS was added to the mixture of 25 mL ethanol (95%), 1 mL deionized water, and 1 mL of an aqueous solution of 29% ammonium under vigorous stirring at room temperature, and the reaction was continued for a further 24 h by constant stirring. Then, excess MPS (250 mg, 1.0 mmol) was added to the above silica particles under stirring and the mixture was stirred for another 48 h at room temperature.30 The resultant MPS–SiO2 nanoparticles were purified by centrifugation, decantation and resuspension in ethanol with ultrasonic bathing three times. MPS–SiO2 nanoparticles were dried in a vacuum oven at 50 °C until they reached a constant weight.2.3 Synthesis of dextran-maleic acid
The dextran-maleic acid was synthesized as previously reported.31 Dextran (445 mg) was dissolved in 20 mL LiCl–DMF (10 wt%) solvent system at 90 °C under nitrogen gas. After dextran was clearly dissolved and cooled down to 60 °C, 0.032 mL triethylamine was introduced to the dextran solution as a catalyst, and was stirred for 15 min. Maleic anhydride (2.205 g) was then added to the reaction flask. The reaction last for 8 h. The reaction product was precipitated with cold isopropyl alcohol, filtered, washed three times with isopropyl alcohol, and then dried at room temperature in a vacuum oven.2.4 Synthesis of 3-acrylamidophenylboronic acid (AAPBA)
AAPBA was synthesized as described by Shiomori et al.32 Briefly, 3-aminophenylboronic acid (7.44 g) was dissolved in 40 mL sodium hydroxide (3.20 g) solution and cooled in an ice bath. Freshly distilled acryloyl chloride (3.2 mL, 40 mmol) was dripped into the above solution under stirring. After cooling to room temperature, the reaction mixture was stirred for another 2 h. The pH of the mixture was adjusted to pH 8 using dilute HCl (0.1 M). The resulting precipitate was filtered and washed with cold water several times. The precipitate was dissolved in 80 mL distilled water heated to 80 °C, and the residual insoluble impurities were filtered off. The product was obtained by crystallization of the solution. The crystals were filtered, washed with cold distilled water, and dried in a vacuum oven.2.5 Synthesis of core–shell SiO2@p(NIPAM-co-AAPBA-co-Dex-Ma) microgels
Monodisperse SiO2@p(NIPAM-co-AAPBA-co-Dex-Ma) core–shell microgels were synthesized in the presence of silica nanoparticles as seeds by the polymerization of NIPAM, AAPBA and Dex-Ma with APS as the initiator in water. Briefly, MPS–SiO2 nanoparticles, AAPBA, NIPAM and Dex-Ma solutions were added into a 50 mL three-necked flask fitted with a reflux condensing tube. The reaction mixture was heated to 70 °C and bubbled with nitrogen gas for 1 h, and then APS was added as an initiator. The reaction system was held for another 8 h until the reaction was complete. After polymerization, the resultant SiO2@p(NIPAM-co-AAPBA-co-Dex-Ma) core–shell microgels were purified by centrifugation and washed with distilled water three times. Furthermore, the silica core was partially dissolved by treatment with adequate HF solution (5 wt%) for 5 min, followed by multiple centrifugation–washing cycles. The washing cycles were repeated as necessary until the pH of the suspension became constant.2.6 Characterization of the microgels
The FTIR spectra the of samples were recorded in KBr pellets in a Fourier Transform Infrared Spectrometer (Bio-Rad FTS-6000) in the range 4000–300 cm−1 for 32 scans. The hydrodynamic diameter and size distribution of the resultant microgels were determined by dynamic light scattering (DLS) using a laser light scattering spectrometer (BI-200SM) equipped with a digital correlator (BI-9000AT). All the samples were prepared from the suspension with a concentration of 10 μg mL−1 after ultrasonic irradiation and were then measured at different pH values, glucose concentrations and temperatures. The hydrodynamic diameter (Dh) and the polydispersity index (PDI) of the size distribution were obtained by cumulant analysis. The morphology of the resultant microgels was determined by transmission electron microscopy (TEM). Samples for TEM characterization were dispersed in solvent and a drop of the dispersion was spread onto the surface of a copper grid coated with a carbon membrane and then dried under vacuum at room temperature for characterization. The thermo-gravimetric analysis of the microgels, using 9–10 mg per sample, was conducted in nitrogen, at a heating rate of 10 °C min−1, using a thermo-gravimetric analyzer (TGA, TG 209,NETZSCH). The real compositions of the shell were tested by Element analysis (vario EL CUBE).2.7 Encapsulation of insulin
Insulin loading was accomplished by equilibrium partitioning of insulin into the microgels. In a typical loading study, insulin (0.5, 1, and 2 mg mL−1) was added to 5 mL of the microgel dispersion (0.4 mg mL−1, pH 8.5), and then the dispersion was cooled to 4 °C, stored for 24 h, then heated quickly to 37 °C and stored for 10 min. The association efficiency of insulin was determined on the separation of microgels from the dispersion containing free insulin by centrifugation (15![[thin space (1/6-em)]](https://www.rsc.org/images/entities/char_2009.gif) 000 rpm, 30 min). The amount of free insulin in the collected supernatant was measured by the Bradford method,33 using a UV spectrometer (Shimadzu UV-2550) at 595 nm. Insulin association efficiency (AE) and loading capacity (LC) were calculated using the following equations:
000 rpm, 30 min). The amount of free insulin in the collected supernatant was measured by the Bradford method,33 using a UV spectrometer (Shimadzu UV-2550) at 595 nm. Insulin association efficiency (AE) and loading capacity (LC) were calculated using the following equations: | (1) |
 | (2) |
All measurements were performed in triplicate and averaged.
2.8 In vitro release from core–shell microgels
Insulin release from the core–shell microgels was analyzed by incubating the microgels in PBS with different glucose concentrations (0 and 3 mg mL−1, pH 7.5) and different pH values (pH = 6.3, 7.4 and 9.0) at 37 °C while shaking (100 rev min−1). At predetermined time-points, samples were centrifuged at 17![[thin space (1/6-em)]](https://www.rsc.org/images/entities/char_2009.gif) 000 rpm for 5 min and the supernatant was taken and replaced by fresh PBS. The amount of free insulin was determined by the Bradford method and a calibration curve was generated using blank microgels to correct for the intrinsic absorption of the polymer. In each experiment, the samples were analyzed in triplicate and error bars represented the standard deviation.
000 rpm for 5 min and the supernatant was taken and replaced by fresh PBS. The amount of free insulin was determined by the Bradford method and a calibration curve was generated using blank microgels to correct for the intrinsic absorption of the polymer. In each experiment, the samples were analyzed in triplicate and error bars represented the standard deviation.
2.9 Circular dichroism spectroscopy
The stability of the released insulin was determined by analysis of the conformation of released insulin using circular dichroism (CD) and the resulting spectrum was compared to standard insulin. The standard insulin solution was prepared in PBS (pH 7.4) to a final concentration of 0.1 mg mL−1. CD measurements were performed on a Jasco J-715 CD spectropolarimeter at 25 °C with a cell length of 0.1 cm. For the far-UV CD spectra, samples were scanned from 190 to 260 nm and accumulated 10 times, at a resolution of 1.0 nm and a scanning speed of 100 nm min−1. All CD data are expressed as mean residue ellipticity.2.10 Cell viability
Cell viability was evaluated by using A549 cells. The cell line was cultured in Minimum Essential Medium (MEM) in a humidified atmosphere (5% CO2–95% O2). The cells were seeded into 96-well plates at 5000 cells per well. The plates were then returned to the incubator and the cells were allowed to grow to confluence for 24 h. Various samples were dispersed in DI water. The resulting suspension was diluted with the culture medium to give a final range of concentrations from 50 to 400 μg mL−1. Then the medium in the wells was replaced with the pre-prepared culture medium sample mixture (0.2 mL). The plates were then returned to the incubator and maintained in 5% CO2 at 37 °C for 24 and 48 h, respectively. After incubation of the culture medium, 0.2 mL MTT solution was used to replace the mixture in each well. The plates were incubated for a further 4 h in 5% CO2 at 37 °C prior to removal of the culture medium and MTT. DMSO (0.15 mL) was added to each well to dissolve the formazane crystals. Plates were incubated in 5% CO2 at 37 °C for 10 min and at 6 °C for 15 min prior to determination of the optical density using a microplate reader at 570 nm. The relative cell proliferation rate was determined as a percentage of the positive control. Untreated cells were taken as a positive control, and their proliferation rate was set to 100%.343. Results and discussion
3.1 Synthesis of SiO2@p(NIPAM-co-AAPBA-co-Dex-Ma) microgels
Procedures for the synthesis of MPS–SiO2 seed particles, and pH-, temperature- and glucose-sensitive silica–polymer hybrid composite microgels are shown in Scheme 1. Monodisperse MPS–SiO2 nanoparticles with an average size of 170 nm were synthesized via the Stöber process. The morphology of the MPS–SiO2 nanoparticles was observed by TEM, as shown in Fig. 1a. MPS–SiO2 nanoparticles had a spherical shape with an average size of 170 nm and a good monodispersity.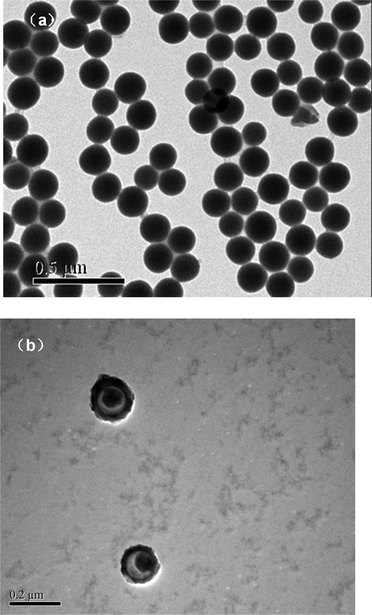 | ||
| Fig. 1 TEM micrographs: (a) MPS–SiO2 nanoparticles; (b) SiO2@p(NIPAM-co-AAPBA-co-Dex-Ma)3.5 microgels. | ||
 | ||
| Scheme 1 Synthesis of SiO2@p(NIPAM-co-AAPBA-co-Dex-Ma) core–shell microgels. | ||
Nearly monodisperse SiO2@p(NIPAM-co-AAPBA-co-Dex-Ma) core–shell microgels, prepared by the copolymerization of NIPAM, AAPBA and Dex-Ma, were obtained from the MPS–SiO2 seed particles with minor modifications of the method used in previous studies.35 The core–shell microgels with different contents of MPS–SiO2 and Dex-Ma are shown in Table 1. The resultant SiO2@p(NIPAM-co-AAPBA-co-Dex-Ma) microgels were monodisperse and uniform on a large scale. The size of the SiO2@p(NIPAM-co-AAPBA-co-Dex-Ma) microgels was in the range 172 to 283 nm. Indeed, the thickness of the newly formed p(NIPAM-co-AAPBA-co-Dex-Ma) shell varied from 7 to 56 nm. Moreover, the shell thickness of the microgels increased with an increase of Dex-Ma or a decrease of MPS–SiO2 seeds. TEM images of SiO2@p(NIPAM-co-AAPBA-co-Dex-Ma) microgels are shown in Fig. 1b.The successful formation of a uniform polymeric shell on the surface of SiO2 can be clearly observed under TEM due to the difference between the inorganic silica core and the organic p(NIPAM-co-AAPBA-co-Dex-Ma) shell.
| Samples | MPS–SiO2 (mg) | AAPBA (mg) | Dex-Ma (mg) | NIPAM (mg) | APS (mg) | D n (nm) | PDI | Shell thicknessc (nm) |
|---|---|---|---|---|---|---|---|---|
a SiO2@p(NIPAM-co-AAPBA-co-Dex-Ma)0.35 stands for the reaction between Dex-Ma and SiO2 with a mass ratio of 35![[thin space (1/6-em)]](https://www.rsc.org/images/entities/char_2009.gif) : :![[thin space (1/6-em)]](https://www.rsc.org/images/entities/char_2009.gif) 10.
b Diameter (Dn) was measured by DLS.
c Shell thickness is calculated from the relation: (Dcore–shell − DMPS–SiO2)/2, where Dcore–shell is the size of the microgels, and DMPS–SiO2 is the size of the MPS–SiO2 nanoparticles. 10.
b Diameter (Dn) was measured by DLS.
c Shell thickness is calculated from the relation: (Dcore–shell − DMPS–SiO2)/2, where Dcore–shell is the size of the microgels, and DMPS–SiO2 is the size of the MPS–SiO2 nanoparticles.
|
||||||||
| SiO2@p(NIPAM-co-AAPBA-co-Dex-Ma)3.5a | 10 | 13.5 | 35 | 70 | 4 | 256.0 ± 4.5 | 0.033 | 42.0 ± 2.3 |
| SiO2@p(NIPAM-co-AAPBA-co-Dex-Ma)4.5 | 10 | 13.5 | 45 | 70 | 4 | 283.9 ± 3.7 | 0.014 | 56.0 ± 1.9 |
| SiO2@p(NIPAM-co-AAPBA-co-Dex-Ma)0.875 | 40 | 13.5 | 35 | 70 | 4 | 185.8 ± 4.1 | 0.034 | 7.0 ± 2.1 |
| MPS–SiO2 | — | — | — | – | – | 172.0 ± 2.5 | 0.024 | – |
The FT-IR spectrum of MPS–SiO2 is shown in Fig. 2a. A strong peak at 1100 cm−1 and medium-sized peaks at 806 and 942 cm−1 correspond to the symmetrical and asymmetrical vibrations of the Si–O–Si bond and the stretching vibration of the hydroxyl group, respectively. The band at 1630 cm−1 was assigned to the stretching vibration of the vinyl groups of the MPS component, indicating that carbon–carbon double bonds were introduced onto the surface of the MPS–SiO2 nanoparticles. These double bonds can serve as initiation sites in the subsequent surface-initiated polymerization process, to produce the silica–polymer hybrid microgels.
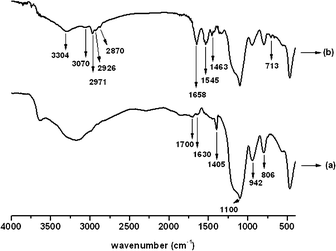 | ||
| Fig. 2 FT-IR spectra: (a) MPS–SiO2 nanoparticles; and (b) SiO2@p(NIPAM-co-AAPBA-co-Dex-Ma)3.5 microgels. | ||
The FT-IR spectrum of SiO2@p(NIPAM-co-AAPBA-co-Dex-Ma) microgels (Fig. 2b) shows that the characteristic peak of the vinyl group at 1630 cm−1 has disappeared completely. The peak between 2900 and 3000 cm−1 represented the C–H vibration of the methyl group in the NIPAM segment. A strong peak at 1658 cm−1 was ascribed to the typical stretching vibration of C![[double bond, length as m-dash]](https://www.rsc.org/images/entities/char_e001.gif) O, indicating that the Dex-Ma segments were incorporated into the shell layer of the resultant microgels. The presence of weak peaks at 713 cm−1 was assigned to the out-of-plane bending vibration for the C–H group of m-substituted benzene in the AAPBA segment. Taken together, these results suggest the successful synthesis of SiO2@p(NIPAM-co-AAPBA-co-Dex-Ma) microgels.
O, indicating that the Dex-Ma segments were incorporated into the shell layer of the resultant microgels. The presence of weak peaks at 713 cm−1 was assigned to the out-of-plane bending vibration for the C–H group of m-substituted benzene in the AAPBA segment. Taken together, these results suggest the successful synthesis of SiO2@p(NIPAM-co-AAPBA-co-Dex-Ma) microgels.
Thermo-gravimetric (TG) and derivative thermo-gravimetric (DTG) curves for the microgels are shown in Fig. 3. It can be seen from the DTG curves (Fig. 3A) that there were three distinct degradations at 70, 150, and 390 °C. The first degradation, with a weight loss of 5%, was assigned to free water and water linked by hydrogen bonds, which were released at 25–135 °C and reached a maximum at 70 °C. The second degradation, which was maximized around 150 °C, corresponds to the thermal decomposition of the pendant sugar residue. The last stage of thermal degradation, occurring between 325 and 450 °C, displayed peaks with a maximum value of 390 °C and was assigned to the thermal degradation of the backbone.36 At this stage, the decrease in the weight of the microgels was approximately 30% and 35%, respectively, as the initial mass of Dex-Ma increased from 35 to 45 mg. The changes in microgel weight were calculated from the thermo-gravimetric curves displayed in Fig. 3B.
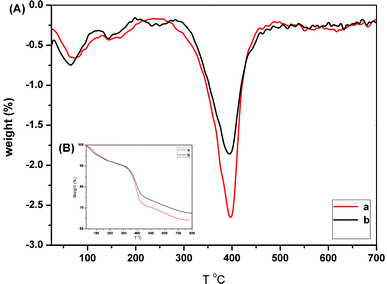 | ||
| Fig. 3 Thermal analysis of (a) SiO2@p(NIPAM-co-AAPBA-co-Dex-Ma)3.5 and (b) SiO2@p(NIPAM-co-AAPBA-co-Dex-Ma)4.5 microgels: DTG (A), and TG (B) curves. | ||
The shell compositions of the microgels with different initial monomers were further determined by elemental analysis. The results indicate that the NIPAM and AAPBA contents in SiO2@p(NIPAM-co-AAPBA-co-Dex-Ma)3.5 were 57.6% and 29.4% while they were 54.4% and 32.7% in SiO2@p(NIPAM-co-AAPBA-co-Dex-Ma)4.5, respectively. Moreover, the thickness of the shell increased as the Dex-Ma initial dosage increased, and it had little influence on the components of the final shells.
3.2. Multi-sensitivity of SiO2@p(NIPAM-co-AAPBA-co-Dex-Ma) microgels
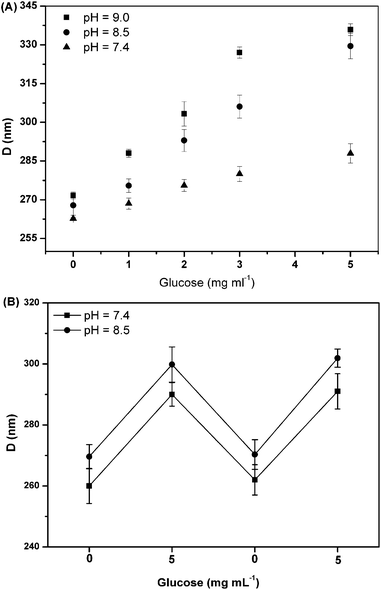 | ||
| Fig. 4 (A) Average hydrodynamic diameter of the SiO2@p(NIPAM-co-AAPBA-co-Dex-Ma)3.5 core–shell microgels as a function of glucose concentrations under different pH values. (B) Reversibility of the SiO2@p(NIPAM-co-AAPBA-co-Dex-Ma)3.5 core–shell microgels at different pH values. | ||
 | ||
| Fig. 5 Equilibria of (alkylamido)phenylboronic acid in an aqueous solution in the presence of glucose. | ||
Additionally, the reversibility of the SiO2@p(NIPAM-co-AAPBA-co-Dex-Ma)3.5 core–shell microgels was also studied. As we the adjusted glucose concentration (PBS buffer solution, pH = 7.4) from 0 to 5 mg mL−1, its diameter increased from 260 to 289 nm. Then we removed glucose by dialysis and its diameter dropped to 261 nm, very close to its initial state without glucose. Again, we change the glucose concentration to 5 mg ml−1, and its diameter increased back to 291 nm. Moreover, when we repeated these experiments in PBS buffer solution with pH = 8.5, the microgels displayed similar characteristics, as shown in Fig. 4B. All of the above showed that microgels had good reversibility.
The temperature-stimuli volume transition of the microgels was recorded by DLS measurement as shown in Fig. 6A. The size of SiO2@p(NIPAM-co-AAPBA-co-Dex-Ma)3.5 decreased considerably from 265 to 220 nm when the temperature increased from 25 to 50 °C, whereas the size of sample SiO2@p(NIPAM-co-AAPBA-co-Dex-Ma)4.5 decreased from 291 to 236 nm under the same conditions. The results confirm the thermo-responsive characteristics of the resultant microgels and it reveals very good swollen–deswollen properties over a relatively wide range of temperatures. The effect of temperature on size at different pH values was further evaluated using SiO2@p(NIPAM-co-AAPBA-co-Dex-Ma)3.5 as a sample (Fig. 6B). At pH 7.5, the microgel size decreased from 270 to 222 nm as the temperature increased from 25 to 50 °C, whereas the size decreased from 287 to 220 nm at pH 9.0. The results show that the swelling behaviors were almost the same at different pH values. Such a temperature response of the microgels offered a convenient method of drug loading.
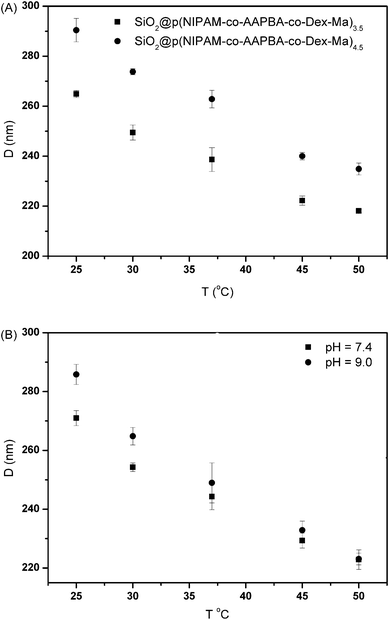 | ||
| Fig. 6 Average hydrodynamic diameter of the core–shell microgels as a function of temperature: (A) different samples; (B) SiO2@p(NIPAM-co-AAPBA-co-Dex-Ma)3.5 at different pH values. | ||
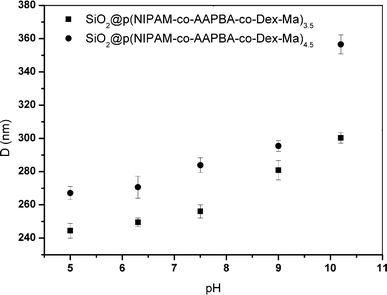 | ||
| Fig. 7 Average hydrodynamic diameter of the core–shell microgels as a function of pH value at 25 °C. | ||
3.3 Drug loading and in vitro release study
Encapsulation efficiency (EE) and loading capacity (LC) of the microgels are shown in Table 2, which clearly indicates that the encapsulation efficiency of these microgels was affected by the loading temperature and the initial concentration of insulin. As the initial concentration of insulin was increasing, EE decreased slowly while LC increased. As shown in Table 2, both microgels have a higher encapsulation efficiency at 4 °C than at 37 °C, from a peak of 30% to no more than 5%, which is due to the temperature-sensitive shell of the microgels presenting a swollen state at a lower temperature, which facilitates an enhancement in LC.| Samples | Insulin concentration (mg mL−1) | LC (%) | EE (%) |
|---|---|---|---|
| a Operated at 37 °C. | |||
| SiO2@p(NIPAM-co-AAPBA-co-Dex-Ma)3.5 | 0.5 | 19.4 ± 3.4 | 83.3 ± 7.3 |
| 1.0 | 25.2 ± 2.8 | 72.6 ± 11.8 | |
| 2.0 | 30.3 ± 2.3 | 68.8 ± 9.7 | |
| 2.0a | 4.1 ± 2.2 | 20.6 ± 3.1 | |
| SiO2@p(NIPAM-co-AAPBA-co-Dex-Ma)4.5 | 0.5 | 17.4 ± 2.4 | 85.3 ± 8.4 |
| 1.0 | 28.3 ± 1.8 | 62.6 ± 5.8 | |
| 2.0 | 30.4 ± 4.3 | 58.8 ± 7.7 | |
| 2.0 | 4.4 ± 1.9 | 21.8 ± 3.2 | |
Fig. 8 showed the cumulative release profiles of insulin from insulin-loaded microgels at 37 °C in pH 7.4 PBS at different concentrations of glucose. The cumulative release percentage was the total amount of insulin released at a specific time divided by the amount of insulin loaded in the sample. In detail, without glucose, both SiO2@p(NIPAM-co-AAPBA-co-Dex-Ma)3.5 and SiO2@p(NIPAM-co-AAPBA-co-Dex-Ma)4.5 microgels showed a burst release around 20% and then reached release equilibrium at about 30% within 3 h (Fig. 8a,c). This is because some of insulin was adsorbed onto the surface during insulin loading, and then diffused rapidly when the microgels came into contact with the release medium. Accordingly, higher bursts of insulin (around 30%, Fig. 8b,d) were observed after treatment with 3 mg mL−1 glucose, compared to insulin release in microgels incubated in a glucose-free medium (Fig. 8a,c). For the curves in Fig. 8, the rate of insulin release decreased after several hours and was nearly equal at all glucose concentrations in the later monitoring time. The amounts of insulin released after 24 h for SiO2@p(NIPAM-co-AAPBA-co-Dex-Ma)3.5 and SiO2@p(NIPAM-co-AAPBA-co-Dex-Ma)4.5 were 65.6% and 73.5%, respectively, much higher than the samples in the glucose-free medium. Obviously, the final amount of insulin released was affected by the glucose concentration further, as increasing the shell thickness increased release of insulin a little. These results, combined with the fact that the particle size increased in correlation with the glucose concentration (Fig. 4), suggested that the microgels were responsive to glucose and released insulin rapidly upon exposure to glucose.
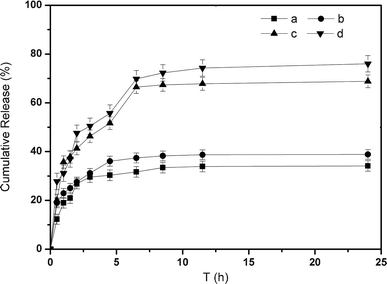 | ||
| Fig. 8 In vitro release of insulin from the microgels: SiO2@p(NIPAM-co-AAPBA-co-Dex-Ma)3.5 microgels in pH 7.4 PBS with 0 (a) and 3 (c) mg mL−1 glucose; and SiO2@p(NIPAM-co-AAPBA-co-Dex-Ma)4.5 in pH 7.4 PBS with 0 (b) and 3 (d) mg mL−1 glucose, respectively. | ||
To investigate the release behavior of the microgels under different pH, the release studies were conducted in PBS buffer solutions with different pH values (6.3, 7.4 and 9.0), respectively, containing a glucose concentration of 3 mg mL−1. The in vitro insulin cumulative release was displayed in Fig. 9. At pH 9.0, 89% insulin release was observed within 24 h while at pH 7.4, 67% insulin was released. In comparison, as the pH value was lowered to 6.3, only 29.7% insulin was released within the same amount of time. Just as was stated above, while the pH value was near the pKa of phenylboronic acid, the majority of the phenylboronic acid existed in the charged form, which facilitates the formation of a stable complex between charged phenylborate and glucose. Increasing glucose concentration enhanced the charge of the phenylborates, thus increasing the hydrophilicity of the polymer shells, resulting in shell swelling, further leading to a considerable insulin release. Consequently, the glucose responsive system affected by the pH value provides a novel sensing platform to recognize glucose through controlling the environmental stimulus, and has potential practical applications for simulating the transport properties and controlled insulin release.
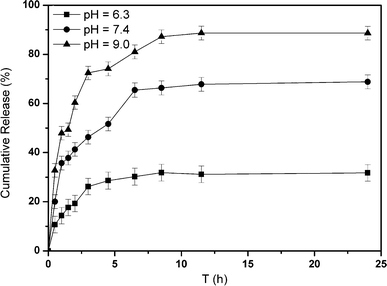 | ||
| Fig. 9 In vitro release of insulin from SiO2@p(NIPAM-co-AAPBA-co-Dex-Ma)3.5 microgels at 3 mg mL−1 glucose at different pH values, 37 °C. | ||
CD spectroscopy was used to evaluate the conformational changes in insulin.43 The far-UV CD band at 208 nm primarily arises from the α-helix structure, while that at 223 nm is for the β-helix-structure. The ratio between both bands ([Φ]208/[Φ]223]) can be used to generate a qualitative measure of the overall conformational structure of insulin. In the present work, the [Φ]208/[Φ]223 ratios for standard insulin and released insulin were 1.29 and 1.14, respectively. As indicated by the CD spectra (Fig. 10), no significant conformational change was observed for the insulin released from the SiO2@p(NIPAM-co-AAPBA-co-Dex-Ma)3.5 microgels at 3 mg mL−1 glucose at pH 7.4, in comparison with the standard insulin. Furthermore, the spectral characteristics indicated that the tertiary structure of released insulin had not been distorted.
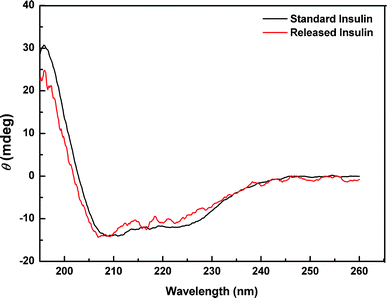 | ||
| Fig. 10 UV-CD spectra of standard insulin and released insulin. | ||
3.4 Cell viability
The cytotoxicity of MPS–SiO2 and the microgels was measured by the MTT assay, an approach widely used to measure mitochondria activity to quantify cell growth or cell death.44 Cell viability was applied to evaluate the biocompatibility of the microgels. As shown in Fig. 11(A), there was no apparent cytotoxic effect of MPS–SiO2 and the microgels up to a concentration of 400 μg mL−1 (cell viability up to 80%) within two days. However, MPS–SiO2 presented obvious cytotoxicity at 4 days (cell viability down to about 60%) with a high concentration of 400 μg mL−1, while the microgels still exhibited considerable cell viability of more than 80%, as shown in Fig. 11(B). It is interesting to note that the cell viability increased slightly with the increase in microgels. Overall, the results suggested that the multi-responsive microgels have good biocompatibility, and their potential for in vivo use is possible.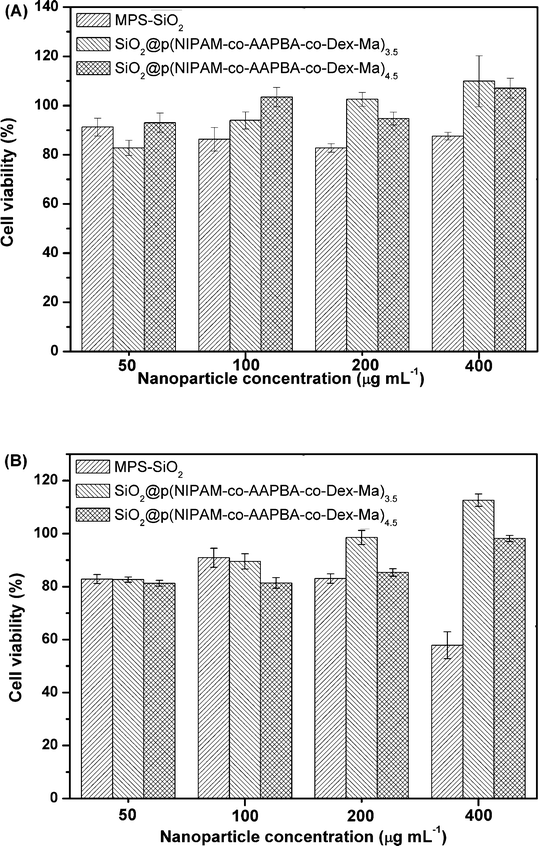 | ||
| Fig. 11 Viability of A549 cells after (A) 2 days and (B) 4 days incubation with various concentrations (50, 100, 200 and 400 μg mL−1) at 37 °C. Each value represents the mean ± SD (n = 6). | ||
4. Conclusion
In this study, a novel glucose- and temperature- responsive microgel with a SiO2 core and a p(NIPAM-co-AAPBA-co-Dex-Ma) shell was prepared. The cavity between the SiO2 core and the functional shell benefits high insulin loading, and temperature sensitivity provides a simple and effective method for insulin loading. The introduction of Dex-Ma with abundant carboxyl lowers the pKa of boronic acid close to the physiological pH, and it also enhances the biocompatibility of the microgels. The release in vitro demonstrates that the insulin release apparently depends on glucose concentration, while its glucose sensitivity can easily be adjusted by the pH value. A MTT assay indicates that there is not significant growth inhibition of A549 cells when the cells are treated by the microgels with different concentrations. This demonstrates that the glucose- and temperature-sensitive core–shell microgels therefore have potential applications in controlled insulin release.Acknowledgements
This work was supported by grants (51173085 to C. L., and 81000683 to Z. W.) from the National Natural Science Foundation of China. We thank Prof. Xinlin Yang at Institute of Polymer, Nankai University for his help with synthesis of the SiO2 nanoparticles.References
- J. K. Oha, R. Drumright, D. J. Siegwart and K. Matyjaszewski, Prog. Polym. Sci., 2008, 33, 448 CrossRef.
- Z. Y. Qiao, R. Zhang, F. S. Du, D. H. Liang and Z. C. Li, J. Controlled Release, 2011, 152, 57 CrossRef CAS.
- L. Zha, Y. Zhang, W. Yang and S. Fu, Adv. Mater., 2002, 14, 1090 CrossRef CAS.
- I. P. Santos, L. M. LizMarzán and T. Hellweg, ChemPhysChem, 2006, 7, 2298 CrossRef.
- N. Sahinera and P. Ilgina, Polymer, 2010, 51, 3156 CrossRef.
- Q. Gan, X. Y. Lu, Y. Yuan, J. G. Qian, H. J. Zhou, X. Lu, J. L. Lin and C. S. Liu, Biomaterials, 2011, 32, 1932 CrossRef CAS.
- R. C. Cáceres, A. S. Iglesias, M. Karg, I. P. Santos and J. P. Juste, Langmuir, 2009, 25, 3163 CrossRef.
- C. C. Rafael, S. I. Ana, K. Matthias, P. S. Isabel, P. J. Jorge and P. Jessica, Adv. Mater., 2008, 20, 1666 CrossRef.
- D. J. Kim, S. M. Kang, B. Kong, W. J. Kim, H. Paik, H. Choi and I. S. Choi, Macromol. Chem. Phys., 2005, 206, 1941 CrossRef CAS.
- Y. Guan and Y. J. Zhang, Soft Matter, 2011, 7, 6375 RSC.
- V. Lapeyre, N. Renaudie, J. F. Dechezelles, H. Saadaoui, S. Ravaine and V. Ravaine, Langmuir, 2009, 25, 4659 CrossRef CAS.
- L. W. Ma, M. Z. Liu, H. L. Liu, J. Chen and D. P. Cui, Int. J. Pharm., 2010, 385, 86 CrossRef CAS.
- Z. Y. Sun, C. P. Han, L. Wen, D. M. Tian, H. B. Li and L. Jiang, Chem. Commun., 2012, 48, 3282 RSC.
- X. B. Hu, Z. Tong and L. A. Lyon, J. Am. Chem. Soc., 2010, 132, 11470 CrossRef CAS.
- V. Lapeyre, C. Ancla, B. Catargi and V. Ravaine, J. Colloid Interface Sci., 2008, 327, 316 CrossRef CAS.
- V. Bütün, A. Atay, C. Tuncer and Y. Bas, Langmuir, 2011, 27, 12657 CrossRef.
- S. Bhattacharya, F. Eckert, V. Boyko and A. Pich, Small, 2007, 3, 650 CrossRef CAS.
- S. B. Zhang, L. Y. Chu, D. Xu, J. Zhang, X. J. Ju and R. Xie, Polym. Adv. Technol., 2008, 19, 937 CrossRef CAS.
- S.Y. Xing, Y. Guan and Y. J. Zhang, Macromolecules, 2011, 44, 4479 CrossRef CAS.
- G. Achanta, A. Modzelewska, L. Feng, S. R. Khan and P. Huang, Mol. Pharmacol., 2006, 70, 426 CAS.
- J. Finkelstein, Nature, 2007, 446, 999 CrossRef CAS.
- P. H. Seeberger and D. B. Werz, Nature, 2007, 446, 1046 CrossRef CAS.
- H. Lis and N. Sharon, Chem. Rev., 1998, 98, 637 CrossRef CAS.
- Y. Miura, J. Polym. Sci., Part A: Polym. Chem., 2007, 45, 5031 CrossRef CAS.
- S. Muthukrishnan, M. F. Zhang, M. Burkhardt, M. Drechsler, H. Mori and A. H. E. Müller, Macromolecules, 2005, 38, 7926 CrossRef CAS.
- N. Y. Xiao, A. L. Li, H. Liang and J. Lu, Macromolecules, 2008, 41, 2374 CrossRef CAS.
- Q. Yang, Z. K. Xu, Z. W. Dai, J. L. Wang and M. Ulbricht, Chem. Mater., 2005, 17, 3050 CrossRef CAS.
- Z. K. Xu, R. Q. Kou, Z. M. Liu, F. Q. Nie and Y. Y. Xu, Macromolecules, 2003, 36, 2441 CrossRef CAS.
- W. Stöber and A. Fink, J. Colloid Interface Sci., 1968, 26, 62 CrossRef.
- E. B. Lami and J. Lang, J. Colloid Interface Sci., 1999, 210, 281 CrossRef.
- S. H. Kim, C. Y. Won and C. C. Chu, J. Biomed. Mater. Res., 1999, 46, 160 CrossRef CAS.
- K. Shiomori, A. E. Ivanov, I. Y. Galaev, Y. Kawano and B. Mattiasson, Macromol. Chem. Phys., 2004, 205, 27 CrossRef CAS.
- M. S. Yavuz, Y. Cheng, J. Chen, C. M. Cobley, Q. Zhang and M. Rycenga, Nat. Mater., 2009, 8, 935 CrossRef CAS.
- O. J. Kwon, D. J. Siegwart, H. I. Lee, G. Sherwood, L. Peteanu and J. O. Hollinger, J. Am. Chem. Soc., 2007, 129, 5939 CrossRef.
- M. Ji, B. Liu, X. L. Yang and J. Y. Wan, Polymer, 2009, 50, 5970 CrossRef CAS.
- W. J. Zhou, S. S. Naik, M. J. Kurth, Y. L. Hsieh, J. M. Krochta and J. Polym, J. Polym. Sci., Part A: Polym. Chem., 1998, 36, 2971 CrossRef CAS.
- A. Matsumoto, R. Yoshida and K. Kataoka, Biomacromolecules, 2004, 5, 1038 CrossRef CAS.
- S. Piperno, L. A. Gheber, P. Canton, A. Pich, G. Dvorakova and A. Biffis, Polymer, 2009, 50, 6193 CrossRef CAS.
- X. Z. Zhang, D. Q. Wu, G. M. Sun and C. C. Chu, Macromol. Biosci., 2003, 3, 87 CrossRef CAS.
- M. Shibayama, K. Kawakubo and T. Norisuye, Macromolecules, 1998, 31, 1608 CrossRef CAS.
- R. A. Stile, W. R. Burghardt and K. E. Healy, Macromolecules, 1999, 32, 7370 CrossRef CAS.
- X. Z. Zhang, D. Q. Wu and C. C. Chu, Biomaterials, 2004, 25, 4719 CrossRef CAS.
- S. Lee, K. Kim, T. S. Kumar, J. Lee, S. K. Kim, D. Y. Lee and Y. K. Lee, Bioconjugate Chem., 2005, 6, 615 CrossRef.
- J. S. Chang, K. L. B. Chang, D. F. Hwang and Z.L. Kong, Environ. Sci. Technol., 2007, 41, 2064 CrossRef CAS.
| This journal is © The Royal Society of Chemistry 2012 |
