Temperature dependent phonon Raman scattering of Heusler alloy Co2MnxFe1−xAl/GaAs films grown by molecular-beam epitaxy
Zhenni
Zhan
a,
Zhigao
Hu
*a,
Kangkang
Meng
b,
Jianhua
Zhao
b and
Junhao
Chu
a
aKey Laboratory of Polar Materials and Devices, Ministry of Education, Department of Electronics Engineering, East China Normal University, Shanghai, 200241, People's Republic of China. E-mail: zghu@ee.ecnu.edu.cn; Fax: +86-21-54345119; Tel: +86-21-54345150
bState Key Laboratory of Superlattice and Microstructures, Institute of Semiconductors, Chinese Academy of Sciences, P.O. Box 912, Beijing, 100083, People's Republic of China
First published on 16th August 2012
Abstract
Co2MnxFe1−xAl full-Heusler alloy films have been grown on GaAs (001) by molecular-beam epitaxy. Three representative phonon modes observed from Raman scattering show different variation trends in the temperature range 87–873 K. The 2F1u modes at 569 and 947 cm−1 show anomalous change with increasing temperature, which can be due to the phase transition. The Curie temperature (Tc) can be evaluated as 828 K for x = 0, 823 K for x = 0.3, 818 K for x = 0.7, and 788 K for x = 1, respectively. This can be ascribed to the fact that the lattice parameter of the films becomes larger with Mn composition.
1 Introduction
Full-Heusler alloys, a relatively promising kind of ferromagnetic material, have been intensively investigated since de Groot first predicted that the Heusler alloys of NiMnSb and PtMnSb exhibit half metallic behavior. These ferromagnets possess a gap at the Fermi level in one of the spin-up and spin-down states, but exhibit metallic behavior in the others.1,2 They are now being considered as potential materials for applications in the field of spin-electronic and magneto resistive devices. On the applicable viewpoints, it is required that the ferromagnetic materials used as an electrode of magnetic tunnel junctions (MTJs) for tunneling magnetoresistance (TMR) have a high Curie temperature (Tc) as well as a high spin polarization.3 This qualification can make the devices work well at room temperature. Actual Heusler alloys belong to a group of ternary intermetallics with the stoichiometric composition X2YZ, where X and Y are transition metal atoms and Z is usually an sp-element, respectively. Among all full-Heusler alloys, Co2-based compounds are of particular interest, since they have a comparatively high Tc.4,5 It opens up a promising path to design and realize the spin-electronic devices. Recently, some theoretical investigations have been done to analyze the Tc and its intrinsic physical mechanism. For example, Umetsu et al. have reported a Tc of Co2MnAl with both the B2 and L21 phases by temperature-dependent thermomagnetization curves.6 Thoene et al. calculated the Tc values for a variety of Heusler compounds by mean-field approximation (MFA).7 The Curie points of Co2 TiGa and Co2 FeGa have been evaluated by the first-principles density functional theory combined with a linear response method.8 However, the crucial issue is still under debate because the experimental results from the material growth and characterizations are scarce.As we know, the parameter Tc is in connection with the crystalline structure. Correspondingly, the lattice vibrations and/or phonon modes, which can be perturbed by temperature, pressure, and doping, are directly related to the change of structure. Raman spectroscopy is a nondestructive and sensitive technique for investigating structure modification, which can give information on the variations of lattice vibrations.9,10 Thus, it is a powerful tool for the study of phase transformation and structure evolution. One can apparently evaluate the Tc values by investigating the evolution of phonon modes with temperature. There have been several theoretical works on the phonon modes of Heusler compounds in the past decades.11,12 However, no experimental evidence has been reported to confirm the Tc of Co-based Heusler alloys by Raman spectroscopy, regardless of the fact that the parameter is very important for spin-electronic device applications. As compared to other techniques, such as magnetic moment measurements, Raman scattering takes advantage of the direct observations of the structure and compatible experimental configuration, especially for the evaluated temperature range.9
In this paper, we present temperature-dependent ultraviolet Raman experiments to judge the critical Tc values of epitaxial Co2MnxFe1−xAl films. The variation in phonon modes with different composition and temperature effects has also been discussed in detail.
2 Experimental details
The Co2MnxFe1−xAl films with a thickness of 30 nm were deposited on GaAs (001) by the molecular-beam epitaxy method at a substrate temperature of 160 °C. The Mn composition x is varied from 0 to 1. All the films were capped with an aluminium layer of thickness 2 nm to avoid oxidation. The crystal structure and order degree were analyzed by double-crystal X-ray diffraction (DCXRD) and high-resolution transmission electron microscopy (HR-TEM). Temperature-dependent Raman scattering experiments were carried out by a Jobin-Yvon LabRAM HR 800 UV micro-Raman spectrometer, with a 2400 g mm−1 grating and an air-cooled charge-coupled device (CCD) detector. The experiments are operated on a Linkam THMSE 600 heating/cooling stage from 87 to 873 K. A He-Cd laser with a wavelength of 325 nm (3.82 eV) was applied as the exciting light. The magnetic properties of the films were obtained by a physical property measurement system (Quantum Design PPMS-9). Note that all the samples were measured at RT and no mathematical smoothing has been performed on the experimental data.3 Results and discussions
Generally, for full Heusler alloys the crystal structure can be divided into three types: L21, B2 and A2. Among all three types, the L21 structure (Fig. 1(a)) is the most ordered phase; partial disorder leads to B2 and full disorder contributes to the A2 structure. It should be noted that these ordered/disordered structures can be uniquely identified by combining XRD and TEM analysis. This is based on the following relations between atomic ordering and superlattice diffraction lines: the partially disordered B2 extinguishes the odd superlattice diffraction lines, which are defined by the index relation of h, k, and l = odd numbers, e.g., (111). However, superlattice diffraction lines [(h + k + l)/2 = 2n + 1, e.g. (200)] vanish under fully disordered A2.13 From the DCXRD data, it can be found that the effective cubic lattice constant increases from 5.68 to 5.73 Å as the Mn content increases from 0 to 1. It should be emphasized that the films have almost the same diffraction features despite having different Mn composition.14 Only the (004) diffraction peak of the Co2MnxFe1−xAl films can be observed besides the (004) and (002) diffractions from the GaAs substrate,14 indicating a perfect (001)-oriented growth in the direction perpendicular to the film plane. Nevertheless, it has been reported that the (004) reflection is the fundamental characteristic, which cannot be affected by the disorder status.15 Therefore, one can conclude that all the films are determined to be crystalline in structure, from the present XRD patterns.![(a) The crystal structure of Co2MnxFe1−xAl Heusler alloys. (b) Transmission electron micrograph of the Co2FeAl film. The inset shows fast Fourier transform (FFT) analysis performed on the area squared in the TEM image. Note that the electron beam is parallel to the [110] direction of the Co2FeAl film.](/image/article/2012/RA/c2ra21255b/c2ra21255b-f1.gif) | ||
| Fig. 1 (a) The crystal structure of Co2MnxFe1−xAl Heusler alloys. (b) Transmission electron micrograph of the Co2FeAl film. The inset shows fast Fourier transform (FFT) analysis performed on the area squared in the TEM image. Note that the electron beam is parallel to the [110] direction of the Co2FeAl film. | ||
We further carried out the HR-TEM measurements to confirm the degree of order for the as-prepared Co2MnxFe1−xAl films. In order to avoid the influence of the aluminium layer, an uncapped Co2FeAl film fabricated by the same method was taken for the HR-TEM experiment. The result is shown in Fig. 1(b) and the inset diffraction pattern shows fast Fourier transform (FFT) analysis of the HR-TEM image, which was performed by Gaten Digital Micrograph software. Both the (111) and (002) diffraction patterns can be clearly observed in the FFT analysis with the electron beam parallel to [110] zone axis of the Co2FeAl film, in which the (111) diffraction is definitely from the distinct L21 reflection.16 Several other HR-TEM images were taken from different positions of the film and fast Fourier-transform (FFT) analyses were also carried out for all of them. The results are similar, which suggests that the films belong to the same structure. It should be emphasized that the films are polycrystalline owing to different orientations of the TEM experiments. Based on the above structure analysis, the present Co2MnxFe1−xAl films can be considered as having the L21 structure.
Co2MnxFe1−xAl crystallized in the L21 structure consists of eight stacked body-centered cubic (bcc) lattice. The outer sublattice that consists of the eight cubic lattices is occupied by Co atoms, and the inner cubic sublattice that consists of the body-centered sites of each bcc lattice is regularly occupied by Fe/Mn and Al atoms.13 It can be seen that the whole crystal presents the tetrahedral Td symmetry. Meanwhile, each Fe/Mn has eight Co atoms as immediate neighbors, which sit in an octahedral symmetry position. In other words, the lattice consisting of Co atoms has Oh symmetry, where the Co atoms have two different but chemically equivalent positions. The environment of the first sublattice is the same as the environment of the second one but rotated by 90°. The occupancy of two face-centered cubic (fcc) sublattices by the Co atoms separates the full-Heusler alloys with the L21 structure from the half-Heusler compounds with the Clb structure, in which only one sublattice is occupied while the other is empty. Note that the L21 structure, which belongs to space group Fm![[3 with combining macron]](https://www.rsc.org/images/entities/char_0033_0304.gif) m, represents the most ordered phase of the Co2-based Heusler compounds.17
m, represents the most ordered phase of the Co2-based Heusler compounds.17
Heusler alloys are traditionally considered to have outstanding magnetic properties. As an example, Fig. 2 presents the magnetic hysteresis (M–H) curves of Co2FeAl and Co2Mn0.3Fe0.7Al measured at RT temperature in the field range −1500 to 1500 Oe. It can be found that both of the films show well-defined ferromagnetic features. The magnetization is normalized to the saturation magnetization Ms. It can be found that the magnetization becomes lower with Mn doping composition. This is ascribed to a larger magnetic moment of the Fe element. Unfortunately, magnetic hysteresis curves of the samples at high temperature cannot be measured because of the limitations of the experimental conditions. Meanwhile, it has been reported that the Co2MnxFe1−xAl films have more complex magnetic phases as x increases to 0.7 and 1.14 Therefore, one can expect that it is difficult to extract Tc, even by taking high-temperature M–H measurements. Fortunately, the Raman spectrum appears to be an effective method of judgment.
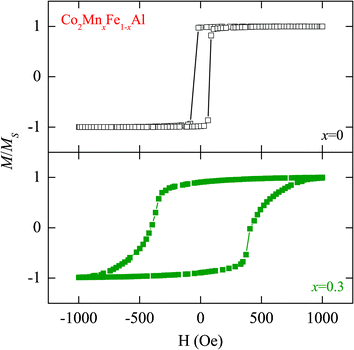 | ||
| Fig. 2 Room temperature magnetic hysteresis loops (M–H curves) of the Co2MnxFe1−xAl films with x = 0 and x = 0.3, respectively. Note that the magnetization is normalized to the saturation magnetization Ms. | ||
Raman scattering is sensitive to the coordination of local symmetry resulting from atomic substitution and distortion of polyhedra.18 So it can reveal important information regarding temperature-induced phase transformation. Raman spectra of the Co2MnxFe1−xAl films with x = 1, 0.7, 0.3, and 0 at the low temperature of 87 K are shown in Fig. 3. It should be mentioned that the weak scattering intensity could be due partially to the low laser power and experimental configuration, which can offer different signals of the phonon modes.19 The 2 nm aluminium layer also has some influence on the experimental observations. Three distinct Raman-active modes of the films, which are located at about 320, 569 and 947 cm−1, can be found in the wavenumber range 200 to 1150 cm−1. For the Heusler compounds, the optical modes are split into three well-separated triply degenerate modes: Γ = F2g + 2F1u. Of all the modes, F2g is Raman-active while the 2F1u modes are IR-active.11 There have been several reports of the appearance of IR-active modes in Raman spectra.9,20,21 It mainly stems from the local breaking of symmetry and the existence of an inversion center. The idea has been introduced of Co atoms in Co2MnxFe1−xAl having the Oh symmetry, which is very unstable. Moreover, Heusler compounds crystallized in the L21 structure also exhibit a center of inversion. Therefore, it can be deduced that the two F1u modes can also be Raman-active in the Co2MnxFe1−xAl films. In conclusion, we attribute these Raman modes to the dominating vibrations of a particular kind of atom.
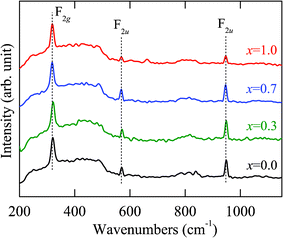 | ||
| Fig. 3 Raman spectroscopy of the Co2MnxFe1−xAl films with x = 0, 0.3, 0.7, and 1 recorded at the temperature of 87 K. The dashed lines show three distinct lattice vibration modes, whose center frequencies present the independence of the Mn composition. | ||
It is inferred that the vibrational mode at about 320 cm−1 corresponds to the F2g phonon. The phonon band can be assigned to the vibrations of the Co atoms in the first sublattice. With regard to the Raman modes located at 569 cm−1 and 947 cm−1, they can be attributed to the 2F1u phonon modes. These modes involve the vibrations of all atoms together, both the vibrations of the Co atoms in the second sublattice and the impact of the Td symmetry.11 It can be seen in Fig. 3 that all the Raman scattering lines have a small full width at half maximum (FWHM). Especially for the phonon modes located at 569 and 947 cm−1, the values of FWHM are within 10 cm−1. It shows that the frequency, band lineshape and relative intensity of the F2g mode at about 320 cm−1 are kept constant in the experimental temperature range. This is attributed to the fact that the mode is caused by the vibrations from the Co atoms. As a result, it is independent of the Mn composition. As the Mn composition increases, the frequencies of the 2F1u phonon modes remain nearly constant. On the other hand, the intensity shows first an increasing trend and then a slight decline with Mn doping. This could be due to the fact that the atomic mass of Mn is different from that of Fe. When the Mn atoms are introduced, the strength of the lattice vibrations can be affected and leads to differing intensities of the phonon modes. On the other hand, Raman scattering results indicate that the Co2MnxFe1−xAl films are of the L21 structure, because the B2 and A2 types are not Raman-active due to the space groups Im![[3 with combining macron]](https://www.rsc.org/images/entities/char_0033_0304.gif) m and Pm
m and Pm![[3 with combining macron]](https://www.rsc.org/images/entities/char_0033_0304.gif) m, respectively. This agrees well with the previous XRD and TEM results.
m, respectively. This agrees well with the previous XRD and TEM results.
In order to further understand the effect of Mn composition on the phase transition behavior in the Co2MnxFe1−xAl films, the temperature dependence of the Raman spectra is presented in Fig. 4 and 5. Although there is no remarkable shift of these phonon modes with increasing temperature, the diverse phonon evolutions of the Co2MnxFe1−xAl films with different Mn compositions can be distinguished. Nevertheless, the frequency and intensity of the Raman mode at 320 cm−1 is qualitatively maintained in the temperature range and no drastic change occurs, which may imply that the vibration of the Co atoms is not sensitive to temperature. The scattering peak of the films detected at 569 cm−1 has an obvious increase in intensity until the temperature reaches 300 K and then it begins to decrease gradually and disappears as the temperature approaches 873 K. The frequency of this mode also goes through a complex change. The variation of the frequency and intensity of the Raman mode at 947 cm−1 is also similar. This may be because these two phonon modes are associated with both Co atoms and the tetrahedral Td symmetry. Comparatively, we study the variation in intensity of the mode at 569 cm−1 and that of the frequency of 947 cm−1, which are more complex and representative. For all the Co2MnxFe1−xAl films, the peak intensity of the F1u phonon mode at 569 cm−1 decreases as the temperature increases above room temperature. However, an abrupt change occurs beyond the phase transition temperature: the intensity of this mode suddenly has a sharp increase with increasing temperature as presented in Fig. 6(a)–(d). The frequency of the Raman mode at 947 cm−1 also goes through an abrupt increase with increasing temperature, which is shown in Fig. 6(e)–(h). These phenomena are ascribed to the phase/structural transition in the films. The frequency and intensity increase remarkably and reach a maximum value near but slightly below Tc. Therefore, the phase transition for the Co2MnxFe1−xAl films: 828 K for x = 0, 823 K for x = 0.3, 818 K for x = 0.7, and 788 K for x = 1, is represented in Fig. 6(i). It can be confirmed that Tc decreases with increasing Mn composition, which is very consistent with the theoretical results reported.8
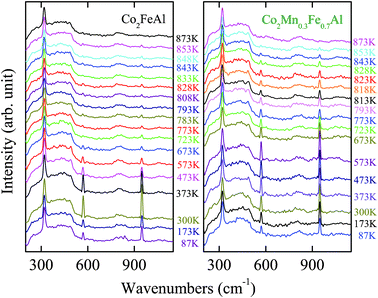 | ||
| Fig. 4 Raman scattering of the Co2MnxFe1−xAl films with x = 0 and x = 0.3 at different temperatures. Note that the experimental temperatures selected are different for the films due to the Tc discrepancy. | ||
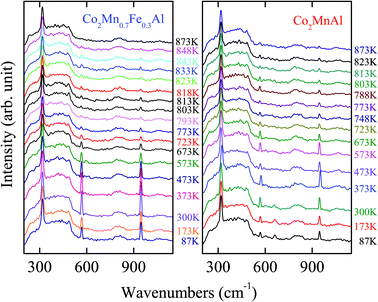 | ||
| Fig. 5 Raman scattering of the Co2MnxFe1−xAl films with x = 0.7 and x = 1 in the temperature range 87–873 K. Note that the experimental setting point is different for the two compounds. | ||
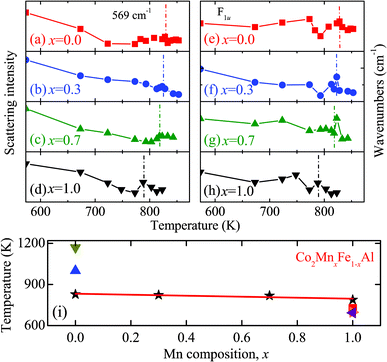 | ||
| Fig. 6 (a)–(d) The intensity variation of the phonon mode located at 569 cm−1 as a function of the temperature for the Co2MnxFe1−xAl films with various Mn compositions. (e)–(h) The frequency variation of the phonon mode located at 947 cm−1 as a function of the temperature for the Co2MnxFe1−xAl films. (i) The Tc evolution of the Co2MnxFe1−xAl films with different Mn compositions (★). For comparison, the Tc values are taken from ref. 23 (▲) and ref. 6 (▼) for Co2FeAl, and ref. 5 (■), ref. 7 (▶) and ref. 22 (◀) for Co2MnAl. | ||
The variation trend can be expressed by the formula: Tc(x) = 832 − 36.2x (0 < x < 1). It also agrees well with the result of our magnetization measurement, since Tc has a close relationship with the magnetic ordering and a higher moment will contribute to a higher Tc. Note that some other data have been presented for comparison.5–7,22,23 The Tc values of Co2MnAl are 726 K,6 697 K,7 and 693 K,22 while the values of Co2FeAl are 1170 K23 and 1000 K.5 It can be found that the reported values are not in complete agreement with the experimental data in the present work. This may be attributed to different growth methods, which can lead to different surface conditions and quality of the samples. Besides, the difference can be due to the different degrees of atomic long-range ordering of the L21 structured samples. Different measuring methods and conditions can also induce the discrepancy, such as the heating rate. Note that most of results are taken from theoretical calculations for comparison, because the experimental data are scarcely reported to date. Therefore, one can imagine that the present difference could be acceptable and reasonable. Nevertheless, we can conclude that the present Tc values taken from Raman scattering measurements give a rather good estimation for the Co2MnxFe1−xAl films.
Note that the lattice parameters of Co2FeAl and Co2MnAl are a = 5.68 Å24 and 5.73 Å,25 respectively. Therefore, the lattice constant of Co2MnxFe1−xAl with a higher Mn composition is larger. Exchange energy parameter J is frequently used to calculate different finite-temperature properties, especially for Tc. The relation can be explained by the following equation:  . Here, kB is the Boltzmann constant and J0i is the exchange energy between atoms.7 In the case of more than one magnetic atom per unit cell one has to diagonalize the J0 matrix of the different sublattice interactions. The Tc can be calculated from the largest eigenvalue Jmax. Obviously, the Tc is proportional to the exchange energies, which have a close relationship with the lattice parameter. On the other hand, it has been reported that the Tc value determined by the first-principles calculation decreased from 1330 K to 1190 K with decreasing lattice parameter from 0.95 to 1.05aexp in Co2FeGa.8 And it was also mentioned that there is also the phenomenon involving Co2MnAl. It was assigned to a pressure induced Tc enhancement effect because the lattice distortion can be directly related to the pressure factor. It can be inferred that the exchange interaction for Co2MnxFe1−xAl is dominated by the exchange coupling of the Fe–Co/Mn–Co pairs.26 The variation in interatomic distance for the Fe–Fe/Mn–Mn or Co–Co pairs contributes to the decrease of the Co sublattice's effective exchange coupling constant, while this value of the Fe sublattice increases. As a result, the interplay between the effective exchange coupling constants of the Co and Fe/Mn sublattices results in the pressure induced Tc enhancement of the Co2MnxFe1−xAl films. So we can conclude that the decrease in Tc is due to the fact that the lattice parameter of the Co2MnxFe1−xAl films becomes larger with increasing Mn composition, which is analogous to the results induced by the external pressure.
4 Conclusions
In conclusion, the lattice vibrations of the Co2MnxFe1−xAl films have been studied by temperature-dependent Raman spectroscopy. Three Raman active modes located at about 320, 569 and 947 cm−1 can be assigned to the F2g and 2F1u modes, respectively. It is found that the latter two modes are sensitive to Mn composition. With the aid of analysis of the lattice vibration of the Raman at 569 and 947 cm−1 induced by the structure modification, the Tc point of the Co2MnxFe1−xAl films can be well defined. It shows a linear decrease from 828 to 788 K with the Mn composition, which can be ascribed to the pressure induced Tc enhancement effect.Acknowledgements
One of the authors (Z. N. Zhan) is grateful to He He, Qing Ren and Prof. Xiaodong Tang for technical support. This work was financially supported by the Natural Science Foundation of China (Grant Nos. 60906046 and 11074076), the Major State Basic Research Development Program of China (Grant No. 2011CB922200), the Projects of Science and Technology Commission of Shanghai Municipality (Grant Nos. 11520701300, 10DJ1400201 and 10SG28), and the Program for Professor of Special Appointment (Eastern Scholar) at Shanghai Institutions of Higher Learning.References
- S. Wurmehl, J. Morais, M. d. C. M. Alves, S. R. Teixeira, G. H. Fecher and C. Felser, J. Alloys Compd., 2006, 159, 423 Search PubMed.
- J. J. Qiu, V. Ko, P. Luo, W. K. Yeo, L. H. An, B. Y. Zong and G. C. Han, J. Appl. Phys., 2009, 105, 07C932 CrossRef.
- A. Hütten, J. Schmalhorst, A. Thomas, S. Kämmerer, M. Sacher, D. Ebke, N.-N. Liu, X. Kou and G. Reiss, J. Alloys Compd., 2006, 148, 423 Search PubMed.
- T. Ambrose, J. J. Krebs and G. A. Prinz, Appl. Phys. Lett., 2000, 76, 3280 CrossRef CAS.
- S. Trudel, O. Gaier, J. Hamrle and B. Hillebrands, J. Phys. D: Appl. Phys., 2010, 43, 193001 CrossRef.
- R. Y. Umetsu, K. Kobayashi, A. Fujita, R. Kainuma and K. Ishida, J. Appl. Phys., 2008, 103, 07D718 CrossRef.
- J. Thoene, S. Chadov, G. Fecher, C. Felser and J. Kübler, J. Phys. D: Appl. Phys., 2009, 42, 084013 CrossRef.
- X. B. Liu and Z. Altounian, J. Appl. Phys., 2011, 109, 07B108 CrossRef.
- W. J. Zhang, W. W. Li, X. G. Chen, Z. G. Hu, W. Liu, G. S.Wang, X. L. Dong and J. H. Chu, Appl. Phys. Lett., 2011, 99, 041902 CrossRef.
- M. J. Han, K. Jiang, J. Z. Zhang, Y.W. Li, Y.W. Li, Z. G. Hu and J. H. Chu, Appl. Phys. Lett., 2011, 99, 131104 CrossRef.
- A. T. Zayak, P. Entel, K. M. Rabe, W. A. Adeagbo and M. Acet, Phys. Rev. B: Condens. Matter Mater. Phys., 2005, 72, 054113 CrossRef.
- L. Mañosa and A. Planes, Phys. Rev. B: Condens. Matter, 2001, 64, 024305 CrossRef.
- Y. Takamura, R. Nakane and S. Sugahara, J. Appl. Phys., 2009, 105, 07B109 CrossRef.
- K. K. Meng, S. L. Wang, P. F. Xu, L. Chen, W. S. Yan and J. H. Zhao, Appl. Phys. Lett., 2010, 97, 232506 CrossRef.
- M. Kogachi, T. Fujiwara and S. Kikuchi, J. Alloys Compd., 2009, 723, 475 Search PubMed.
- H. Ishikawa, R. Y. Umetsu, K. Kobayashi, A. Fujita, R. Kainuma and K. Ishida, Acta Mater., 2008, 56, 4789 CrossRef CAS.
- I. Galanakis and P. H. Dederichs, Phys. Rev. B: Condens. Matter, 2002, 66, 174429 CrossRef.
- Z. G. Hu, W. W. Li, J. D. Wu, J. Sun, Q. W. Shu, X. X. Zhong, Z. Q. Zhu and J. H. Chu, Appl. Phys. Lett., 2008, 93, 181910 CrossRef.
- W. W. Li, J. J. Zhu, J. D. Wu, J. Sun, M. Zhu, Z. G. Hu and J. H. Chu, ACS Appl. Mater. Interfaces, 2010, 8, 2325 Search PubMed.
- O. Okhay, A. Wu, P. M. Vilarinho, I. M. Reaney, A. R. L. Ramos, E. Aleves, J. Petzelt and J. Pokorny, Acta Mater., 2007, 55, 4947 CrossRef CAS.
- A. Tkach, T. M. Correia, A. Almeida, J. A. Moreira, M. R. Chaves, O. Okhay, P. M. Vilarinho, I. Gregora and J. Petzelt, Acta Mater., 2007, 59, 5388 CrossRef.
- P. J. Webster, J. Phys. Chem. Solids, 1971, 32, 1221 CrossRef CAS.
- K. Kobayashi, R. Y. Umetsu, R. Kainuma, K. Ishida, T. Oyamada, A. Fujita and K. Fukamichi, Appl. Phys. Lett., 2004, 85, 4684 CrossRef CAS.
- B. Balke, G. H. Fecher and C. Felser, Appl. Phys. Lett., 2007, 90, 172501 CrossRef.
- J. Kübler, A. R.Williams and C. B. Sommers, Phys. Rev. B, 1983, 28, 1745 CrossRef.
- H. Kubota, J. Nakata, M. Oogane, Y. Ando, H. Kato, A. Sakuma and T. Miyazaki, J. Appl. Phys., 2005, 97, 10C913 CrossRef.
| This journal is © The Royal Society of Chemistry 2012 |
