DOI:
10.1039/C2RA21434B
(Paper)
RSC Adv., 2012,
2, 12999-13006
One-step synthesis of SbPO4 hollow spheres by a self-sacrificed template method†
Received
13th July 2012
, Accepted 18th October 2012
First published on 22nd October 2012
Abstract
High purity SbPO4 hollow spheres assembled by nanoparticles were successfully fabricated by a template-free solvothermal reaction in a mixed solvent of water, ethanol, and oleic acid. The synthetic conditions for the hollow sphere SbPO4 were monitored by a series of time-resolved experiments and further optimized by adjusting the solvent ratio and pH value in the reaction system. Based on XRD and SEM characterization, it is interesting to reveal a phase conversion process from Sb4O5Cl2 to SbPO4 as well as morphology evolution. The phase and morphology transition mechanism was discussed from the chemical equilibrium perspective. Size distributions of Sb4O5Cl2 and SbPO4 samples were in a narrow range of 7 to 13 μm. The Sb4O5Cl2 spheres were constructed in situ by nanosheets, which act as self-sacrificed templates for the SbPO4 hollow spheres. Room-temperature alternative current impedance measurements indicate that the permittivity for the SbPO4 hollow spheres is as high as 130 at 40 Hz, which obviously originates from the interfacial effects with numerous carriers blocked. The synthetic methodology reported in this work can be applied to a broad class of assembled nanostructures for optimization of dielectric performance.
Introduction
In recent years, systematic control over the desired structures and morphologies in multi-component inorganic nanostructures has attracted more and more interest, since they are necessary for tailored properties with potential applications in electronics, magnetic devices, photonics, electrochemistry, and catalysis.1–6 In this regard, numerous synthetic approaches based on solution chemistry have been developed to synthesize nanostructures with various morphologies, like nanowires, nanorods, hollow spheres, core/shell or superstructures.7–9 Among different morphologies of these nanostructures, hollow structures of nanometer to micrometer dimensions have attracted special attention. One of the common approaches to achieve the hollow sphere structures is the introduction of hard templates (e.g. polymer latex, carbon, and anodic aluminium oxide templates) or soft templates (e.g. supermolecular, ionic liquids, and surfactant).10,11 However, the addition of these templates to the reaction systems may complicate the synthetic procedures and further introduce uncertain impurities that can be disadvantageous to the properties of the final products. For instance, Zhang et al.,12 recently reported the controlled synthesis of Y2O3:Eu hollow microspheres via a urea-based homogeneous precipitation technique in the presence of colloidal carbon spheres as hard templates. A subsequent high temperature heat treatment is then needed, which is often destructive to the monodispersity. As a consequence, it is of great value to develop simple template-free methods to fabricate the hollow sphere structures.
In fact, some physical or chemical phenomena reported previously in the literature have inspired us to explore new methods of preparing hollow nanostructures without the introduction of any templates. For example, Qian et al.13 reported the successful synthesis of highly symmetric 18-facet polyhedron nanocrystals of Cu7S4 with a hollow nanocage through the chemical transformation of truncated cubic Cu2O nanocrystals. Xu and co-workers14 prepared copper sulfide mesocages with single-crystalline shells by a shape-controlled Cu2O crystal template. The key to the above-mentioned synthesis is to discover a suitable reactive template, which should meet the following conditions: (i) tendency to the formation of the desired morphologies; (ii) possibility of transformation into the desired phases in reaction solution due to the metastability of the templates. Herein, we report on a new fabrication method of SbPO4 hollow structures via a chemical transformation reaction from the reactive Sb4O5Cl2 templates under mild solvothermal conditions.
As a phosphate with a layered structure, SbPO4 is a functional compound with many interesting properties and applications.15–18 Up to now, there has been no report on the synthesis of SbPO4 based on solution chemistry. Here, we will show a first example of the successful preparation of SbPO4 hollow structures using the solvothermal method with a mixed solvent of water/ethanol/oleic acid. The phase and morphology evolution processes from the intermediate Sb4O5Cl2 template to the final SbPO4 product were investigated in detail, and a possible mechanism for the formation of SbPO4 hollow microspheres was proposed. This synthetic approach to hollow structures may be applied to other multi-oxides. Eventually, we performed a systematic investigation of the structure, spectral characteristics, and dielectric properties of this unique structure.
Experimental
2.1. Sample synthesis
All reagents used in this work were of analytical purity grade. They were purchased from the Shanghai Chemical Shiji Company, P. R. China, and were used directly without further treatment. Ethanol instead of water was used as a solvent to prevent SbCl3 hydrolysis. In a typical experimental procedure, 25 ml 0.2 M SbCl3 ethanol solution and 25 ml 0.2 M NH4H2PO4 solution were slowly added into 25 ml oleic acid under vigorous stirring. The resulting white suspension was stirred for 30 min at room temperature and then transferred into a Teflon stainless steel autoclave. The autoclave was sealed and maintained at 160 °C for different periods of time, and was then allowed to cool to room temperature. The obtained white SbPO4 powder was washed several times with ethanol and distilled water and finally dried at 80 °C in air.
2.2. Sample characterization.
The crystallinity and purity of the as-prepared sample were examined by X-ray powder diffraction (XRD), which was performed on a Rigaku 2000 apparatus with Cu-Kα irradiation. The morphologies of the samples were observed by scanning electron microscopy (SEM) (JEOL JSM–6700) and transmission electron microscopy (TEM) (JEOL, Model JEM-2010). The chemical compositions of the Sb and P elements in the samples were analyzed by inductively coupled plasma mass spectroscopy (ICP-MS). Infrared spectra of the samples were measured on a Perkin-Elmer IR spectrophotometer using a KBr pellet technique. Raman spectra of the samples were obtained on a Renishaw Raman microscope InVia Plus system with an excitation line of 785 nm. UV-vis diffuse reflectance spectra were obtained using a Varian Cary 500 UV-Vis-NIR spectrometer and were converted from reflection to absorption by the Kubelka–Munk method. Complex impedance measurements were performed in air on compressed pellets of 1.6 mm in thickness and 8.0 mm in diameter. Conducting silver paste was applied on both faces of the pellets to serve as the electrodes. The pellet was dried at 373 K for 30 min prior to the impedance measurements. Such a pretreatment allows electrode curing but not at the expense of surface hydration. The alternating current (AC) impedance measurements were carried out in the frequency range 40 to 30 MHz and at an oscillation voltage of 0.5 V using a precision LCR meter (Agilent 4294A) with an assistant clamp of Agilent 16451B.
Results and discussion
3.1. Phase controlled preparation
High purity SbPO4 hollow spheres were fabricated by a controlled solvothermal precipitation reaction. Table 1 summarizes the effects of the overall synthetic parameter on the final phase composition (the corresponding XRD data for these conditions were given in Fig. S1 and S2†). As demonstrated in Table 1, both solvent and pH values imposed a large impact on the phase formation. Sb2O3 was generated in a basic solution, while Sb4O5Cl2 appeared in an acidic solution. Apparently the mixture of antimony oxide and chlorine antimony trioxide always emerges in the preparation of SbPO4, which makes it still a challenge to synthesize pure-phase SbPO4via a wet-chemical approach.
Table 1 Summary of the reaction conditions and final products
From Table 1, one can see that pure SbPO4 was successfully synthesized via a mixed solvent of H2O/ethanol/oleic acid. Fig. 1 shows a typical XRD pattern of the sample, which could be readily indexed to monoclinic phase antimony phosphate (space group: P1 21/m 1, a = 5.0868, b = 6.7547, c = 4.7247 Å; β = 94.66°; JCPDS no. 35-0829), and the crystal structure image of the SbPO4 was given in the insert of Fig. 1. Obviously, the diffraction peaks for impurities like Sb4O5Cl2 or Sb2O3 were not observed, which suggests that our fabrication route ensured the crystallinity and purity of SbPO4.
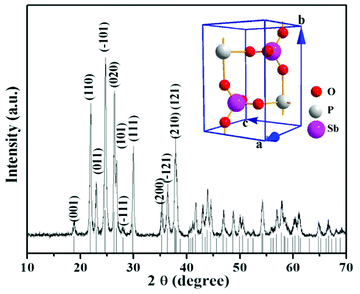 |
| | Fig. 1 XRD pattern of the as-prepared SbPO4 hollow sphere. Inset shows the crystal structure image of the SbPO4. | |
The morphology and structure of the pure-phase SbPO4 sample were further examined by SEM, TEM, HRTEM, and EDS. Fig. 2a,b show the typical SEM images, and the inset of b represents the enlarged image of the surface, which indicates the formation of hollow microspheres with a diameter of 6–10 microns. The surface of each microsphere was assembled by nanoparticles. Fig. 2c is a TEM image, and the insert shows a typical HRTEM image of a single particle. One can see a distinct finger of (110) reflection with a space distance of d = 0.385 nm. The corresponding diffraction ring of the selected area electron diffraction (SAED) pattern in Fig. 2d identifies the polycrystalline nature of SbPO4 hollow spheres. EDX analysis was also employed to determine the chemical compositions qualitatively. Only Sb, P, and O peaks were observed in the SEM-EDS patterns of the SbPO4 hollow spheres, as shown in Fig. 2e. Further ICP analysis demonstrates that the molar ratio of Sb to P is almost unity, demonstrating a stoichiometry of SbPO4, consistent with our XRD data analysis.
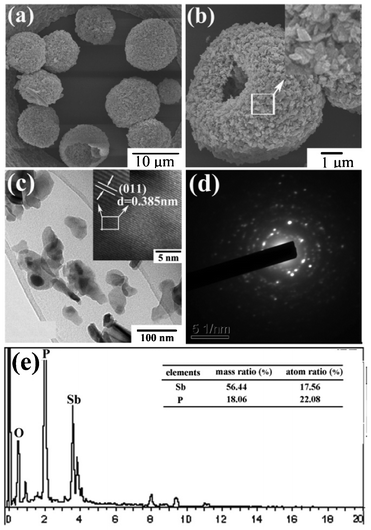 |
| | Fig. 2 (a) Low-magnification SEM image; (b) high-magnification SEM image (magnified, inset); (c) TEM, (HRTEM, inset); (d) SAED; and (e) EDS patterns of SbPO4 hollow sphere. | |
3.2. Formation mechanism of SbPO4 hollow spheres
To better understand the formation of SbPO4 hollow microspheres in solution, a series of time-controlled experiments were carried out. First of all, the phase evolution process was investigated by XRD characterization (shown in Fig. S3†). According to the XRD results, it is found that when the reaction time was as short as 1 h, the product was amorphous. As the reaction time increased to 2 h, the product was pure Sb4O5Cl2 (JCPDS no. 30-0091). With the increase in reaction time, the characteristic peak (2θ = 14.29°) for the Sb4O5Cl2 phase gradually disappeared while the peaks from SbPO4 intensified, which indicated that the starting product Sb4O5Cl2 gradually transformed into SbPO4. Pure SbPO4 was generated after 10 h of reaction. Afterwards, morphology changes during phase formation were studied by SEM. The size distributions for these spheres were determined through a statistical evaluation of 50–80 grains in the SEM images.19 These hollow microspheres had a narrow size distribution from 6.7 to 13.2 μm with an average diameter of 11.3 μm. The morphology evolution during phase transformation from Sb4O5Cl2 to SbPO4 was illustrated in Fig. 3 and Fig. 4. At the initial stage of reaction (1 h), microspheres had already been generated, despite the fact that no crystalline materials were formed at this time. As the reaction proceeds, both phase and morphology changed. As the reaction proceeds to 2 h, the product was pure Sb4O5Cl2 microspheres assembled by nanosheets. Layered structured Sb4O5Cl2 is prone to grow into nanosheets, as reported in ref. 20. In a mixed solvent, these nanosheets were easy to assemble to generate microspheres. It is worth noting that, in the conversion process from Sb4O5Cl2 to SbPO4, the macroscopic shape of Sb4O5Cl2 was retained despite its surface feature alternation. These changes were vital for the formation of a hollow sphere structure, and the detailed mechanism is given in the following.
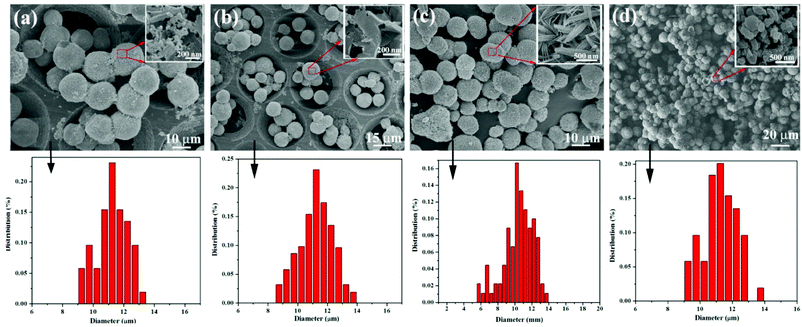 |
| | Fig. 3 Morphological evolutions and particle size distribution during phase transformation from Sb4O5Cl2 to SbPO4 when the reaction period is set at: (a) 1 h; (b) 2 h; (c) 4 h; and (d) 6 h. Insets show the enlarged surfaces of the spheres. | |
 |
| | Fig. 4 SEM images for SbPO4 hollow spheres prepared with different reaction times: (a) 8 h; (b) 10 h; (c) 24 h; (d) 48 h, respectively. | |
Like Bi3+ ions in solution, Sb3+ ions also tend to undergo hydrolysis to generate various products, depending on the composition of the solution.21,22 From these results, we think that the following reactions take place in the water/ethanol/oleic acid mixed solution:
| |  | (1) |
| | | 4NH4H2PO4 + 4HCl → 4NH4Cl + 4H3PO4 | (2) |
| | | Sb4O5Cl2 + 4H3PO4 → 5H2O + 2HCl + 4SbPO4 | (3) |
total reaction:
| | | SbCl3 + NH4H2PO4 → NH4Cl + 2HCl + SbPO4 | (4) |
Once dissolved in solution, Sb3+ undergoes a hydrolysis reaction, as shown in eqn (1), which was much faster than the other reactions.
On the basis of the above experimental evidence, we proposed a feasible mechanism for the formation of SbPO4 hollow spheres, as described in Scheme 1. The initial step is hydrolysis to form Sb4O5Cl2 nucleation, and this process is fast and completed within 2 h, as the XRD result indicates in Fig. S3.† In the following growth process, two-dimensional nanosheets are generated. Then the Sb4O5Cl2 nanosheets at the miniemulsion interface grow and assemble to construct the shell of the microspheres. At this reaction stage, the Sb4O5Cl2 microsphere acts as not only the reactant with H3PO4 but also the template in the following crystal transition reaction. Under solvothermal conditions, the Sb4O5Cl2 microsphere gradually transformed into SbPO4 nanoparticles on the surface of the Sb4O5Cl2 microsphere for distinction of their solubility and thermodynamic properties. In the crystal growth process of SbPO4, the Sb4O5Cl2 microspheres acted as the self-sacrificed template, which still retains its spherical morphology. In this process, as the Sb4O5Cl2 templates are consumed, the small SbPO4 nanoparticles gradually form on the Sb4O5Cl2/solution interface. Then, the newly produced SbPO4 nanoparticles become larger in size and the crystallinity of the products is indeed gradually increased, due to the Ostwald ripening growth process. Simultaneously, the panes perfectly align from the centre to the surface and knit to form the hierarchical architectures. The interior of the sphere becomes hollow due to the increase in packing density in the conversion from Sb4O5Cl2 nanosheet to SbPO4 particle, and thus the SbPO4 hollow sphere was successfully prepared by this self-sacrificed template method.
 |
| | Scheme 1 Schematic description of the proposed plausible formation mechanism of the SbPO4 hollow spheres. | |
The formation of SbPO4 hollow spheres is strongly dependent on experimental factors such as solvent, solvothermal time, and pH value. The solvent also plays an important role in the phase-controlled synthesis of SbPO4. As the results show in Table 1, a mixture of water, ethanol, and oleic acid is prerequisite for the preparation of SbPO4 hollow spheres with pure phase. Additionally, in the present work when the reaction time was prolonged to 24 h, hollow spheres of SbPO4 with some broken and shriveled ones were obtained, suggesting the increase of strength and shell-wall thickness of the hollow structures. Upon further increasing the reaction time to 48 h, only the SbPO4 nanoparticle instead of the hollow sphere is observed. With regards to the effect of the pH value, it is found that when the pH was fixed at 1 we can obtain pure phase SbPO4. Increasing the pH value would increase the concentration of OH− ions and further strengthen the interactions between Sb3+ and OH− ions. Therefore, with the other synthetic parameters constant, a mixture of Sb2O3, SbO2, and Sb2O4 instead of SbPO4 was generated when the pH value was regulated to 5. Upon further changing the pH to 9, pure phase Sb2O3 instead of SbPO4 is observed. The strong pH-dependent relationship with the products is the result of the sensitive influence of the pH on the solute concentration (Sb3+ and HnPO4(3−n)−). A similar pH-dependent phenomenon was also reported in the BiPO4 and BiOCl system.23
To verify the role of the in situ generated Sb4O5Cl2 template, another experiment with Sb2O3 instead of SbCl3 gives the SbPO4 with random particles (see Fig. S4, ESI†), with the other synthetic parameters constant. This indirectly confirms the template role of Sb4O5Cl2. Therefore, SbPO4 hollow spheres were fabricated by a self-sacrificed template method.
3.3. Optical characterization
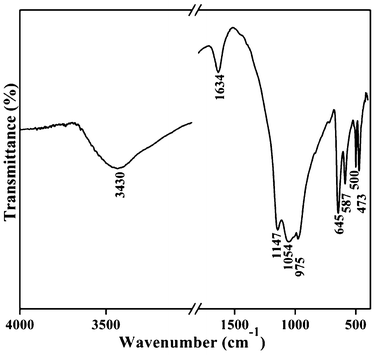
The purity of the sample was further demonstrated by infrared and Raman spectra. It is known that SbPO4 crystals are monoclinic (space group: P1 21/m 1). According to group theory, 33 optical modes may exist, which can be expressed by the following irreducible representation: Γ(k=0) = 9Au + 12Bu + 8Ag + 4Bg; where 9Au and 12Bu models are infrared active and 8Ag and 4Bg are Raman active. The FT-IR spectrum for the as-prepared SbPO4 hollow sphere is displayed in Fig. 5. The FT-IR spectrum is characterized by four non-degenerate internal modes of P–O stretching vibrations. Two of them are observed at 1147 and 1054 cm−1, which correspond to the asymmetric stretching modes. The symmetric stretching mode, νs, is observed at around 975 cm−1, located in the high number region compared to that reported by Nalin et al.24 The asymmetric stretching mode at 1035 cm−1 was not observed in our FT-IR spectrum. The absorption peaks located at 3430 and 1634 cm−1 are ascribed to physical absorbed water on the sample surface. No other bands were detected, which demonstrates a clean surface of the sample.
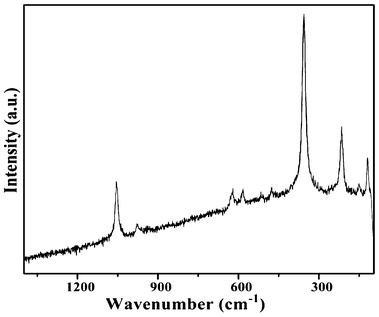
The Raman spectrum of the as-prepared SbPO4 hollow spheres is shown in Fig. 6. All expected peaks appear in the experimental range. The three at the highest energies can be attributed to the asymmetric (1055 and 977 cm−1) and symmetric stretching (937 cm−1) modes of the PO4 units, which match well with ref. 25. Middle range vibrations (623, 583 cm−1) are assigned to the asymmetric bending modes of the PO4 group, while the band at 476 cm−1 is attributed to a symmetric bending mode. Except for the above mentioned-absorptions, no obvious peaks were seen, which further demonstrated the high purity of the samples.
SbPO4 is an important semiconductor, while its band gap energy is still unavailable. Therefore, we investigated the band gap energy of SbPO4 hollow spheres by UV-vis diffuse reflectance spectroscopy (DRS). Fig. 7 shows the plots of F(R) vs. wavelength of the as-prepared SbPO4 hollow spheres. It is found that, similarly to that for the powder reference, a strong absorption was observed at about 285 nm for the as-prepared SbPO4 hollow spheres, which indicates an intrinsic absorption due to the interband transition. There are no photo absorption properties in the visible light region. The band gap energies are defined by extrapolation of the rising part of the plots to the x-axis.26 The band gap of SbPO4 hollow spheres is 4.35 eV, very similar to that of BiPO4.27
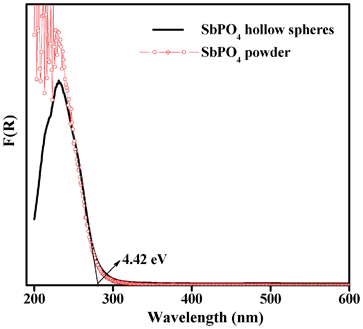 |
| | Fig. 7 UV-vis spectrum for the as-prepared SbPO4 hollow spheres. The relevant data for the SbPO4 powders were also given for comparison. | |
3.4. Dielectric performance of SbPO4 hollow spheres
The electric properties of the SbPO4 hollow spheres were investigated by complex AC impedance measurements, in the frequency range 20 Hz to 1 MHz on a compressed pellet of 1.6 mm in thickness and 8.0 mm in diameter at room temperature. Silver paste was coated onto opposite sides of the pellets and dried at room temperature to form the electrodes. The impedance spectrum measured at room temperature is shown in Fig. 8a, which can be fitted by equivalent circuit (RbQ1)(RgQ2), where Rb and Rg represent the bulk and grain boundary resistances, and Qi is the phase element. The fitting result, as given in the inset of Fig. 8a, showed that the bulk resistance Rb is 1.33 × 10⁶ Ω with a corresponding conductivity of σ = 2.393 × 10⁻⁷ S cm−1. The dielectric properties of SbPO4 hollow spheres are determined in terms of the permittivity formalism, ε∗=1/iωCoZ*(ω),28 where ω = 2πf is the angular frequency and Co is the vacuum capacitance of the sample holder. Fig. 8b shows the frequency dependence of the real part, ε′, of the as-prepared SbPO4 hollow sphere. It is seen that the permittivity ε′ at low frequency is as high as 130 at 40 Hz, and remains above 100 as the frequency is increased to 400 Hz. This permittivity is much higher than that of TiO2 in the literature, 55 for anatase and 100 for rutile type.29 With increasing frequency, ε′ gradually decreased, which is likely due to the high periodic reversal of the field at the interfaces. Consequently, the contribution of charge carriers to the dielectric constant was reduced. The permittivity ε′ tended to be a constant at 11 in the high frequency region (>6 × 10⁵). Comparatively, the variation of the imaginary part of the relative dielectric constant, ε′′, as a function of the frequency is given in Fig. 8c. It is seen that one maximal hump was detected at about 1200 Hz.
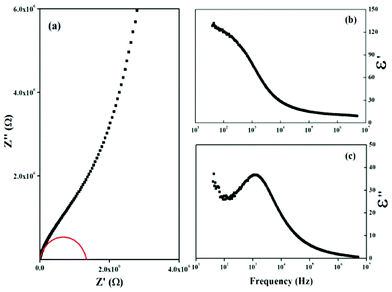 |
| | Fig. 8 (a) Impedance plot, and frequency dependences of (b) ε′, and (c) ε′′ for the SbPO4 hollow sphere. The red arc denotes the fitting result. | |
It is well known that relaxation time is an important physical parameter, which characterizes the dielectric properties. Herein we obtained the relaxation time from the loss tangent. As illustrated in Fig. 9, there is only one loss peak at about 5700 Hz, which should not be a result of electronic relaxation, but a Debye-type relaxation of freely rotating defect dipoles that is of short-range displacement and is thermally activated, in view of the low dielectric loss (tan δ) and relatively low frequency for peak appearance. Therefore, the dielectric relaxation can be expressed by a Debye relaxation relation: 30
| |  | (1) |
where
εs is the static field dielectric constant,
ε∞ is the high frequency dielectric constant of the material,
ω is the applied angular frequency, and
τ is the relaxation time. Then, we can obtain the following formula:
| |  | (2) |
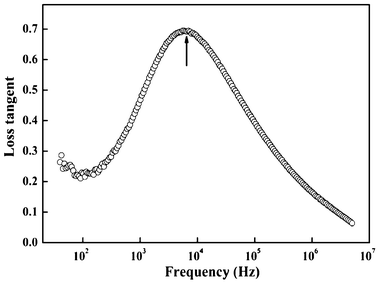 |
| | Fig. 9 Frequency dependence of loss tangent (tan δ) for the hollow-sphere SbPO4. The peak frequency denoted by the arrow is about 5680 Hz. | |
Here, tan δm is the maximum loss at the peak position. According to eqn (2), it is obvious that tan δ has a maximum value at ωτ1 = 1.0. Thus, by estimating the frequency peak positions in Fig. 8, the dielectric relaxation time was calculated to be 28 μs for the as-prepared hollow spherical SbPO4.
Conductance and dielectric properties are related to the carrier transport and polarization states in the bulk and interfaces for polycrystalline samples. By comparing with the literature reports for TiO2,29 we feel that the dielectric permittivity of 130 at 40 Hz for assembled SbPO4 spheres could be a consequence of the interfacial effects with numerous carriers blocked. These carriers are associated with two types of origins: one is the interface–bypass interruption for bulk carriers, and the other is the ion-defect pairs in/between the interfaces/surfaces. Therefore, SbPO4 hollow spheres are expected to act as a potential dielectric material.
Conclusions
In this work, we report a one-pot solvothermal approach for the preparation of nearly monodisperse SbPO4 hollow spheres with high purity using an in situ formed Sb4O5Cl2 template. On the basis of microscopic and structural observations, the intermediate Sb4O5Cl2 product plays a critical role in the phase formation and morphology retention for as-prepared SbPO4 hollow spheres. Importantly, the synthetic strategy reported here could be extended to other material systems with inherited and controlled shape and size. The electric properties investigated by complex AC impedance indicate that the as-prepared SbPO4 hollow sphere had a bulk conductivity of about 2.393 × 10⁻⁷ S cm−1. The findings reported in this work are fundamentally important, which provides a chemical strategy to synthesize other novel materials for dielectric performance.
Acknowledgements
Financially support for this work was provided by NSFC (No. 91022018 and 21025104), National Basic Research Program of China (2011CBA00501, 2013CB933203).
References
- D. S. Bohle and C. J. Spina, J. Am. Chem. Soc., 2009, 131, 4397–4404 CrossRef CAS.
- I. Lee, F. Delbecq, R. Morales, M. A. Albiter and F. Zaera, Nat. Mater., 2009, 8, 132–138 CrossRef CAS.
- H. F. Cheng, B. B. Huang, Z. Y. Wang, X. Y. Qin, X. Y. Zhang and Y. Dai, Chem.–Eur. J., 2011, 17, 8039–8043 CrossRef CAS.
- Z. K. Zheng, B. B. Huang, J. B. Lu, X. Y. Qin, X. Y. Zhang and Y. Dai, Chem.–Eur. J., 2011, 17, 15032–15038 CrossRef CAS.
- J. Jiang, K. Zhao, X. Y. Xiao and L. Z. Zhang, J. Am. Chem. Soc., 2012, 134, 4473–4476 CrossRef CAS.
- H. F. Lin, L. P. Li, M. L. Zhao, X. S. Huang, X. M. Chen, G. S. Li and R. C. Yu, J. Am. Chem. Soc., 2012, 134, 8328–8331 CrossRef CAS.
- Q. Cai and W. Zhou, J. Phys.: Condens. Matter, 2004, 16, 6835–6840 CrossRef CAS.
- R. Yu, L. Yan, P. Zheng, J. Chen and X. R. Xing, J. Phys. Chem. C, 2008, 112, 19896–19900 CAS.
- C. L. Guo, A. D. Lan, F. X. Li, Y. T. Qian and L. F. Hou, CrystEngComm, 2012, 14, 2186–2189 RSC.
- E. Muthusamy, D. Walsh and S. Mann, Adv. Mater., 2002, 14, 969 CAS.
- J. H. Jung, H. Kobayashi, K. J. C. van Bommel, S. Shinkai and T. Shimizu, Chem. Mater., 2002, 14, 1445–1447 CrossRef CAS.
- G. Jia, M. Yang, Y. H. Song, H. P. You and H. J. Zhang, Cryst. Growth Des., 2009, 9, 301–307 CAS.
- H. L. Cao, X. F. Qian, C. Wang, X. D. Ma, J. Yin and Z. K. Zhu, J. Am. Chem. Soc., 2005, 127, 16024–16025 CrossRef CAS.
- S. H. Jiao, L. F. Xu, K. Jiang and D. S. Xu, Adv. Mater., 2006, 18, 1174 CrossRef CAS.
- P. Melnikov, M. A. C. Seeco, W. R. Guimaraes and H. W. L. dos Santos, J. Therm. Anal. Calorim., 2008, 92, 579–582 CrossRef CAS.
- J. S. Pena, J. C. Pascual, A. Caballero, J. Morales and L. Sanchez, J. Solid State Chem., 2004, 177, 2920–2927 CrossRef.
- B. S. Naidu, M. Pandey, V. Sudarsan, J. Ghatak and R. K. Vatsa, J. Nanosci. Nanotechnol., 2011, 11, 3180–3190 CrossRef CAS.
- M. Ahlawat, G. V. Vazquez, M. Nalin, Y. Messaddeq, S. Ribeiro and R. Kashyap, J. Non-Cryst. Solids, 2010, 356, 2360–2362 CrossRef CAS.
- L. S. Yang, G. S. Li, M. L. Zhao, J. Zheng, X. F. Guan and L. P. Li, CrystEngComm, 2012, 14, 3227–3235 RSC.
- M. Zhang, Z. H. Wang, G. C. Xi, D. Ma, R. Zhang and Y. T. Qian, J. Cryst. Growth, 2004, 268, 215–221 CrossRef CAS.
- X. Y. Chen, Z. J. Zhang and S. W. Lee, J. Solid State Chem., 2008, 181, 166–174 CrossRef CAS.
- X.
Y. Chen, H. S. Huh and S. W. Lee, J. Solid State Chem., 2008, 181, 2127–2132 CrossRef CAS.
- J. Geng, W. H. Hou, Y. N. Lv, J. J. Zhu and H. Y. Chen, Inorg. Chem., 2005, 44, 8503–8509 CrossRef CAS.
- M. Nalin, Y. Messaddeq, S. J. L. Ribeiro, M. Poulain, V. Briois, G. Brunklaus, C. Rosenhalm, B. D. Mosel and H. Eckert, J. Mater. Chem., 2004, 14, 3398–3405 RSC.
- W. Brockner and L. P. Hoyer, Spectrochim. Acta, Part A, 2002, 58, 1911–1914 CrossRef.
- G. S. Pang, S. Chen, Y. Koltypin, A. Zaban, S. H. Feng and A. Gedanken, Nano Lett., 2001, 1, 723–726 CrossRef CAS.
- C. S. Pan and Y. F. Zhu, Environ. Sci. Technol., 2010, 44, 5570–5574 CrossRef CAS.
- W. B. Hu, L. P. Li, G. S. Li, C. L. Tang and L. Sun, Cryst. Growth Des., 2009, 9, 3676–3682 CAS.
- G. L. Zhao, S. Utsumi, H. Kozuka and T. Yoko, J. Mater. Sci., 1998, 33, 3655–3659 CrossRef CAS.
- M. M. El-Desoky, S. M. Salem and I. Kashif, J. Mater. Sci.: Mater. Electron., 1999, 10, 279–283 CrossRef CAS.
Footnote |
| † Electronic Supplementary Information (ESI) available: Fig. S1–S3 show the XRD patterns of the samples prepared in solvents of different compositions. Fig. S4 shows the SEM image for the sample prepared using Sb2O3 instead of SbCl3 as a raw material. See DOI: 10.1039/c2ra21434b |
|
| This journal is © The Royal Society of Chemistry 2012 |
Click here to see how this site uses Cookies. View our privacy policy here. ![[thin space (1/6-em)]](https://www.rsc.org/images/entities/char_2009.gif) :
:![[thin space (1/6-em)]](https://www.rsc.org/images/entities/char_2009.gif) 1, v/v)
1, v/v)


