Role of the hydrogen-bond in porphyrin J-aggregates†
Valentina
Villari
*a,
Placido
Mineo
*ab,
Emilio
Scamporrino
b and
Norberto
Micali
a
aCNR-IPCF Istituto per i Processi Chimico-Fisici, Viale F. Stagno d'Alcontres 37, I-98158, Messina, Italy. E-mail: villari@me.cnr.it
bDipartimento di Scienze Chimiche, Università di Catania, Viale Andrea Doria 6, I-95125 Catania, Italy. E-mail: gmineo@unict.it
First published on 25th October 2012
Abstract
J-aggregates of conjugated molecules are known to be the result of π–π stacking and hydrophobic and electrostatic interactions with hydrogen bonding providing stabilization. The present study on porphyrin derivatives, thanks to the absence of chargeable groups, helps to focus the attention on the effect of the hydrogen-bonding interactions. Moreover, the aqueous medium, causing a competitive effect for the formation of H-bonds with porphyrins, strengthens the role of the inter-porphyrin hydrogen bonding contribution in the self-assembly. Herein it is proven, through UV-vis and time-resolved fluorescence measurements, that the presence of peripheral OH groups, able to form hydrogen bonds with the nitrogen atoms of the macrocycle, has an important role in driving towards the formation of J-type aggregates rather than having only a stabilization effect. Indeed, although the porphyrin derivative with peripheral OH-to-OCH2CH3 group substitution gives rise to aggregates with almost comparable size, as indicated by dynamic light scattering, in the resulting structures porphyrins take an H-type arrangement.
1 Introduction
Self-aggregation of molecules with a conjugated electronic structure has attracted a lot of attention in the last few decades, thanks to the peculiar optical properties of the resulting nanostructures.1–8 J-aggregates, in particular, in which molecules are arranged in a slipped way (head-to-tail), make natural antenna systems very efficient thanks to the strong coupling between the transition dipole moments of the constituent monomers and to the resulting exciton delocalization phenomenon.9–13 On the other hand, H-aggregates are characterized by a face-to-face monomer alignment. From a spectroscopic point of view, as predicted by Kasha,14 whereas H-aggregates give rise to a blue-shifted extinction band with respect to the monomer, the formation of J-aggregates causes the appearance of a narrow red-shifted extinction band.Among the conjugated molecules able to form J-aggregates, porphyrins attracted a lot of attention due to their versatility to structural modifications, the possibility of changing the mesoscopic properties of their J-aggregates, by acting on concentration and ionic strength (for the aqueous medium),15–18 and their role in natural photosynthetic systems.19–21
In order to exploit the peculiar opto-electronic properties of J-aggregates for applications in nanodevices, one of the challenges of supramolecular science consists in obtaining a sort of “encoding” of the molecular building block that can lead to the desired formation of a J-aggregate. To this aim the aggregation can be controlled by modifying the molecular architecture through the substitution or introduction of peripheral groups,22–28 by complexation,29,30 by properly choosing the solvent,31,32 or by changing the solution properties.15–18 However, all these methods affect both the interactions among molecules and between molecules and the solvent, determining the final aggregated structure. For this reason, knowledge of the interactions involved in the aggregation process is very important.
It is now widely accepted that the interactions involved in J-aggregates are hydrophobic interactions, π–π stacking and electrostatic interactions (for charged moieties), with structural stabilization provided by hydrogen bonds.33 Some works have recently focused on clarifying the role of hydrogen bonding in the aggregation of conjugated molecules, providing evidence for the formation of a hydrogen bond network among molecules in both the solution34 and gel phase,35 and suggesting that it can determine the monomer arrangement inside the aggregate.36,37
Most of these studies, however, were performed in organic media in which there is no competition with the solvent, but an understanding of the interaction mechanism between porphyrins in water is very important in the design of new supramolecular systems that mimic natural systems, especially when applications in biologically-relevant nanodevices are considered.
Very recently,38 the effect of hydrogen bonding with water on the J-aggregate structure of a charged porphyrin was investigated through the isotopic substitution method. In that work the water–heavy water substitution under acidic conditions was shown to affect the exciton coupling between monomers in the aggregate.
The hydroxy–methoxy substitution was adopted in a study on chlorin derivatives in aqueous solution,39 in order to propose a structural model for bacteriochlorophyll self-organization. It was shown that, independently from the presence of OH or OCH3 peripheral groups, J-aggregates were formed and that the methoxy-substituted moiety was more prone to self-assembly.
The balance between π–π stacking and hydrogen bonding interactions was also investigated for a perilene bismide on glass substrate upon water vapor treatment.40 In that case, it was found that inter-dye hydrogen bonding in J-aggregates was disrupted in favour of the formation of hydrogen bonds with water molecules, leading to structural re-arrangements.
Herein we report a spectroscopic study on the aggregation of uncharged porphyrin derivatives in aqueous solution under diluted conditions; polyethylene glycol (PEG) chains were covalently linked to two opposite peripheral positions of the porphyrin macrocycle, with OH or OCH2CH3 groups in the other two positions (Fig. 1).
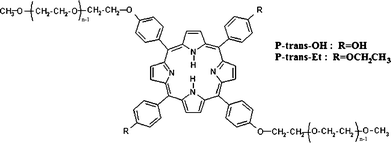 | ||
| Fig. 1 Structure of the investigated porphyrin derivatives (with n ≈ 17). | ||
In the case of the porphyrin derivatives proposed in the present paper, the balance between the hydrophobic interactions and hydrogen bonding contribution represents the key factor determining the formation of J- or H-type aggregates. The absence of charges allowed for more discriminating inter-porphyrin interactions and the aqueous medium, being a competitor for H-bonds, strengthens the role of hydrogen bonding between dyes. It will be shown that, in consequence of the substitution of OH with OCH2CH3 groups, the porphyrin arrangement in the aggregate changes from J- to H-type.
2 Experimental
2.1 Samples
The investigated samples were degassed aqueous solutions of 5,15-[p-(ω-methoxy-polyethyleneoxy)phenyl]-10,20-di[p-hydroxyphenyl]porphyrin (P-trans-OH) and 5,15-[p-(ω-methoxy-polyethyleneoxy)phenyl]-10,20-di[p-(ethylenoxy)phenyl]porphyrin (P-trans-Et), having an average molecular mass of about 2100 Da with a narrow polydispersity (Mw/Mn = 1.01). Their molecular structure is sketched in Fig. 1 and the synthesis details are reported in the ESI.†The concentration value in water and in tetrahydrofuran (THF) was 5 μM for both systems in all the experimental approaches, except only for the UV-vis measurements in THF (1.5 μM), due to the much higher extinction coefficient than in water.
2.2 UV-vis measurements
UV-visible spectra were recorded on a Shimadzu UV-1601 spectrophotometer at 25 ± 0.1 °C, using quartz cuvettes with a 1 cm path length and tetrahydrofuran or water as the solvent. The deconvolution of the spectra was performed by using the Gaussian band shape in the frequency domain (see ESI†).2.3 Steady-state fluorescence measurements
Fluorescence emission spectra were measured by means of a Varian Cary Eclipse Fluorescence spectrophotometer using cuvettes with a 1 cm path length at 25 °C ± 0.1 °C. For both emission and excitation spectra the resolution was set at 2.5 nm. By using the same instrument, a synchronous scan at the same wavelength was performed to measure the wavelength-dependence of the Rayleigh scattering.2.4 Time-resolved fluorescence spectroscopy
Time-resolved fluorescence measurements were carried out by a time-correlated single-photon-counting (TCSPC) home-made apparatus. A pulsed Ar+ laser, operating in the mode-locked regime at 514 nm and at a repetition rate of 82 MHz, was used to synchronously pump a rhodamine 6G dye laser, with an output wavelength of 580 nm.41 Before exciting the sample, the beam passed through a Glan–Taylor polarizer to eliminate any depolarization effect due to the mirrors placed along the laser optical pathway. The temperature of the sample was controlled within 0.1 °C at 25 °C. The collected time-resolved fluorescence data were then analyzed using the nonlinear least-squares iterative reconvolution procedure.The time dependence of the total fluorescence intensity can be described by a multiexponential decay:42
 | (1) |
 ).
).
Through a rotating analyzer selecting the vertically (IVV) and the horizontally (IVH) polarised fluorescence, it was possible to measure the time-resolved anisotropy, defined as:
 | (2) |
It was analyzed by considering an exponential decay r(t) = r0exp[−t/τR], r0 being the limiting anisotropy in the absence of rotational diffusion and τR the rotational correlation time.42 The latter is related to the volume, V, of the equivalent sphere through τR = ηV/(kBT) (where η is the viscosity of the solvent, T the absolute temperature and kB the Boltzmann constant).
2.5 Dynamic light scattering
A polarized He–Ne laser (632.8 nm) with a power of 35 mW was used as the source (for details see ref. 43) and the collected scattered light was sent to a Malvern 4700 submicrometer particle analyzer system to obtain the normalized scattered intensity autocorrelation function, g2(t), related to the normalized scattered electric field correlation function g1(t) through the Siegert relation g1(t) = [g2(t) − 1]1/2.44 The temperature was set at 25 °C ± 0.01 °C.Calculation of the size distribution was obtained through a Laplace inversion of g1(t) as:45,46
 | (3) |
The hydrodynamic radius RH was calculated using the Einstein–Stokes relation RH = kBT/(6πηD).
3 Results and discussion
In a previous paper,27 we reported that linking a PEG chain to all the four peripheral positions of a porphyrin macrocycle made the resulting species water-soluble for branches with a polymerization degree, n, equal to or higher than 17, whereas for n values lower than 4, the macromolecules were insoluble. For intermediate lengths a self-assembly generating fractal aggregates was observed. These results were rationalized by considering the hydrophilic/hydrophobic balance. Now, in order to focus the attention on the role played by the hydrogen bonding in the aggregation properties of porphyrin-based species, we synthesized porphyrins having a PEG chain (with n = 17) at the two opposite peripheral positions of the macrocycle and an OH group (P-trans-OH) or a OCH2CH3 group (P-trans-Et), in the other two positions (see Fig. 1).The extinction spectra of these species in THF (almost coincident), reported in the inset of Fig. 2, show the main absorption band (Soret) at 421 nm and display the typical absorption features of a free-base porphyrin macrocycle;48 in this solvent no effect due to the presence of the hydroxyl group appears. On the other hand, the Soret band profile of P-trans-OH and P-trans-Et in aqueous solution at the same concentration (Fig. 2) clearly shows the energy shifts of the nearly degenerate monomer band, originated from the formation of aggregates. These aggregated structures display different porphyrin arrangements: P-trans-OH mainly forms J-type aggregates (band at about 442 nm) whereas P-trans-Et forms H-type aggregates (band at about 405 nm).
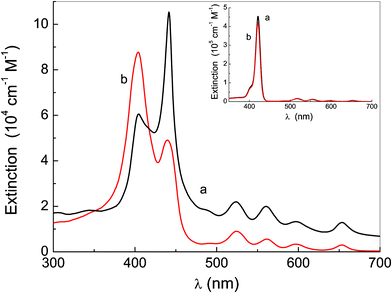 | ||
| Fig. 2 Extinction spectra of P-trans-OH (curve a) and P-trans-Et (curve b) in water. The inset shows the corresponding absorption spectra in THF. | ||
From the spectrum of P-trans-OH (Fig. 2, curve a) the band at 420 nm due to molecules in the monomeric form is also evident; an analogous band is not evident in the case of P-trans-Et in water, but the band deconvolution (reported in ESI†) shows its presence clearly. The monomer absorption band is not affected significantly by the solvent change.
The measured extinction spectra can be interpreted according to the Gouterman et al.49 approach to the exciton model, within the point dipole approximation (vibronic coupling50 was not considered). The interaction energy between the two transition dipole moments ![[small mu, Greek, vector]](https://www.rsc.org/images/entities/i_char_e0e9.gif) i of molecule i and
i of molecule i and ![[small mu, Greek, vector]](https://www.rsc.org/images/entities/i_char_e0e9.gif) j of molecule j is:
j of molecule j is:
 | (4) |
![[R with combining circumflex]](https://www.rsc.org/images/entities/i_char_0052_0302.gif) ij the corresponding unit vector.
ij the corresponding unit vector.
The excitation originating the absorption spectrum of free-base porphyrin monomers is described in terms of two (nearly) degenerate transitions (Bx and By) with mutually orthogonal transition dipole moments ![[small mu, Greek, vector]](https://www.rsc.org/images/entities/i_char_e0e9.gif) x and
x and ![[small mu, Greek, vector]](https://www.rsc.org/images/entities/i_char_e0e9.gif) y. Because any linear combination of them is equivalent,51 any direction of
y. Because any linear combination of them is equivalent,51 any direction of ![[small mu, Greek, vector]](https://www.rsc.org/images/entities/i_char_e0e9.gif) x and
x and ![[small mu, Greek, vector]](https://www.rsc.org/images/entities/i_char_e0e9.gif) y in the ring plane of both porphyrins is equivalent as well, provided that they remain mutually orthogonal. Thanks to this symmetry, let us consider, without losing generality, the plane containing
y in the ring plane of both porphyrins is equivalent as well, provided that they remain mutually orthogonal. Thanks to this symmetry, let us consider, without losing generality, the plane containing ![[small mu, Greek, vector]](https://www.rsc.org/images/entities/i_char_e0e9.gif) y of both porphyrins and
y of both porphyrins and ![[R with combining circumflex]](https://www.rsc.org/images/entities/i_char_0052_0302.gif) ij and call θ the angle between
ij and call θ the angle between ![[small mu, Greek, vector]](https://www.rsc.org/images/entities/i_char_e0e9.gif) y of the first porphyrin and
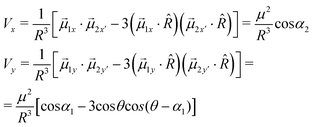
y of the first porphyrin and ![[R with combining circumflex]](https://www.rsc.org/images/entities/i_char_0052_0302.gif) ij, as sketched in Fig. 3b. Then, by applying simple geometrical considerations (see Appendix for details), eqn (4), written for both the transition moments, becomes:
ij, as sketched in Fig. 3b. Then, by applying simple geometrical considerations (see Appendix for details), eqn (4), written for both the transition moments, becomes:
 | (5) |
 | (6) |
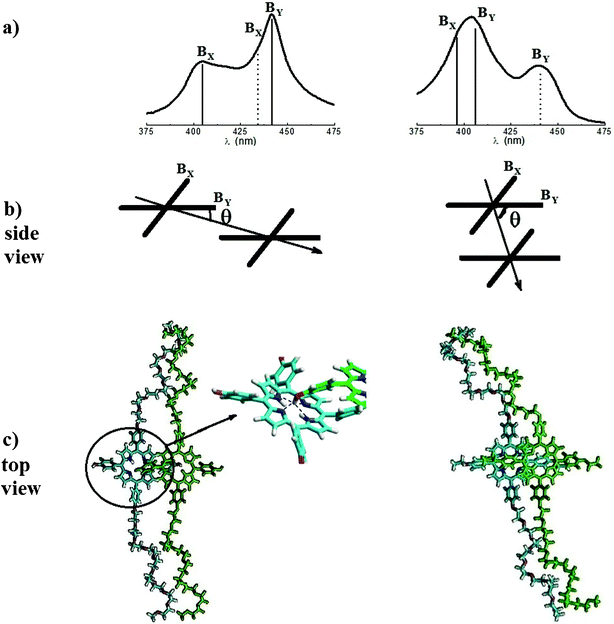 | ||
| Fig. 3 (a) Energy shift of the transition dipole moments in the aggregates of P-trans-OH (left) and of P-trans-Et (right) (the dotted lines represent the transitions with out-of-phase transition moments); (b) sketch of the porphyrin arrangement in a dimer; (c) porphyrin dimer structure obtained by optimization with MM+ calculations; the zoom of the P-trans-OH dimer structure indicates (with dashed lines) the average distance N⋯H between the nitrogen atoms of the porphyrin core and the hydrogen of the OH group of the adjacent macromolecule (about 0.28 nm). | ||
In the previous equation, α1 represents the angle between the ![[small mu, Greek, vector]](https://www.rsc.org/images/entities/i_char_e0e9.gif) y transition moments of the two interacting porphyrins and α2 the angle between the
y transition moments of the two interacting porphyrins and α2 the angle between the ![[small mu, Greek, vector]](https://www.rsc.org/images/entities/i_char_e0e9.gif) x ones (in the general case of non parallel porphyrin macrocycles).
x ones (in the general case of non parallel porphyrin macrocycles).
By following the exciton coupling theory of Kasha, an aggregate is considered J-type when θ < 55° and H-type for θ > 55°.
The resolved degeneracy (Davidov splitting) due to the exciton coupling gives rise to the states with symmetric energy shift with respect to the monomer, E = E0 ± V (i.e. with energy difference of 2Vx or 2Vy). In the simpler case for which α1 = α2 = 0, only the state corresponding to in-phase transition moment alignment is allowed. For J-type aggregates, the allowed transition is that at lower energy for ![[small mu, Greek, vector]](https://www.rsc.org/images/entities/i_char_e0e9.gif) y coupling (E0 − Vy, red-shifted absorption band with respect to the monomer) and at higher energy for
y coupling (E0 − Vy, red-shifted absorption band with respect to the monomer) and at higher energy for ![[small mu, Greek, vector]](https://www.rsc.org/images/entities/i_char_e0e9.gif) x coupling (E0 + Vx, blue-shifted absorption band with respect to the monomer). For H-type aggregates, on the other hand, the allowed transition is that at higher energy for both
x coupling (E0 + Vx, blue-shifted absorption band with respect to the monomer). For H-type aggregates, on the other hand, the allowed transition is that at higher energy for both ![[small mu, Greek, vector]](https://www.rsc.org/images/entities/i_char_e0e9.gif) x and
x and ![[small mu, Greek, vector]](https://www.rsc.org/images/entities/i_char_e0e9.gif) y coupling (E0 + Vx and E0 + Vy, blue-shifted absorption bands with respect to the monomer).
y coupling (E0 + Vx and E0 + Vy, blue-shifted absorption bands with respect to the monomer).
In the more general case in which the angle between the two coupled dipole moments (α1, or α2 or both) is not zero, the corresponding state with out-of-phase transition dipole moments has a non-zero transition probability.
For larger arrays formed by N exciton coupled porphyrins,52 the energy shift is related to the coupling interaction by:
 | (7) |
Through the band deconvolution of the Soret region in Fig. 2 (see ESI†), two main transitions appear for P-trans-OH, at about 442 nm and at about 405 nm; these asymmetric energy shifts with respect to the monomer can be attributed to the exciton coupling of ![[small mu, Greek, vector]](https://www.rsc.org/images/entities/i_char_e0e9.gif) x and
x and ![[small mu, Greek, vector]](https://www.rsc.org/images/entities/i_char_e0e9.gif) y with the corresponding components of the neighbouring porphyrins.49,53,54 Indeed, the energy shift, E − E0, measured from the extinction spectra (E0 ≈ 23
y with the corresponding components of the neighbouring porphyrins.49,53,54 Indeed, the energy shift, E − E0, measured from the extinction spectra (E0 ≈ 23![[thin space (1/6-em)]](https://www.rsc.org/images/entities/char_2009.gif) 800 cm−1) allows for calculating Vx and Vy through eqn (7), by setting N = 20. We obtain Vy ≈ −600 cm−1 and Vx ≈ +400 cm−1 (with N = 50 the result does not change appreciably, being Vy ≈ −595 cm−1 and Vx ≈ +395 cm−1).55 A weaker band is also present at about 435 nm, which, rather than being due to the presence of J-type oligomers, can be reasonably attributed to the transition to the state with out-of-phase transition moments and energy E0 − Vx, which is expected to have non-zero probability for a non-zero α2 angle between
800 cm−1) allows for calculating Vx and Vy through eqn (7), by setting N = 20. We obtain Vy ≈ −600 cm−1 and Vx ≈ +400 cm−1 (with N = 50 the result does not change appreciably, being Vy ≈ −595 cm−1 and Vx ≈ +395 cm−1).55 A weaker band is also present at about 435 nm, which, rather than being due to the presence of J-type oligomers, can be reasonably attributed to the transition to the state with out-of-phase transition moments and energy E0 − Vx, which is expected to have non-zero probability for a non-zero α2 angle between ![[small mu, Greek, vector]](https://www.rsc.org/images/entities/i_char_e0e9.gif) x of the two porphyrins.
x of the two porphyrins.
In order to make an estimation of θ and give a semiquantitative representation of the aggregate structure, we consider the case for which the ![[small mu, Greek, vector]](https://www.rsc.org/images/entities/i_char_e0e9.gif) y transition moments of two adjacent porphyrins are parallel (i.e. α1 = 0). The lack of a detectable absorption band at the E0 + Vy energy of the out-of-phase transition makes this consideration plausible. Then, from the ratio between Vy and Vx, it is calculated that θ ranges from 20° to 30° for α2 changing from 0 to 40°.
y transition moments of two adjacent porphyrins are parallel (i.e. α1 = 0). The lack of a detectable absorption band at the E0 + Vy energy of the out-of-phase transition makes this consideration plausible. Then, from the ratio between Vy and Vx, it is calculated that θ ranges from 20° to 30° for α2 changing from 0 to 40°.
In the P-trans-Et spectrum, the two main transitions clearly appear at 396 nm and 406 nm (see ESI†); because the ratio between Vy and Vx cannot exceed 1 by very much (depending on the values of α1 and α2), the energy shift of the aggregate's bands has to be assigned as follows: Vy ≈ +445 cm−1 and Vx ≈ +750 cm−1. Also in this case, only one weaker absorption band is observed and, due to its wavelength position at 441 nm, it is attributed to the transition to the state with out-of-phase transition moments for α1 ≠ 0 and energy E0 − Vy. Analogously to the previous case, we set α2 = 0, so that θ goes from 70° to 85° for α1 ranging from 0 to 40°.
As a matter of fact, we cannot exclude the possibility that the observed weaker absorption band of P-trans-Et constitutes two convolved bands, corresponding to the two out-of-phase transitions, which, due to their low intensity, cannot be safely resolved; in any case, it is calculated that even if both α1 and α2 vary from 0 to 40°, the range of θ reported above does not change significantly.
From the results discussed above, it follows that P-trans-OH molecules form J-type aggregates and P-trans-Et forms H-type ones.
A different local structure is also suggested by the dependence of Rayleigh light scattering from the wavelength. Fig. 4 shows that the resonant scattering12,56 only occurs for the P-trans-OH aqueous solution; on the other hand, the wavelength dependence of the scattering from P-trans-Et aqueous solution does not show any resonance, and hollows corresponding to the absorption bands clearly appear. This evidence indicates a larger coherence number for the P-trans-OH aggregates.
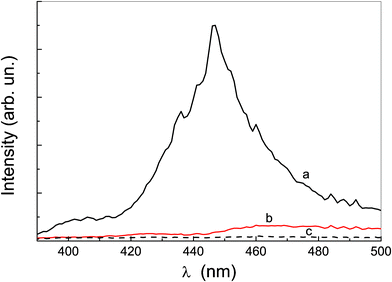 | ||
| Fig. 4 Rayleigh light scattering at different wavelengths for: (a) P-trans-OH aqueous solution, (b) P-trans-Et aqueous solution and (c) water. | ||
For both the transition dipole moments ![[small mu, Greek, vector]](https://www.rsc.org/images/entities/i_char_e0e9.gif) x and
x and ![[small mu, Greek, vector]](https://www.rsc.org/images/entities/i_char_e0e9.gif) y, μ ≈ 8D, as estimated from the extinction spectra in THF; by considering that μ should not change significantly in water and that the center-to-center distance R is related to the distance between the porphyrin planes r as R = r/sinθ, the aggregate geometry proposed above is consistent with the change of r from about 0.35 nm for the J-aggregates to about 0.7 for the H-aggregates (see eqn (5) and (6)).
y, μ ≈ 8D, as estimated from the extinction spectra in THF; by considering that μ should not change significantly in water and that the center-to-center distance R is related to the distance between the porphyrin planes r as R = r/sinθ, the aggregate geometry proposed above is consistent with the change of r from about 0.35 nm for the J-aggregates to about 0.7 for the H-aggregates (see eqn (5) and (6)).
In order to give a sketch of the local porphyrin arrangement of a dimer, MM+ calculations were carried out and the resulting structures are proposed in Fig. 3c. The average distance between the nitrogen atoms of the porphyrin core and the hydrogen of the OH group of the adjacent macromolecules is estimated to be about 0.28 nm, consistent with the possibility of forming a hydrogen bond.
The fluorescence emission spectrum of the solutions displays a main band at 655 nm and a smaller one at 724 nm, characteristic of this class of dyes (π ← π* transition), independently of the excitation wavelength in the Soret region (the same profile was also obtained by exciting at 580 nm, data not shown). The comparison of the emission spectrum in THF, reported in Fig. 5a (which is the same for both porphyrins), with that in water at different excitation wavelengths (Fig. 5b–d) shows no change in the emission wavelength upon aggregation.57 Such evidence cannot only be attributed to the fluorescence by the amount of non-aggregated monomer, because the excitation spectra of Fig. 6, obtained by collecting emissions at 655 nm, indicate that all the species contribute to the emission.
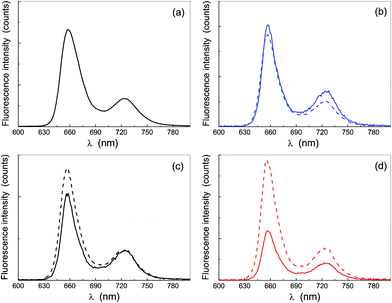 | ||
| Fig. 5 Fluorescence emission spectra corrected for the absorption (see text for details): in THF, for λexc = 420 nm (plot a), and in water for λexc = 405 nm (plot b), λexc = 420 nm (plot c) and λexc = 440 nm (plot d). The dashed curves refer to the solution of P-trans-OH and the continuous ones to P-trans-Et. | ||
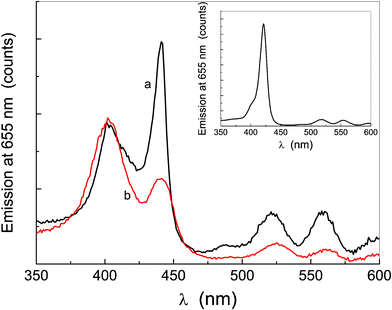 | ||
| Fig. 6 Excitation spectra of P-trans-OH (curve a) and P-trans-Et (curve b) in water; the inset shows the excitation spectrum of P-trans-OH in THF. The spectra are corrected for the absorption at the excitation wavelengths along the incident half-path and for that at 655 nm along the remaining half-path of the cuvette, analogously to the emission spectra, as described in the text in more detail. | ||
In order to illustrate this point more clearly, fluorescence was excited at the wavelength value of the corresponding absorption band centre. In Fig. 5 the fluorescence spectra are reported after correction for the absorption at the excitation wavelength along the incident half-path and for the so-called inner filter,42 namely the absorption of the emitted radiation along the remaining half-path of the cuvette, according to  , with ελexc and ε(λ) the extinction values at the excitation wavelength and at the emission wavelength, respectively, and Fmeas the measured emission.
In order to analyze more quantitatively the emission properties of the aggregated species of the porphyrin derivatives, time-resolved fluorescence experiments were carried out. Fluorescence emission decay curves, for both P-trans-OH and P-trans-Et in THF, are reported in Fig. 7 together with the fit obtained by a single exponential decay law. The lifetime is about 12 ns for both (see Table 1), the typical long-time emission phenomenon of a porphyrin monomer. Although the expected value of the rotational correlation time of a typical porphyrin in THF (about 250 ps) falls below the experimental resolution of the set-up used (which is about 400 ps), the presence of PEGs should slow down the rotational correlation time of the monomer and should allow for measuring the fluorescence anisotropy time decay. The absence of any detectable fluorescence anisotropy in both porphyrin derivatives, resulting from the inset of Fig. 7 for P-trans-OH as an example, indicates that the fluorescence is completely depolarized. It could happen, however, that at the wavelength of the exciting laser the relative angle between the absorption and emission dipoles is close to the magic angle (54.7°), corresponding to a fundamental anisotropy value r0 of zero.41
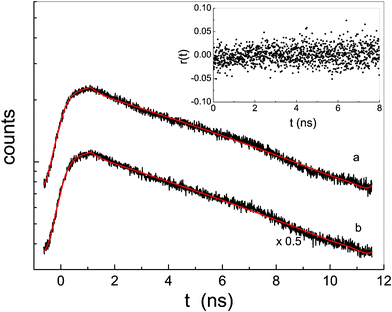 | ||
| Fig. 7 Fluorescence emission decay of P-trans-OH (curve a) and P-trans-Et (curve b) in THF (for clarity reasons the fluorescence emission of curve b has been divided by 2); the continuous line is the fit according to an exponential law after applying the deconvolution with the laser line. In the inset the time-resolved anisotropy of P-trans-OH is reported, as an example. | ||
The fluorescence emission decays of the two porphyrin systems are significantly different from one another in aqueous solution. Fig. 8 shows that the fluorescence lifetime of P-trans-OH (curve a) is strongly quenched, whereas that of P-trans-Et (curve b) is similar to that in THF solution. Moreover, the fit procedure indicates that the fluorescence emission decay of P-trans-OH is composed of two exponential decays: the main contribution has a lifetime of about 0.8 ns and the other has a lifetime of about 2.5 ns. This quenching effect is a typical consequence of J-aggregate formation, in which the electronic coupling between chromophores is strong. On the other hand, the decay of P-trans-Et remains mono-exponential with a lifetime of about 11 ns (see Table 1).
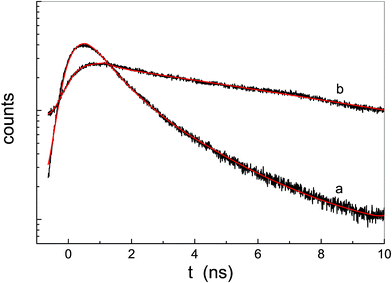 | ||
| Fig. 8 Fluorescence emission decay of P-trans-OH (curve a) and P-trans-Et (curve b) in water; the continuous lines are the fit results. | ||
The time-resolved fluorescence anisotropy decays reported in Fig. 9, however, indicate that in water r0 is non-zero and that the rotational correlation time is very long for both porphyrins because of the aggregation (fluorescence anisotropy does not decay in the time window explored). When the rotational correlation time is large compared to the fluorescence lifetime, the polarization of the fluorescence emission is at a maximum. The different values of r0 can be related to the porphyrin arrangements in the aggregates of the two derivatives for which the relative angle between the absorption and emission dipoles is different.
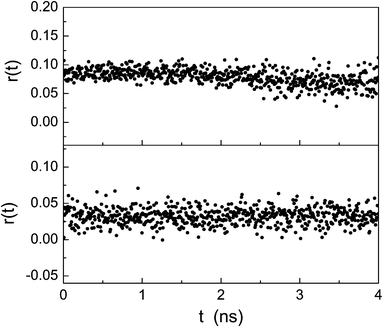 | ||
| Fig. 9 Time-resolved anisotropy of P-trans-OH (upper plot) and P-trans-Et (lower plot) in water. | ||
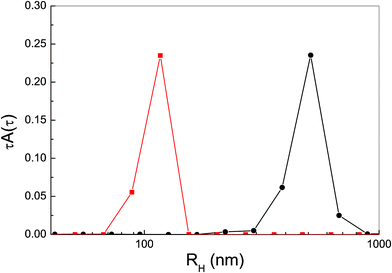 | ||
| Fig. 10 Size distribution of P-trans-OH (circles) and P-trans-Et (squares) aggregates in water. | ||
The fundamental anisotropy, r0, and the steady-state anisotropy, rS (reported in the last column of Table 1), independently measured, are related to each other through Perrin's equation rS = r0/[1 + (τ/τR)], in the case of single fluorescence lifetime and rotational correlation time.42 This relation can be used to estimate τR of P-trans-Et from the other measured quantities: it turns out to be about 20 ns. For the estimation of τR of P-trans-OH, for which the fluorescence decay is bi-exponential, an analogous relation involving both lifetimes (see ESI†) gives τR ≈ 3 ns. Therefore, for both porphyrin derivatives, the fluorescence emission process is characterized by a shorter lifetime than the rotational correlation time due to the presence of aggregated forms. As also reported in the literature for H-dimers58,59 and H-aggregate-surfactant complexes,60 the fluorescence lifetime of the H-type aggregate is similar to that of the monomer.
Despite being large enough to give rise to strongly polarized fluorescence emission, H-aggregates of P-trans-Et are smaller than P-trans-OH J-aggregates, as indicated by the size distribution in Fig. 10 obtained by dynamic light scattering. In fact, the average hydrodynamic radius, which is about 400 nm for P-trans-OH J-aggregates, becomes about 100 nm for P-trans-Et H-aggregates. The larger size of P-trans-OH aggregates is in line with the background observed in the extinction spectrum of Fig. 2.
The presence of the OH group (with a suitable H-O-phenyl angle) and its appropriate distance to the adjacent macrocycle allow for establishing H-bond interactions with the nitrogen of the core of the neighbor molecule; the directionality of hydrogen bonding plays a relevant role in determining the slipped arrangement of porphyrins and, hence, the formation of J-type aggregates. When only hydrophobic interactions are acting between the macrocycles, the face-to-face stacking (H-type structure) is the most favoured.
4 Conclusions
Proper modifications in the structure of porphyrin derivatives have been made to show evidence of the role of hydrogen bonding in J-aggregate formation. The lack of any charge in the systems investigated avoids the presence of electrostatic interactions, which can mask or alter the effect of the weaker H-bonding interactions.Both P-trans-OH and P-trans-Et porphyrin molecules form large aggregates, but the porphyrin moiety possessing hydroxyl groups (P-trans-OH) forms J-type aggregates, as proved by the presence of the red-shifted main extinction band and the significant shortening of the fluorescence lifetime. The substitution of OH with OCH2CH3 causes the formation of H-type aggregates, singled out by the blue-shifted transitions in the UV-Vis spectrum and the long fluorescence lifetime. Altogether, the results obtained from different spectroscopic techniques agree in indicating that, all other interaction mechanisms remaining the same, the possibility of porphyrins to interact also via hydrogen bonding drives the formation of J-type aggregates.
Appendix
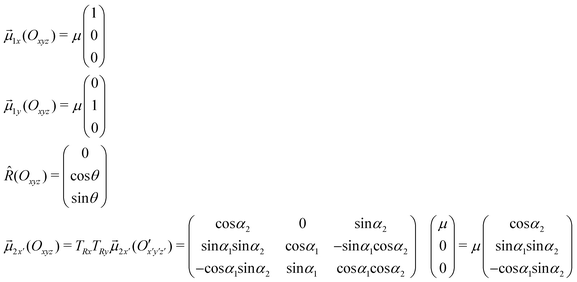
Details of the calculations for obtaining eqn (5)
From a general point of view, the relative position of two rigid bodies is located through six degrees of freedom, but if some symmetry can be singled out in the systems a lower number of parameters is required. For example, the geometrical description of the relative position of two porphyrins in the aggregate is performed by considering the coordinates of two discs for which the z-axes of the reference frames (Oxyz for the first porphyrin and O′x′y′z′ for the second porphyrin, with![[R with combining right harpoon above (vector)]](https://www.rsc.org/images/entities/i_char_0052_20d1.gif) the distance vector between O and O′) are perpendicular to each disc's plane and the x- and y-axes are directed along the transition dipole moments. The porphyrin is sketched as a disc because of the mutually orthogonal degenerate transition dipole moments, which make any linear combination of them, and hence any direction in the porphyrin ring plane, equivalent. Therefore, each porphyrin is symmetric under any rotation about its z-axis, allowing an arbitrary choice of direction of the transition dipole moments under the condition that
the distance vector between O and O′) are perpendicular to each disc's plane and the x- and y-axes are directed along the transition dipole moments. The porphyrin is sketched as a disc because of the mutually orthogonal degenerate transition dipole moments, which make any linear combination of them, and hence any direction in the porphyrin ring plane, equivalent. Therefore, each porphyrin is symmetric under any rotation about its z-axis, allowing an arbitrary choice of direction of the transition dipole moments under the condition that ![[small mu, Greek, vector]](https://www.rsc.org/images/entities/i_char_e0e9.gif) x and
x and ![[small mu, Greek, vector]](https://www.rsc.org/images/entities/i_char_e0e9.gif) y remain mutually orthogonal. Thanks to this symmetry and without losing generality,
y remain mutually orthogonal. Thanks to this symmetry and without losing generality, ![[small mu, Greek, vector]](https://www.rsc.org/images/entities/i_char_e0e9.gif) y and
y and ![[small mu, Greek, vector]](https://www.rsc.org/images/entities/i_char_e0e9.gif) y′ are chosen such that
y′ are chosen such that ![[small mu, Greek, vector]](https://www.rsc.org/images/entities/i_char_e0e9.gif) y,
y, ![[small mu, Greek, vector]](https://www.rsc.org/images/entities/i_char_e0e9.gif) y′,
y′, ![[R with combining circumflex]](https://www.rsc.org/images/entities/i_char_0052_0302.gif) and the z-axis are coplanar.
and the z-axis are coplanar.
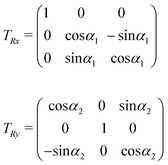
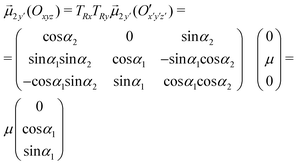
In order to describe the possibility that the two porphyrin rings are not parallel, the O′x′y′z′ reference frame is obtained by applying two rotations, one around x′ with angle α1 and then one around the so-obtained y′ with angle α2. The matrices describing each of these rotations are:
The coordinates in Oxyz and those in O′x′y′z′ are related through the following rotation matrix (rotations do not commute):
Therefore, the geometrical description of the transition dipole moments involves four degrees of freedom: (i) the distance | ![[R with combining right harpoon above (vector)]](https://www.rsc.org/images/entities/i_char_0052_20d1.gif) | between O and O′; (ii) the angle θ between
| between O and O′; (ii) the angle θ between ![[R with combining right harpoon above (vector)]](https://www.rsc.org/images/entities/i_char_0052_20d1.gif) and the y-axis; (iii) the angle α2 between x and x′; (iv) the angle α1 between y and y′.
and the y-axis; (iii) the angle α2 between x and x′; (iv) the angle α1 between y and y′.
Indeed, it is:
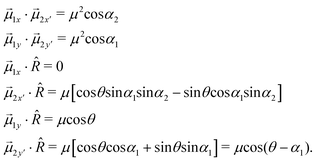
Then, the scalar products in eqn (4) give the following result:
By substituting the previous results in eqn (4), the x- and y-components become:
Note added after first publication
This article replaces the version published on 8 November 2012, which contained errors in the text where several of the![[small mu, Greek, vector]](https://www.rsc.org/images/entities/i_char_e0e9.gif) ,
, ![[R with combining right harpoon above (vector)]](https://www.rsc.org/images/entities/i_char_0052_20d1.gif) and
and ![[R with combining circumflex]](https://www.rsc.org/images/entities/i_char_0052_0302.gif) characters were incorrectly displayed.
characters were incorrectly displayed.
Acknowledgements
This work was supported by MIUR PRIN 2008 projects no. 2008KHW8K4 and 20088NTBKR and by PON 2010 (project PON 01-00074).References
- A. D. Schwab, D. E. Smith, B. Bond-Watts, D. E. Johnston, J. Hone, A. T. Johnson, J. C. de Paula and W. F. Smith, Nano Lett., 2004, 4, 1261–1265 CrossRef.
- N. C. Maiti, N. Periasamy and S. Mazumdar, J. Phys. Chem. B, 1998, 102, 1528–1538 CrossRef CAS.
- J. M. Ribò, J. Crusats, J. A. Farrera and M. L. Valero, J. Chem. Soc., Chem. Commun., 1994, 681–682 RSC.
- D. L. Akins, H. R. Zhu and C. Guo, J. Phys. Chem., 1994, 98, 3612–3618 CrossRef.
- D. Möbius, Adv. Mater., 1995, 7, 437–444 CrossRef.
- T. Kobayashi, J-Aggregates, World Scientific, Singapore, New York, 1996 Search PubMed.
- F. Würthner, E. Kaiser and C. Saha-Müller, Angew. Chem., Int. Ed., 2011, 50, 3376–3410 CrossRef.
- J. L. McHale, J. Phys. Chem. Lett., 2012, 3, 587–597 Search PubMed.
- T. Kano and H. Kobayashi, J. Chem. Phys., 2002, 116, 184–195 CrossRef CAS.
- T. Ogawa, E. Tokunaga and T. Kobayashi, Chem. Phys. Lett., 2005, 410, 18–23 CrossRef.
- E. Collini, C. Ferrante and R. Bozio, J. Phys. Chem. B, 2005, 109, 2–5 CrossRef CAS.
- R. Pasternack and P. Collings, Science, 1995, 269, 935–939 CrossRef CAS.
- J. Parkash, J. Robblee, J. Agnew, E. Gibbs, P. Collings, R. Pasternack and J. de Paula, Biophys. J., 1998, 74, 2089–2099 CrossRef CAS.
- M. Kasha, Radiat. Res., 1963, 20, 55–71 CrossRef CAS.
- N. Micali, V. Villari, M. Castriciano, A. Romeo and L. M. Scolaro, J. Phys. Chem. B, 2006, 110, 8289–8295 CrossRef CAS.
- M. Castriciano, A. Romeo, V. Villari, N. Micali and L. M. Scolaro, J. Phys. Chem. B, 2003, 107, 8765–8771 CrossRef CAS.
- S. C. M. Gandini, E. L. Gelamo, R. Itri and M. Tabak, Biophys. J., 2003, 85, 1259–1268 CrossRef CAS.
- J. V. Hollingsworth, A. J. Richard, M. G. H. Vicente and P. S. Russo, Biomacromolecules, 2012, 13, 60–72 Search PubMed.
- X. Hu and K. Schulten, Phys. Today, 1997, 50, 28–34 CrossRef CAS.
- R. Blankenship, J. Olson and M. Millar, in Anoxygenic photosynthetic bacteria, ed. R. Blankenship, M. Madigan and C. Bauer, Kluwer Academic Publishers, Dordrecht, 1995, pp. 399–435 Search PubMed.
- T. Balaban, H. Tamiaki and A. Holzwarth, in Supramolecular dye chemistry, ed. F. Wurthner, 2005, vol. 258, pp. 1–38 Search PubMed.
- L. Li, C. Yang, W. Chen and K. Lin, Angew. Chem., Int. Ed., 2003, 42, 1505–1508 CrossRef CAS.
- R. Pasternack and E. Gibbs, in Metal Ions in Biological Systems, 1996, vol. 33, pp. 367–397 Search PubMed.
- I. Beletskaya, V. S. Tyurin, A. Y. Tsivadze, R. Guilard and C. Stern, Chem. Rev., 2009, 109, 1659–1713 CrossRef CAS.
- C. J. Medforth, Z. Wang, K. E. Martin, Y. Song, J. L. Jacobsen and J. A. Shelnutt, Chem. Commun., 2009, 7261–7277 RSC.
- S. Ghosh, X.-Q. Li, V. Stepanenko and F. Würthner, Chem.–Eur. J., 2008, 14, 11343–11357 CrossRef CAS.
- N. Micali, V. Villari, P. Mineo, D. Vitalini, E. Scamporrino, V. Crupi, D. Majolino, P. Migliardo and V. Venuti, J. Phys. Chem. B, 2003, 107, 5095–5100 Search PubMed.
- K. Hosomizu, M. Oodoi, T. Umeyama, Y. Matano, K. Yoshida, S. Isoda, M. Isosomppi, N. V. Tkachenko, H. Lemmetyinen and H. Imahori, J. Phys. Chem. B, 2008, 112, 16517–16524 CrossRef CAS.
- S. Yagai, T. Seki, T. Karatsu, A. Kitamura and F. Würthner, Angew. Chem., Int. Ed., 2008, 47, 3367–3371 CrossRef CAS.
- R. Purrello, L. Scolaro, E. Bellacchio, S. Gurrieri and A. Romeo, Inorg. Chem., 1998, 37, 3647–3648 CrossRef CAS.
- G. De Luca, A. Romeo and L. M. Scolaro, J. Phys. Chem. B, 2006, 110, 14135–14141 CrossRef CAS.
- Y. Arai and H. Segawa, J. Phys. Chem. B, 2011, 115, 7773–7780 CrossRef CAS.
- C. M. Drain, A. Varotto and I. Radivojevic, Chem. Rev., 2009, 109, 1630–1658 CrossRef CAS.
- G. Lu, Y. Chen, Y. Zhang, M. Bao, Y. Bian, X. Li and J. Jiang, J. Am. Chem. Soc., 2008, 130, 11623–11630 CrossRef CAS.
- M. Shirakawa, S. Kawano, N. Fujita, K. Sada and S. Shinkai, J. Org. Chem., 2003, 68, 5037–5044 CrossRef CAS.
- T. E. Kaiser, V. Stepanenko and F. Wuerthner, J. Am. Chem. Soc., 2009, 131, 6719–6732 CrossRef CAS.
- B. Jancy and S. K. Asha, Chem. Mater., 2008, 20, 169–181 CrossRef CAS.
- C. C. Rich and J. L. McHale, Phys. Chem. Chem. Phys., 2012, 14, 2362–2374 RSC.
- T. Miyatake, S. Tanigawa, S. Kato and H. Tamiaki, Tetrahedron Lett., 2007, 48, 2251–2254 CrossRef CAS.
- Y. Tian, V. Stepanenko, T. E. Kaiser, F. Wuerthner and I. G. Scheblykin, Nanoscale, 2012, 4, 218–223 RSC.
- N. Angelini, N. Micali, V. Villari, P. Mineo, D. Vitalini and E. Scamporrino, Phys. Rev. E: Stat., Nonlinear, Soft Matter Phys., 2005, 71, 021915 Search PubMed.
- J. Lakowicz, Principles of Fluorescence Spectroscopy, Kluwer Academic Publishers, New York, 1999 Search PubMed.
- V. Villari and N. Micali, J. Pharm. Sci., 2008, 97, 1703–1730 CrossRef CAS.
- B. J. Berne and R. Pecora, Dynamic Light Scattering, Wiley-Interscience, New York, 1976 Search PubMed.
- P. Štěpánek, in Dynamic Light Scattering. The method and some applications, ed. W. Brown, Clarendon Press, Oxford, 1993, pp. 177–241 Search PubMed.
- B. Chu, Laser light scattering-basic principle and practice, San Diego, Academic, 1991 Search PubMed.
- S. Provencher, Comput. Phys. Commun., 1982, 27, 229–242 CrossRef.
- S. Matile, N. Berova, K. Nakanishi, J. Fleischauer and R. Woody, J. Am. Chem. Soc., 1996, 118, 5198–5206 CrossRef CAS.
- M. Gouterman, D. Holten and E. Lieberman, Chem. Phys., 1977, 25, 139–153 CrossRef CAS.
- F. C. Spano, Acc. Chem. Res., 2010, 43, 429–439 CrossRef CAS.
- G. Pescitelli, S. Gabriel, Y. Wang, J. Fleischhauer, R. Woody and N. Berova, J. Am. Chem. Soc., 2003, 125, 7613–7628 CrossRef CAS.
- Here N indicates the number of molecules constituting an exciton localization segment in a disordered aggregate.
- U. Siggel, U. Bindig, C. Endisch, T. Komatsu, E. Tsuchida, J. Voigt and J. Fuhrhop, Phys. Chem. Chem. Phys., 1996, 100, 2070–2075 Search PubMed.
- D. Kim and A. Osuka, J. Phys. Chem. A, 2003, 107, 8791–8816 CrossRef CAS.
- The uncertainty in the experimental determination of E0, due to the low amplitude of the monomer absorption band, is estimated to cause an uncertainty of ±50 cm−1 in the energy shift.
- M. Castriciano, A. Romeo, V. Villari, N. Micali and L. Scolaro, J. Phys. Chem. B, 2004, 108, 9054–9059 CrossRef CAS.
- R. Teixeira, S. M. Andrade, V. Vaz Serra, P. M. R. Paulo, A. Sánchez-Coronilla, M. G. P. M. S. Neves, J. A. S. Cavaleiro and S. M. B. Costa, J. Phys. Chem. B, 2012, 116, 2396–2404 Search PubMed.
- N. Maiti, M. Ravikanth, S. Mazumdar and N. Periasamy, J. Phys. Chem., 1995, 99, 17192–17197 CrossRef CAS.
- M. Castriciano, A. Romeo, V. Villari, N. Angelini, N. Micali and L. Scolaro, J. Phys. Chem. B, 2005, 109, 12086–12092 CrossRef CAS.
- N. Maiti, S. Mazumdar and N. Periasamy, J. Phys. Chem. B, 1998, 102, 1528–1538 CrossRef CAS.
Footnote |
| † Electronic supplementary information (ESI) available: Synthesis of the porphyrin derivatives. UV-vis spectra with deconvolution bands. Relation between fluorescence lifetimes and rotational correlation times. See DOI: 10.1039/c2ra22260d |
| This journal is © The Royal Society of Chemistry 2012 |

